SlideShare ist ein Scribd-Unternehmen logo
1 von 41
Do We Know that the
1990s were the Warmest
Decade of the Millennium?
    Stephen McIntyre
    climateaudit.org
    Toronto Ontario

    2009 International Conference on
    Climate Change
    New York
    March 9, 2009

1
Questions
1. How do they “know” that 1998 was the
   warmest year of the millennium?
                       They don’t. Minor variations
                       in data versions (e.g.
                       bristlecones) yield opposite
                       results.
2. Does it “matter”?
                       For “big” policy, probably not.
                       But it’s an interesting question
                       and statistics should be done
                       “right”.

2
IPCC 2001: The Rise of the Stick


The “Hockey Stick” graph, attributed to Mann et al (Nature 1998, GRL
1999 (MBH), occurred six times in IPCC TAR. Inset: John Houghton at
IPCC Press Conference, 2001
3
The Soundbites: “The Warmest
Decade and Year”
     The 20th century was the warmest in the Northern Hemisphere
    in the past 1000 years. The 1990s was the warmest decade on
    record and 1998 was the warmest year - in Canada and
    internationally. - David Anderson, April 5, 2002

    The 20th century was the warmest in the Northern Hemisphere
    for the past 1000 years and the 1990s the warmest decade on
    record... The science of climate change has been subjected to
    international scrutiny, open to all qualified experts, peer review,
    atmospheric modeling and process studies. – Liberal Party of
    Canada Caucus, Aug. 22, 2002


4
“As Dr Thompson’s Thermometer
Shows,…”


…the vaunted Medieval Warm Period (the third little red blip from the left below)
was tiny in comparison to the enormous increases in temperature in the last
half-century - the red peaks at the far right of the graph. These global-warming
skeptics - a group diminishing almost as rapidly as the mountain glaciers -
launched a fierce attack against another measurement of the 1000 year
correlation between CO2 and temperature known as the “hockey stick”, a
graphic image representing the research of climate scientist Michael Mann and
his colleagues.”
Gore actually shows Mann’s reconstruction spliced with the Jones
instrumental record.
 5
IPCC 2007: Spaghetti Graphs
    It is likely that this 50-year period was the warmest
    Northern Hemisphere period in the last 1.3 kyr,


               Excerpt from IPCC 2007 Box 6.4 Figure 1..


6
“Multivariate Calibration”
    McIntyre and McKitrick, 2009: “Paleoclimate
        reconstructions are an application of multivariate
        calibration, which provides a theoretical basis for
        confidence interval calculation (e.g., Osborne 1991;
        Brown and Sundberg, 1987). Inconsistency among
        proxies sharply inflates confidence intervals. Applying the
        inconsistency test of [Brown and Sundberg] to Mann et
        al. A.D. 1000 proxy data shows that finite confidence
        intervals cannot be defined before 1800.”

    MBH2009: The method of uncertainty estimation (use of
       calibration/validation residuals) is conventional
       [Luterbacher et al 2004; Wahl and Ammann 2007]


7
“Small and uninteresting
    perturbations” of data/technique
    de Leeuw (1988): We usually do not want a small
    and uninteresting perturbation of our data to have a
    large effect on the results of our technique. Classical
    statistics has always studied stability by using standard
    errors or confidence intervals. Gifi thinks this is much
    too narrow and other forms of stability are important as
    well…


8
MM2005 on “slight variations of
methods and data”


                    Redrawn from MM2005b


9
MBH98 AD1400 Proxies


10
There is no dispute over
properly specified calculations


  Top Left: MBH, 2003; top right; Bürger et al 2006; bottom –drawn
  from calculations using Wahl and Ammann 2007 algoithm. Middle-
  varies PC method (their Scenario 5); right - varies bristlecones (Their
11Scenario 6).
NAS 2006
 For periods prior to the 16th century, the
 Mann et al. (1999) reconstruction that uses
 this particular principal component analysis
 technique is strongly dependent on data
 from the Great Basin region in the western
 United States [bristlecones]….

 some reconstructions are not robust with
 respect to the removal of proxy records
 from individual regions (see, e.g., Wahl and
 Ammann in press)….

12
IPCC 2007
 The McIntyre and McKitrick 2005a,b criticism
 [relating to the extraction of the dominant
 modes of variability present in a network of
 western North American tree ring chrono-
 logies, using Principal Components Analysis]
 may have some theoretical foundation, but
 Wahl and Amman (2006) also show that the
 impact on the amplitude of the final
 reconstruction is very small (~0.05°C).


13
Wahl and Ammann (“in press
2005”; “in press 2006”; Sep. 2007)
     “when the full information in the proxy data is
     represented by the PC series [i.e. enough to get the
     bristlecones in], the impact of PC calculation methods
     on climate reconstruction in the MBH method is
     extremely small… a slight modification to the original
     Mann et al. reconstruction is justifiable for the first half
     of the 15th century (∼+0.05–0.10◦), which leaves
     entirely unaltered the primary conclusion of Mann et
     al.”…
     [Bristlecones add] “necessary verification skill” …
     “indicating that the records carry important climate
     information at the level of eigenvector patterns in global
     surface temperatures. These results are valid
     notwithstanding issues concerning these proxies’
     empirical relationship to local/regional surface
     temperatures after 1850”

14
Wegman 2006
     Wahl and Ammann [argue] that if one adds
     enough principal components back into the
     proxy, one obtains the hockey stick shape
     again. This is precisely the point of
     contention…

     A cardinal rule of statistical inference is that
     the method of analysis must be decided
     before looking at the data. The rules and
     strategy of analysis cannot be changed in
     order to obtain the desired result. Such a
     strategy carries no statistical integrity and
     cannot be used as a basis for drawing
     sound inferential conclusions.
15
A “Dozen Independent Studies”
 Mann (Senate Testimony, 2003): More than a dozen
    independent research groups have now reconstructed the
    average temperature of the northern hemisphere in past
    centuries..

 Wigley (AP Interview, 2003): about a dozen independent
     studies suggest the 20th century was warmer than normal,
     Wigley points out.

 Mann (Letter to House Committe, 2005): Recent work since
    the TAR has provided further support for this conclusion [
    the Stick], which is now common to more than a dozen
    independent studies published in the peer-reviewed
    scientific literature.

 Wikipedia 2009: More than a dozen independent research
     groups have now reconstructed the average temperature
     of the northern hemisphere in past centuries.
16
“Not Entirely Independent”
 IPCC 2007: As with the original TAR series, these new
 records are not entirely independent reconstructions
 inasmuch as there are some predictors (most often tree
 ring data and particularly in the early centuries) that are
 common between them, but in general, they represent
 some expansion in the length and geographical
 coverage of the previously available data (Figures 6.10
 and 6.11

 NAS 2006: Because the data are so limited, different
 large-scale reconstructions are sometimes based on the
 same datasets, and thus cannot be considered as
 completely independent.


17
Key proxies are repeated in so-called
 “independent” spaghetti graph studies


     Above – Adapted from Wegman 2006 Figure 5.8. Bristlecones/
     foxtails are used in all but three spaghetti graph studies. Polar Urals
     and Tornetrask versions re used in every study.


18
Ecologists: warm California MWP
Miller et al 2006 (Quat Res): “Using contemporary distributions of
the species, we modeled paleoclimate during [the MWP] to be
significantly warmer (+3.2 deg C annual minimum temperature)
and slightly drier (-24 mm annual precipitation) than present.


  Left- Bristlecone treeline (Lamarche 1973) declined since MWP; right –
  Subfossil medieval trees above present treeline at Whitewing Mt, Sierra
  Nevadas, California.

19
“Heavy” Equipment
          IPCC 2007: the possibility of investigating
          [these issues] further is restricted by the
          lack of recent tree ring data at most of the
          sites from which tree ring data discussed in
          this chapter were acquired

          Michael Mann: paleoclimatologists are
          attempting to update many important proxy
          records to the present, this is a costly, and
          labor-intensive activity, often requiring
          expensive field campaigns that involve
          traveling with heavy equipment to difficult-
          to-reach locations (such as high-elevation or
          remote polar sites). For historical reasons,
          many of the important records were
          obtained in the 1970s and 1980s and have
          yet to be updated.
20
Ababneh 2006 did not replicate
Graybill’s bristlecone chronology


 Left – red – MBH PC1 (used in IPCC 2007 Box 6.4) ; green – Graybill
 Sheep Mt chronology. Right - Ababneh (2006, 2007) chronology.. All
 series scaled to 1400-1980. 950-1100 and 1856-1980 highlighted.


21
Almagre CO Bristlecones are not
setting records
 Decline in recent portion of the chronology. The most noticeable
 feature is the low growth in the1840-50s – associated with
 drought in other Colorado tree ring chronologies.


        Left- MBH PC1 (bristleocnes); right – updated Almagere
        chronology. In dimensionless chronology units, basis 1.


22
Controversial “Starbucks Hypothesis”
  Proven!


Left – 7 am at Starbucks, Colorado Springs; right – bristlecones at 3600 m;


  23
Almagre program identified exact trees during
update and measurements online within 3 months


 Left – Pete Holzmann sampling Tree 31 in 2007; right- Donald Graybill
 sampling same tree in 1987.


24
Strip Bark: simple statistical models
don’t apply


Graybill and Idso 1993: Another tree selection factor that is crucial to our
findings involves tree form... [Strip bark trees] were the primary focus of
investigation wherever possible, (Brunstein USGS
2006http://www.climateaudit.org/?p=2239


25
Key proxies are used over and over.


     Above – From Wegman 2006 Figure 5.8 showing proxy overlap;
     IPCC 2007 Box 6.4 Fig 1.


26
Polar Urals: Briffa (Jones) 1995


Above – Polar Urals version of Briffa et al 1995, used in Jones et al 1998
reconstruction. All series scaled to scale of Briffa et al 1995. 950-1100 and 1856-1980
highlighted.


 27
Evidence for warm MWP in Siberia


     Left - Polar Urals treeline declined since Medieval Warm Period (from
     Shiyatov 1995); right – subfossil medieval trees in foreground above
     modern treeline in background (Esper);


28
Polar Urals Update


     Above – Polar Urals version incorporated into Esper et al 2002. All
     series scaled to scale of Briffa et al 1995. 950-1100 and 1856-1980
     highlighted.


29
Yamal Substitution (Briffa 2000)


     Above - Yamal chronology from Briffa 2000, used in all but one
     subsequent study. All series scaled to scale of Briffa et al 1995. 950-
     1100 and 1856-1980 highlighted.


30
Tornetrask: Briffa 2000 vs Grudd
  2006


Left – Version used in IPCC 2007. Right - Grudd 2006. All series scaled to scale
of Briffa et al 1995. 950-1100 and 1856-1980 highlighted.


  31
Are ice cores any help?

    wide variety of ice core

    patterns since MWP.
    δO18 at Mt Logan,

    Yukon went down in
    20th (attributed to
    regional change);
    Elevated δO18 at Law

    Dome, Antarctica ignored
    by NAS panel


                               Ice core δO18 from N to S.
    32
Different Spaghetti Recipes


NRC panel used 4 reconstructions as comfort for comparing
modern-medieval levels, but did not verify that cited
reconstructions met proxy quality standards. Medieval-modern
relationship reverses with trivial and justifiable variations in proxy
selection.
   33
Glacier Retreat: Alberta

               Retreat of Saskatchewan Glacier (in
               Alberta) in 1999 exposed in situ stumps
               dated ~2800-2900 BP (14C) presumably
               not exposed in MWP
               In… August 1999, a severe rainstorm resulted in stream
               avulsion along the NE flank of the Saskatchewan Glacier snout
               … When first examined in early September, erosion through a
               3- to 5- m sequence of glacial outwash and overlying till had
               exposed 17 sheared stumps rooted within a well-preserved
               paleosol …. By September 2000, the meltwater channel had
               shifter southward and had eroded through 5 m of fluted moraine
               deposits exposing 2 additional rooted stumps and flushing an
               additional 40 detrital boles onto the outwash surface. The
               stumps were rooted in a deeply weathered pedogenic surface
               and prior to their exposure were buried by 3-5 m of sediment. …
               With one exception, these dates collectively reflect the
               consequences of a single Neoglacial advance of the
               Saskatchewan Glacier into an established valley bottom forest.


34
Quelccaya Glacier, Peru

           Distichia muscoides, a component of
           Andean peat deposits, exposed in recent
           Quelccaya glacier retreat. Present limit is
           400-500 m lower than the discovery.
           Peat samples have a wide variety of
           14C dates - many about 4500 BP.


35
Green Alps


Left- modern view of a pass in the Alps (with glacier lines of 1922
and 1856); right - Schlüchter and Jörin 2004 reconstruction of view
Roman times of 2000 years ago


   36
Does it matter?


37
Why did IPCC feature the “least
important” figure?
 It is one of those odd ironies that the figure that everyone
 keeps talking about is actually the least important from the
 point of view of understanding climate responses to forcing.
 Gavin Schmidt, 2005


38
Is it the “Least Important” Figure?


 Left: IPCC 2001 Synthesis for Policy makers Figure SPM-10b with MBH
 reconstruction; Right: IPCC 1990 version of Lamb (about 1 deg range)
 together with IPCC 2007 SPM range of scenarios: yellow shows
 “constant 2000 GHG”.


39
“Worse than We Thought”
There is (yet another) odd inversion about: the idea that if
we were to switch from, say, MBH (less variance) to Moberg
(more) that would somehow imply a reduction in expected
future warming. That is completely wrong. If the past
temperatures varied more, it implies a *higher* sensitivity to
forcing, and therefore a *higher* future William Connolley,
2005


40
Visit www.climateaudit.org for
ongoing discussion.


Presentation will be posted at
www.climateaudit.org/pdf/newyork09
with bibliography


41

Weitere ähnliche Inhalte

Was ist angesagt?

Presentation at Adaptation Futures 2016 Conference
Presentation at Adaptation Futures 2016 ConferencePresentation at Adaptation Futures 2016 Conference
Presentation at Adaptation Futures 2016 Conferencethe climate data factory
 
Coupled general circulation modeling
Coupled general circulation modelingCoupled general circulation modeling
Coupled general circulation modelingAbsar Ahmed
 
General circulation model
General circulation modelGeneral circulation model
General circulation modelAbsar Ahmed
 
Krishna AchutaRao - Uncertainty from above - can it be reduced?
Krishna AchutaRao - Uncertainty from above - can it be reduced?Krishna AchutaRao - Uncertainty from above - can it be reduced?
Krishna AchutaRao - Uncertainty from above - can it be reduced?STEPS Centre
 
Comparison of Latent Heat Flux Using Aerodynamic Methods and Using the Penman...
Comparison of Latent Heat Flux Using Aerodynamic Methods and Using the Penman...Comparison of Latent Heat Flux Using Aerodynamic Methods and Using the Penman...
Comparison of Latent Heat Flux Using Aerodynamic Methods and Using the Penman...Ramesh Dhungel
 
JRC/EU Bias Correction Workshop
JRC/EU Bias Correction WorkshopJRC/EU Bias Correction Workshop
JRC/EU Bias Correction WorkshopHarilaos Loukos
 
Climate science part 3 - climate models and predicted climate change
Climate science part 3 - climate models and predicted climate changeClimate science part 3 - climate models and predicted climate change
Climate science part 3 - climate models and predicted climate changeLPE Learning Center
 
SIMULATION OF VAPOR AND HEAT FLUXES OVER WET AND DRY REGIME IN PADDY FIELD EN...
SIMULATION OF VAPOR AND HEAT FLUXES OVER WET AND DRY REGIME IN PADDY FIELD EN...SIMULATION OF VAPOR AND HEAT FLUXES OVER WET AND DRY REGIME IN PADDY FIELD EN...
SIMULATION OF VAPOR AND HEAT FLUXES OVER WET AND DRY REGIME IN PADDY FIELD EN...IAEME Publication
 
TCDF Pitch at ECCA 2017 Innovation Day
TCDF Pitch at ECCA 2017 Innovation Day TCDF Pitch at ECCA 2017 Innovation Day
TCDF Pitch at ECCA 2017 Innovation Day Harilaos Loukos
 
2015Sum_LaRC_ArizonaHAQ_Presentation_FD
2015Sum_LaRC_ArizonaHAQ_Presentation_FD2015Sum_LaRC_ArizonaHAQ_Presentation_FD
2015Sum_LaRC_ArizonaHAQ_Presentation_FDEmma Singh Baghel
 
Internet climate adaptation and preparednessstrategy
Internet climate adaptation and preparednessstrategyInternet climate adaptation and preparednessstrategy
Internet climate adaptation and preparednessstrategyBill St. Arnaud
 
Climate Modeling and Future Climate Change Projections
Climate Modeling and Future Climate Change ProjectionsClimate Modeling and Future Climate Change Projections
Climate Modeling and Future Climate Change ProjectionsJesbin Baidya
 
Using landsat 8 data to explorethe correlation between urban heat island and ...
Using landsat 8 data to explorethe correlation between urban heat island and ...Using landsat 8 data to explorethe correlation between urban heat island and ...
Using landsat 8 data to explorethe correlation between urban heat island and ...eSAT Journals
 
Turkish Revised Catalogue (1900-2012)
Turkish Revised Catalogue (1900-2012)Turkish Revised Catalogue (1900-2012)
Turkish Revised Catalogue (1900-2012)Ali Osman Öncel
 

Was ist angesagt? (20)

Presentation at Adaptation Futures 2016 Conference
Presentation at Adaptation Futures 2016 ConferencePresentation at Adaptation Futures 2016 Conference
Presentation at Adaptation Futures 2016 Conference
 
EC-Earth Climate Modelling Activities - Ray McGrath, Met Eireann
EC-Earth Climate Modelling Activities - Ray McGrath, Met EireannEC-Earth Climate Modelling Activities - Ray McGrath, Met Eireann
EC-Earth Climate Modelling Activities - Ray McGrath, Met Eireann
 
Coupled general circulation modeling
Coupled general circulation modelingCoupled general circulation modeling
Coupled general circulation modeling
 
General circulation model
General circulation modelGeneral circulation model
General circulation model
 
Krishna AchutaRao - Uncertainty from above - can it be reduced?
Krishna AchutaRao - Uncertainty from above - can it be reduced?Krishna AchutaRao - Uncertainty from above - can it be reduced?
Krishna AchutaRao - Uncertainty from above - can it be reduced?
 
Comparison of Latent Heat Flux Using Aerodynamic Methods and Using the Penman...
Comparison of Latent Heat Flux Using Aerodynamic Methods and Using the Penman...Comparison of Latent Heat Flux Using Aerodynamic Methods and Using the Penman...
Comparison of Latent Heat Flux Using Aerodynamic Methods and Using the Penman...
 
JRC/EU Bias Correction Workshop
JRC/EU Bias Correction WorkshopJRC/EU Bias Correction Workshop
JRC/EU Bias Correction Workshop
 
Climate science part 3 - climate models and predicted climate change
Climate science part 3 - climate models and predicted climate changeClimate science part 3 - climate models and predicted climate change
Climate science part 3 - climate models and predicted climate change
 
SIMULATION OF VAPOR AND HEAT FLUXES OVER WET AND DRY REGIME IN PADDY FIELD EN...
SIMULATION OF VAPOR AND HEAT FLUXES OVER WET AND DRY REGIME IN PADDY FIELD EN...SIMULATION OF VAPOR AND HEAT FLUXES OVER WET AND DRY REGIME IN PADDY FIELD EN...
SIMULATION OF VAPOR AND HEAT FLUXES OVER WET AND DRY REGIME IN PADDY FIELD EN...
 
TCDF Pitch at ECCA 2017 Innovation Day
TCDF Pitch at ECCA 2017 Innovation Day TCDF Pitch at ECCA 2017 Innovation Day
TCDF Pitch at ECCA 2017 Innovation Day
 
2015Sum_LaRC_ArizonaHAQ_Presentation_FD
2015Sum_LaRC_ArizonaHAQ_Presentation_FD2015Sum_LaRC_ArizonaHAQ_Presentation_FD
2015Sum_LaRC_ArizonaHAQ_Presentation_FD
 
Watergauges
WatergaugesWatergauges
Watergauges
 
Internet climate adaptation and preparednessstrategy
Internet climate adaptation and preparednessstrategyInternet climate adaptation and preparednessstrategy
Internet climate adaptation and preparednessstrategy
 
Climate Modeling and Future Climate Change Projections
Climate Modeling and Future Climate Change ProjectionsClimate Modeling and Future Climate Change Projections
Climate Modeling and Future Climate Change Projections
 
Longwave radiation
Longwave radiationLongwave radiation
Longwave radiation
 
Using landsat 8 data to explorethe correlation between urban heat island and ...
Using landsat 8 data to explorethe correlation between urban heat island and ...Using landsat 8 data to explorethe correlation between urban heat island and ...
Using landsat 8 data to explorethe correlation between urban heat island and ...
 
Climate Models
Climate Models Climate Models
Climate Models
 
Turkish Revised Catalogue (1900-2012)
Turkish Revised Catalogue (1900-2012)Turkish Revised Catalogue (1900-2012)
Turkish Revised Catalogue (1900-2012)
 
Climate Modelling
Climate ModellingClimate Modelling
Climate Modelling
 
WGI: Overview
WGI: OverviewWGI: Overview
WGI: Overview
 

Andere mochten auch

Metodología de la investigación #02
Metodología de la investigación #02 Metodología de la investigación #02
Metodología de la investigación #02 Wladimir Illescas
 
Metodología de la investigación #01
Metodología de la investigación #01 Metodología de la investigación #01
Metodología de la investigación #01 Wladimir Illescas
 
Wikipedia vs. escritura académica
Wikipedia vs. escritura académicaWikipedia vs. escritura académica
Wikipedia vs. escritura académicaWladimir Illescas
 
RESPUESTA DEL CULTIVO DE LA COLIFLOR (Brassica oleracea L.) A TRES NIVELES DE...
RESPUESTA DEL CULTIVO DE LA COLIFLOR (Brassica oleracea L.) A TRES NIVELES DE...RESPUESTA DEL CULTIVO DE LA COLIFLOR (Brassica oleracea L.) A TRES NIVELES DE...
RESPUESTA DEL CULTIVO DE LA COLIFLOR (Brassica oleracea L.) A TRES NIVELES DE...Wladimir Illescas
 
Variables en investigación aplicada, introducción
Variables en investigación aplicada, introducciónVariables en investigación aplicada, introducción
Variables en investigación aplicada, introducciónWladimir Illescas
 
Paneles solares: eficiencia en función de material particulado. Guayaquil.
Paneles solares: eficiencia en función de material particulado. Guayaquil.Paneles solares: eficiencia en función de material particulado. Guayaquil.
Paneles solares: eficiencia en función de material particulado. Guayaquil.Wladimir Illescas
 

Andere mochten auch (14)

Temas alimentos
Temas alimentosTemas alimentos
Temas alimentos
 
¿Por qué citamos?
¿Por qué citamos?¿Por qué citamos?
¿Por qué citamos?
 
Marketing&ventas03
Marketing&ventas03 Marketing&ventas03
Marketing&ventas03
 
Citación y referenciación
Citación y referenciaciónCitación y referenciación
Citación y referenciación
 
Imágenes cc
Imágenes ccImágenes cc
Imágenes cc
 
Metodología de la investigación #02
Metodología de la investigación #02 Metodología de la investigación #02
Metodología de la investigación #02
 
Metodología de la investigación #01
Metodología de la investigación #01 Metodología de la investigación #01
Metodología de la investigación #01
 
Cuadros y figuras
Cuadros y figurasCuadros y figuras
Cuadros y figuras
 
Proyecto tesis 2 #01
Proyecto tesis 2 #01 Proyecto tesis 2 #01
Proyecto tesis 2 #01
 
Wikipedia vs. escritura académica
Wikipedia vs. escritura académicaWikipedia vs. escritura académica
Wikipedia vs. escritura académica
 
Marketing&ventas 01
Marketing&ventas 01Marketing&ventas 01
Marketing&ventas 01
 
RESPUESTA DEL CULTIVO DE LA COLIFLOR (Brassica oleracea L.) A TRES NIVELES DE...
RESPUESTA DEL CULTIVO DE LA COLIFLOR (Brassica oleracea L.) A TRES NIVELES DE...RESPUESTA DEL CULTIVO DE LA COLIFLOR (Brassica oleracea L.) A TRES NIVELES DE...
RESPUESTA DEL CULTIVO DE LA COLIFLOR (Brassica oleracea L.) A TRES NIVELES DE...
 
Variables en investigación aplicada, introducción
Variables en investigación aplicada, introducciónVariables en investigación aplicada, introducción
Variables en investigación aplicada, introducción
 
Paneles solares: eficiencia en función de material particulado. Guayaquil.
Paneles solares: eficiencia en función de material particulado. Guayaquil.Paneles solares: eficiencia en función de material particulado. Guayaquil.
Paneles solares: eficiencia en función de material particulado. Guayaquil.
 

Ähnlich wie Steve's presentation at ICCC 2009(Stephen Mc Intyre)

Changes in the atmosphere
Changes in the atmosphereChanges in the atmosphere
Changes in the atmospherecdenef
 
Arctic climate Change: observed and modelled temperature and sea-ice variability
Arctic climate Change: observed and modelled temperature and sea-ice variabilityArctic climate Change: observed and modelled temperature and sea-ice variability
Arctic climate Change: observed and modelled temperature and sea-ice variabilitySimoneBoccuccia
 
Climate change: Changes in the atmosphere
Climate change: Changes in the atmosphereClimate change: Changes in the atmosphere
Climate change: Changes in the atmospherecdenef
 
2010 mcintyre-heartland_2010.pptx
2010 mcintyre-heartland_2010.pptx2010 mcintyre-heartland_2010.pptx
2010 mcintyre-heartland_2010.pptxStephenMcIntyre17
 
How do we study recent climate change? Development of global temperature data...
How do we study recent climate change? Development of global temperature data...How do we study recent climate change? Development of global temperature data...
How do we study recent climate change? Development of global temperature data...Tim Osborn
 
Tp climate change-101-2
Tp climate change-101-2Tp climate change-101-2
Tp climate change-101-2TMN-COT
 
A Pinatubo Climate Modeling Investigation
A Pinatubo Climate Modeling InvestigationA Pinatubo Climate Modeling Investigation
A Pinatubo Climate Modeling InvestigationJody Sullivan
 
Weber conference on Climate Change
Weber conference on Climate ChangeWeber conference on Climate Change
Weber conference on Climate Changedesdeelexilio
 
Trends in-extreme-weather-events-since-1900--an-enduring-conundrum-for-wise-p...
Trends in-extreme-weather-events-since-1900--an-enduring-conundrum-for-wise-p...Trends in-extreme-weather-events-since-1900--an-enduring-conundrum-for-wise-p...
Trends in-extreme-weather-events-since-1900--an-enduring-conundrum-for-wise-p...Anochi.com.
 
The scientific consensus on Climate Changes
The scientific consensus on Climate ChangesThe scientific consensus on Climate Changes
The scientific consensus on Climate ChangesSimoneBoccuccia
 
IPCC AR6 August 2021 report review
IPCC AR6 August 2021 report reviewIPCC AR6 August 2021 report review
IPCC AR6 August 2021 report reviewMarie-Paule Odini
 
Key messages from the AR5 WGI with focus on Saudi Arabia and the region
Key messages from the AR5 WGI with focus on Saudi Arabia and the regionKey messages from the AR5 WGI with focus on Saudi Arabia and the region
Key messages from the AR5 WGI with focus on Saudi Arabia and the regionJesbin Baidya
 
WebbACPM15gdhjggder59jgfhjfsfhhbvvgv.ppt
WebbACPM15gdhjggder59jgfhjfsfhhbvvgv.pptWebbACPM15gdhjggder59jgfhjfsfhhbvvgv.ppt
WebbACPM15gdhjggder59jgfhjfsfhhbvvgv.pptSravyaPendem1
 
Climate Change: Addressing the Major Skeptic Arguments
Climate Change: Addressing the Major Skeptic ArgumentsClimate Change: Addressing the Major Skeptic Arguments
Climate Change: Addressing the Major Skeptic ArgumentsAlexander Ainslie
 

Ähnlich wie Steve's presentation at ICCC 2009(Stephen Mc Intyre) (20)

Changes in the atmosphere
Changes in the atmosphereChanges in the atmosphere
Changes in the atmosphere
 
Arctic climate Change: observed and modelled temperature and sea-ice variability
Arctic climate Change: observed and modelled temperature and sea-ice variabilityArctic climate Change: observed and modelled temperature and sea-ice variability
Arctic climate Change: observed and modelled temperature and sea-ice variability
 
Climate change: Changes in the atmosphere
Climate change: Changes in the atmosphereClimate change: Changes in the atmosphere
Climate change: Changes in the atmosphere
 
2010 mcintyre-heartland_2010.pptx
2010 mcintyre-heartland_2010.pptx2010 mcintyre-heartland_2010.pptx
2010 mcintyre-heartland_2010.pptx
 
How do we study recent climate change? Development of global temperature data...
How do we study recent climate change? Development of global temperature data...How do we study recent climate change? Development of global temperature data...
How do we study recent climate change? Development of global temperature data...
 
Tp climate change-101-2
Tp climate change-101-2Tp climate change-101-2
Tp climate change-101-2
 
A Pinatubo Climate Modeling Investigation
A Pinatubo Climate Modeling InvestigationA Pinatubo Climate Modeling Investigation
A Pinatubo Climate Modeling Investigation
 
Climate: Past, Present, Future [Prof John McClatchey]
Climate: Past, Present, Future [Prof John McClatchey]Climate: Past, Present, Future [Prof John McClatchey]
Climate: Past, Present, Future [Prof John McClatchey]
 
Weber conference on Climate Change
Weber conference on Climate ChangeWeber conference on Climate Change
Weber conference on Climate Change
 
A Defense of Jim Hansen's Climate Conclusions
A Defense of Jim Hansen's Climate ConclusionsA Defense of Jim Hansen's Climate Conclusions
A Defense of Jim Hansen's Climate Conclusions
 
Climate
ClimateClimate
Climate
 
Trends in-extreme-weather-events-since-1900--an-enduring-conundrum-for-wise-p...
Trends in-extreme-weather-events-since-1900--an-enduring-conundrum-for-wise-p...Trends in-extreme-weather-events-since-1900--an-enduring-conundrum-for-wise-p...
Trends in-extreme-weather-events-since-1900--an-enduring-conundrum-for-wise-p...
 
The scientific consensus on Climate Changes
The scientific consensus on Climate ChangesThe scientific consensus on Climate Changes
The scientific consensus on Climate Changes
 
An Expanded Critique of Some Climate Conclusions
An Expanded Critique of Some Climate ConclusionsAn Expanded Critique of Some Climate Conclusions
An Expanded Critique of Some Climate Conclusions
 
IPCC AR6 August 2021 report review
IPCC AR6 August 2021 report reviewIPCC AR6 August 2021 report review
IPCC AR6 August 2021 report review
 
03_Day_1_Hansen
03_Day_1_Hansen03_Day_1_Hansen
03_Day_1_Hansen
 
Key messages from the AR5 WGI with focus on Saudi Arabia and the region
Key messages from the AR5 WGI with focus on Saudi Arabia and the regionKey messages from the AR5 WGI with focus on Saudi Arabia and the region
Key messages from the AR5 WGI with focus on Saudi Arabia and the region
 
WebbACPM15gdhjggder59jgfhjfsfhhbvvgv.ppt
WebbACPM15gdhjggder59jgfhjfsfhhbvvgv.pptWebbACPM15gdhjggder59jgfhjfsfhhbvvgv.ppt
WebbACPM15gdhjggder59jgfhjfsfhhbvvgv.ppt
 
Climate Change: Addressing the Major Skeptic Arguments
Climate Change: Addressing the Major Skeptic ArgumentsClimate Change: Addressing the Major Skeptic Arguments
Climate Change: Addressing the Major Skeptic Arguments
 
Climate Change Past Present Future
Climate Change Past Present FutureClimate Change Past Present Future
Climate Change Past Present Future
 

Mehr von Wladimir Illescas

Mehr von Wladimir Illescas (8)

Marketing&ventas 02
Marketing&ventas 02Marketing&ventas 02
Marketing&ventas 02
 
FEPA #01
FEPA #01FEPA #01
FEPA #01
 
Economía #00
Economía #00Economía #00
Economía #00
 
Resumen anteproyecto
Resumen anteproyectoResumen anteproyecto
Resumen anteproyecto
 
Marketing&ventas
Marketing&ventasMarketing&ventas
Marketing&ventas
 
Ordenamiento territorial Turrialba Guayabo (borrador)
Ordenamiento territorial Turrialba Guayabo (borrador)Ordenamiento territorial Turrialba Guayabo (borrador)
Ordenamiento territorial Turrialba Guayabo (borrador)
 
El Cambio Global Y Sus Impactos En La Biodiversidad Parte Ii
El Cambio Global Y Sus Impactos En La Biodiversidad Parte IiEl Cambio Global Y Sus Impactos En La Biodiversidad Parte Ii
El Cambio Global Y Sus Impactos En La Biodiversidad Parte Ii
 
Cambio global BB-507
Cambio global BB-507Cambio global BB-507
Cambio global BB-507
 

Kürzlich hochgeladen

Search Engine Optimization SEO PDF for 2024.pdf
Search Engine Optimization SEO PDF for 2024.pdfSearch Engine Optimization SEO PDF for 2024.pdf
Search Engine Optimization SEO PDF for 2024.pdfRankYa
 
Install Stable Diffusion in windows machine
Install Stable Diffusion in windows machineInstall Stable Diffusion in windows machine
Install Stable Diffusion in windows machinePadma Pradeep
 
Artificial intelligence in cctv survelliance.pptx
Artificial intelligence in cctv survelliance.pptxArtificial intelligence in cctv survelliance.pptx
Artificial intelligence in cctv survelliance.pptxhariprasad279825
 
My Hashitalk Indonesia April 2024 Presentation
My Hashitalk Indonesia April 2024 PresentationMy Hashitalk Indonesia April 2024 Presentation
My Hashitalk Indonesia April 2024 PresentationRidwan Fadjar
 
Nell’iperspazio con Rocket: il Framework Web di Rust!
Nell’iperspazio con Rocket: il Framework Web di Rust!Nell’iperspazio con Rocket: il Framework Web di Rust!
Nell’iperspazio con Rocket: il Framework Web di Rust!Commit University
 
Training state-of-the-art general text embedding
Training state-of-the-art general text embeddingTraining state-of-the-art general text embedding
Training state-of-the-art general text embeddingZilliz
 
Beyond Boundaries: Leveraging No-Code Solutions for Industry Innovation
Beyond Boundaries: Leveraging No-Code Solutions for Industry InnovationBeyond Boundaries: Leveraging No-Code Solutions for Industry Innovation
Beyond Boundaries: Leveraging No-Code Solutions for Industry InnovationSafe Software
 
DevEX - reference for building teams, processes, and platforms
DevEX - reference for building teams, processes, and platformsDevEX - reference for building teams, processes, and platforms
DevEX - reference for building teams, processes, and platformsSergiu Bodiu
 
"ML in Production",Oleksandr Bagan
"ML in Production",Oleksandr Bagan"ML in Production",Oleksandr Bagan
"ML in Production",Oleksandr BaganFwdays
 
Unraveling Multimodality with Large Language Models.pdf
Unraveling Multimodality with Large Language Models.pdfUnraveling Multimodality with Large Language Models.pdf
Unraveling Multimodality with Large Language Models.pdfAlex Barbosa Coqueiro
 
Developer Data Modeling Mistakes: From Postgres to NoSQL
Developer Data Modeling Mistakes: From Postgres to NoSQLDeveloper Data Modeling Mistakes: From Postgres to NoSQL
Developer Data Modeling Mistakes: From Postgres to NoSQLScyllaDB
 
SIP trunking in Janus @ Kamailio World 2024
SIP trunking in Janus @ Kamailio World 2024SIP trunking in Janus @ Kamailio World 2024
SIP trunking in Janus @ Kamailio World 2024Lorenzo Miniero
 
Powerpoint exploring the locations used in television show Time Clash
Powerpoint exploring the locations used in television show Time ClashPowerpoint exploring the locations used in television show Time Clash
Powerpoint exploring the locations used in television show Time Clashcharlottematthew16
 
Human Factors of XR: Using Human Factors to Design XR Systems
Human Factors of XR: Using Human Factors to Design XR SystemsHuman Factors of XR: Using Human Factors to Design XR Systems
Human Factors of XR: Using Human Factors to Design XR SystemsMark Billinghurst
 
Integration and Automation in Practice: CI/CD in Mule Integration and Automat...
Integration and Automation in Practice: CI/CD in Mule Integration and Automat...Integration and Automation in Practice: CI/CD in Mule Integration and Automat...
Integration and Automation in Practice: CI/CD in Mule Integration and Automat...Patryk Bandurski
 
Kotlin Multiplatform & Compose Multiplatform - Starter kit for pragmatics
Kotlin Multiplatform & Compose Multiplatform - Starter kit for pragmaticsKotlin Multiplatform & Compose Multiplatform - Starter kit for pragmatics
Kotlin Multiplatform & Compose Multiplatform - Starter kit for pragmaticscarlostorres15106
 
Scanning the Internet for External Cloud Exposures via SSL Certs
Scanning the Internet for External Cloud Exposures via SSL CertsScanning the Internet for External Cloud Exposures via SSL Certs
Scanning the Internet for External Cloud Exposures via SSL CertsRizwan Syed
 
Leverage Zilliz Serverless - Up to 50X Saving for Your Vector Storage Cost
Leverage Zilliz Serverless - Up to 50X Saving for Your Vector Storage CostLeverage Zilliz Serverless - Up to 50X Saving for Your Vector Storage Cost
Leverage Zilliz Serverless - Up to 50X Saving for Your Vector Storage CostZilliz
 
CloudStudio User manual (basic edition):
CloudStudio User manual (basic edition):CloudStudio User manual (basic edition):
CloudStudio User manual (basic edition):comworks
 

Kürzlich hochgeladen (20)

Search Engine Optimization SEO PDF for 2024.pdf
Search Engine Optimization SEO PDF for 2024.pdfSearch Engine Optimization SEO PDF for 2024.pdf
Search Engine Optimization SEO PDF for 2024.pdf
 
Install Stable Diffusion in windows machine
Install Stable Diffusion in windows machineInstall Stable Diffusion in windows machine
Install Stable Diffusion in windows machine
 
Artificial intelligence in cctv survelliance.pptx
Artificial intelligence in cctv survelliance.pptxArtificial intelligence in cctv survelliance.pptx
Artificial intelligence in cctv survelliance.pptx
 
My Hashitalk Indonesia April 2024 Presentation
My Hashitalk Indonesia April 2024 PresentationMy Hashitalk Indonesia April 2024 Presentation
My Hashitalk Indonesia April 2024 Presentation
 
Nell’iperspazio con Rocket: il Framework Web di Rust!
Nell’iperspazio con Rocket: il Framework Web di Rust!Nell’iperspazio con Rocket: il Framework Web di Rust!
Nell’iperspazio con Rocket: il Framework Web di Rust!
 
Training state-of-the-art general text embedding
Training state-of-the-art general text embeddingTraining state-of-the-art general text embedding
Training state-of-the-art general text embedding
 
Beyond Boundaries: Leveraging No-Code Solutions for Industry Innovation
Beyond Boundaries: Leveraging No-Code Solutions for Industry InnovationBeyond Boundaries: Leveraging No-Code Solutions for Industry Innovation
Beyond Boundaries: Leveraging No-Code Solutions for Industry Innovation
 
DevEX - reference for building teams, processes, and platforms
DevEX - reference for building teams, processes, and platformsDevEX - reference for building teams, processes, and platforms
DevEX - reference for building teams, processes, and platforms
 
"ML in Production",Oleksandr Bagan
"ML in Production",Oleksandr Bagan"ML in Production",Oleksandr Bagan
"ML in Production",Oleksandr Bagan
 
DMCC Future of Trade Web3 - Special Edition
DMCC Future of Trade Web3 - Special EditionDMCC Future of Trade Web3 - Special Edition
DMCC Future of Trade Web3 - Special Edition
 
Unraveling Multimodality with Large Language Models.pdf
Unraveling Multimodality with Large Language Models.pdfUnraveling Multimodality with Large Language Models.pdf
Unraveling Multimodality with Large Language Models.pdf
 
Developer Data Modeling Mistakes: From Postgres to NoSQL
Developer Data Modeling Mistakes: From Postgres to NoSQLDeveloper Data Modeling Mistakes: From Postgres to NoSQL
Developer Data Modeling Mistakes: From Postgres to NoSQL
 
SIP trunking in Janus @ Kamailio World 2024
SIP trunking in Janus @ Kamailio World 2024SIP trunking in Janus @ Kamailio World 2024
SIP trunking in Janus @ Kamailio World 2024
 
Powerpoint exploring the locations used in television show Time Clash
Powerpoint exploring the locations used in television show Time ClashPowerpoint exploring the locations used in television show Time Clash
Powerpoint exploring the locations used in television show Time Clash
 
Human Factors of XR: Using Human Factors to Design XR Systems
Human Factors of XR: Using Human Factors to Design XR SystemsHuman Factors of XR: Using Human Factors to Design XR Systems
Human Factors of XR: Using Human Factors to Design XR Systems
 
Integration and Automation in Practice: CI/CD in Mule Integration and Automat...
Integration and Automation in Practice: CI/CD in Mule Integration and Automat...Integration and Automation in Practice: CI/CD in Mule Integration and Automat...
Integration and Automation in Practice: CI/CD in Mule Integration and Automat...
 
Kotlin Multiplatform & Compose Multiplatform - Starter kit for pragmatics
Kotlin Multiplatform & Compose Multiplatform - Starter kit for pragmaticsKotlin Multiplatform & Compose Multiplatform - Starter kit for pragmatics
Kotlin Multiplatform & Compose Multiplatform - Starter kit for pragmatics
 
Scanning the Internet for External Cloud Exposures via SSL Certs
Scanning the Internet for External Cloud Exposures via SSL CertsScanning the Internet for External Cloud Exposures via SSL Certs
Scanning the Internet for External Cloud Exposures via SSL Certs
 
Leverage Zilliz Serverless - Up to 50X Saving for Your Vector Storage Cost
Leverage Zilliz Serverless - Up to 50X Saving for Your Vector Storage CostLeverage Zilliz Serverless - Up to 50X Saving for Your Vector Storage Cost
Leverage Zilliz Serverless - Up to 50X Saving for Your Vector Storage Cost
 
CloudStudio User manual (basic edition):
CloudStudio User manual (basic edition):CloudStudio User manual (basic edition):
CloudStudio User manual (basic edition):
 

Steve's presentation at ICCC 2009(Stephen Mc Intyre)

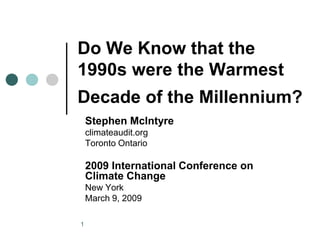
  • 1. Do We Know that the 1990s were the Warmest Decade of the Millennium? Stephen McIntyre climateaudit.org Toronto Ontario 2009 International Conference on Climate Change New York March 9, 2009 1
  • 2. Questions 1. How do they “know” that 1998 was the warmest year of the millennium? They don’t. Minor variations in data versions (e.g. bristlecones) yield opposite results. 2. Does it “matter”? For “big” policy, probably not. But it’s an interesting question and statistics should be done “right”. 2
  • 3. IPCC 2001: The Rise of the Stick The “Hockey Stick” graph, attributed to Mann et al (Nature 1998, GRL 1999 (MBH), occurred six times in IPCC TAR. Inset: John Houghton at IPCC Press Conference, 2001 3
  • 4. The Soundbites: “The Warmest Decade and Year” The 20th century was the warmest in the Northern Hemisphere in the past 1000 years. The 1990s was the warmest decade on record and 1998 was the warmest year - in Canada and internationally. - David Anderson, April 5, 2002 The 20th century was the warmest in the Northern Hemisphere for the past 1000 years and the 1990s the warmest decade on record... The science of climate change has been subjected to international scrutiny, open to all qualified experts, peer review, atmospheric modeling and process studies. – Liberal Party of Canada Caucus, Aug. 22, 2002 4
  • 5. “As Dr Thompson’s Thermometer Shows,…” …the vaunted Medieval Warm Period (the third little red blip from the left below) was tiny in comparison to the enormous increases in temperature in the last half-century - the red peaks at the far right of the graph. These global-warming skeptics - a group diminishing almost as rapidly as the mountain glaciers - launched a fierce attack against another measurement of the 1000 year correlation between CO2 and temperature known as the “hockey stick”, a graphic image representing the research of climate scientist Michael Mann and his colleagues.” Gore actually shows Mann’s reconstruction spliced with the Jones instrumental record. 5
  • 6. IPCC 2007: Spaghetti Graphs It is likely that this 50-year period was the warmest Northern Hemisphere period in the last 1.3 kyr, Excerpt from IPCC 2007 Box 6.4 Figure 1.. 6
  • 7. “Multivariate Calibration” McIntyre and McKitrick, 2009: “Paleoclimate reconstructions are an application of multivariate calibration, which provides a theoretical basis for confidence interval calculation (e.g., Osborne 1991; Brown and Sundberg, 1987). Inconsistency among proxies sharply inflates confidence intervals. Applying the inconsistency test of [Brown and Sundberg] to Mann et al. A.D. 1000 proxy data shows that finite confidence intervals cannot be defined before 1800.” MBH2009: The method of uncertainty estimation (use of calibration/validation residuals) is conventional [Luterbacher et al 2004; Wahl and Ammann 2007] 7
  • 8. “Small and uninteresting perturbations” of data/technique de Leeuw (1988): We usually do not want a small and uninteresting perturbation of our data to have a large effect on the results of our technique. Classical statistics has always studied stability by using standard errors or confidence intervals. Gifi thinks this is much too narrow and other forms of stability are important as well… 8
  • 9. MM2005 on “slight variations of methods and data” Redrawn from MM2005b 9
  • 11. There is no dispute over properly specified calculations Top Left: MBH, 2003; top right; Bürger et al 2006; bottom –drawn from calculations using Wahl and Ammann 2007 algoithm. Middle- varies PC method (their Scenario 5); right - varies bristlecones (Their 11Scenario 6).
  • 12. NAS 2006 For periods prior to the 16th century, the Mann et al. (1999) reconstruction that uses this particular principal component analysis technique is strongly dependent on data from the Great Basin region in the western United States [bristlecones]…. some reconstructions are not robust with respect to the removal of proxy records from individual regions (see, e.g., Wahl and Ammann in press)…. 12
  • 13. IPCC 2007 The McIntyre and McKitrick 2005a,b criticism [relating to the extraction of the dominant modes of variability present in a network of western North American tree ring chrono- logies, using Principal Components Analysis] may have some theoretical foundation, but Wahl and Amman (2006) also show that the impact on the amplitude of the final reconstruction is very small (~0.05°C). 13
  • 14. Wahl and Ammann (“in press 2005”; “in press 2006”; Sep. 2007) “when the full information in the proxy data is represented by the PC series [i.e. enough to get the bristlecones in], the impact of PC calculation methods on climate reconstruction in the MBH method is extremely small… a slight modification to the original Mann et al. reconstruction is justifiable for the first half of the 15th century (∼+0.05–0.10◦), which leaves entirely unaltered the primary conclusion of Mann et al.”… [Bristlecones add] “necessary verification skill” … “indicating that the records carry important climate information at the level of eigenvector patterns in global surface temperatures. These results are valid notwithstanding issues concerning these proxies’ empirical relationship to local/regional surface temperatures after 1850” 14
  • 15. Wegman 2006 Wahl and Ammann [argue] that if one adds enough principal components back into the proxy, one obtains the hockey stick shape again. This is precisely the point of contention… A cardinal rule of statistical inference is that the method of analysis must be decided before looking at the data. The rules and strategy of analysis cannot be changed in order to obtain the desired result. Such a strategy carries no statistical integrity and cannot be used as a basis for drawing sound inferential conclusions. 15
  • 16. A “Dozen Independent Studies” Mann (Senate Testimony, 2003): More than a dozen independent research groups have now reconstructed the average temperature of the northern hemisphere in past centuries.. Wigley (AP Interview, 2003): about a dozen independent studies suggest the 20th century was warmer than normal, Wigley points out. Mann (Letter to House Committe, 2005): Recent work since the TAR has provided further support for this conclusion [ the Stick], which is now common to more than a dozen independent studies published in the peer-reviewed scientific literature. Wikipedia 2009: More than a dozen independent research groups have now reconstructed the average temperature of the northern hemisphere in past centuries. 16
  • 17. “Not Entirely Independent” IPCC 2007: As with the original TAR series, these new records are not entirely independent reconstructions inasmuch as there are some predictors (most often tree ring data and particularly in the early centuries) that are common between them, but in general, they represent some expansion in the length and geographical coverage of the previously available data (Figures 6.10 and 6.11 NAS 2006: Because the data are so limited, different large-scale reconstructions are sometimes based on the same datasets, and thus cannot be considered as completely independent. 17
  • 18. Key proxies are repeated in so-called “independent” spaghetti graph studies Above – Adapted from Wegman 2006 Figure 5.8. Bristlecones/ foxtails are used in all but three spaghetti graph studies. Polar Urals and Tornetrask versions re used in every study. 18
  • 19. Ecologists: warm California MWP Miller et al 2006 (Quat Res): “Using contemporary distributions of the species, we modeled paleoclimate during [the MWP] to be significantly warmer (+3.2 deg C annual minimum temperature) and slightly drier (-24 mm annual precipitation) than present. Left- Bristlecone treeline (Lamarche 1973) declined since MWP; right – Subfossil medieval trees above present treeline at Whitewing Mt, Sierra Nevadas, California. 19
  • 20. “Heavy” Equipment IPCC 2007: the possibility of investigating [these issues] further is restricted by the lack of recent tree ring data at most of the sites from which tree ring data discussed in this chapter were acquired Michael Mann: paleoclimatologists are attempting to update many important proxy records to the present, this is a costly, and labor-intensive activity, often requiring expensive field campaigns that involve traveling with heavy equipment to difficult- to-reach locations (such as high-elevation or remote polar sites). For historical reasons, many of the important records were obtained in the 1970s and 1980s and have yet to be updated. 20
  • 21. Ababneh 2006 did not replicate Graybill’s bristlecone chronology Left – red – MBH PC1 (used in IPCC 2007 Box 6.4) ; green – Graybill Sheep Mt chronology. Right - Ababneh (2006, 2007) chronology.. All series scaled to 1400-1980. 950-1100 and 1856-1980 highlighted. 21
  • 22. Almagre CO Bristlecones are not setting records Decline in recent portion of the chronology. The most noticeable feature is the low growth in the1840-50s – associated with drought in other Colorado tree ring chronologies. Left- MBH PC1 (bristleocnes); right – updated Almagere chronology. In dimensionless chronology units, basis 1. 22
  • 23. Controversial “Starbucks Hypothesis” Proven! Left – 7 am at Starbucks, Colorado Springs; right – bristlecones at 3600 m; 23
  • 24. Almagre program identified exact trees during update and measurements online within 3 months Left – Pete Holzmann sampling Tree 31 in 2007; right- Donald Graybill sampling same tree in 1987. 24
  • 25. Strip Bark: simple statistical models don’t apply Graybill and Idso 1993: Another tree selection factor that is crucial to our findings involves tree form... [Strip bark trees] were the primary focus of investigation wherever possible, (Brunstein USGS 2006http://www.climateaudit.org/?p=2239 25
  • 26. Key proxies are used over and over. Above – From Wegman 2006 Figure 5.8 showing proxy overlap; IPCC 2007 Box 6.4 Fig 1. 26
  • 27. Polar Urals: Briffa (Jones) 1995 Above – Polar Urals version of Briffa et al 1995, used in Jones et al 1998 reconstruction. All series scaled to scale of Briffa et al 1995. 950-1100 and 1856-1980 highlighted. 27
  • 28. Evidence for warm MWP in Siberia Left - Polar Urals treeline declined since Medieval Warm Period (from Shiyatov 1995); right – subfossil medieval trees in foreground above modern treeline in background (Esper); 28
  • 29. Polar Urals Update Above – Polar Urals version incorporated into Esper et al 2002. All series scaled to scale of Briffa et al 1995. 950-1100 and 1856-1980 highlighted. 29
  • 30. Yamal Substitution (Briffa 2000) Above - Yamal chronology from Briffa 2000, used in all but one subsequent study. All series scaled to scale of Briffa et al 1995. 950- 1100 and 1856-1980 highlighted. 30
  • 31. Tornetrask: Briffa 2000 vs Grudd 2006 Left – Version used in IPCC 2007. Right - Grudd 2006. All series scaled to scale of Briffa et al 1995. 950-1100 and 1856-1980 highlighted. 31
  • 32. Are ice cores any help? wide variety of ice core  patterns since MWP. δO18 at Mt Logan,  Yukon went down in 20th (attributed to regional change); Elevated δO18 at Law  Dome, Antarctica ignored by NAS panel Ice core δO18 from N to S. 32
  • 33. Different Spaghetti Recipes NRC panel used 4 reconstructions as comfort for comparing modern-medieval levels, but did not verify that cited reconstructions met proxy quality standards. Medieval-modern relationship reverses with trivial and justifiable variations in proxy selection. 33
  • 34. Glacier Retreat: Alberta Retreat of Saskatchewan Glacier (in Alberta) in 1999 exposed in situ stumps dated ~2800-2900 BP (14C) presumably not exposed in MWP In… August 1999, a severe rainstorm resulted in stream avulsion along the NE flank of the Saskatchewan Glacier snout … When first examined in early September, erosion through a 3- to 5- m sequence of glacial outwash and overlying till had exposed 17 sheared stumps rooted within a well-preserved paleosol …. By September 2000, the meltwater channel had shifter southward and had eroded through 5 m of fluted moraine deposits exposing 2 additional rooted stumps and flushing an additional 40 detrital boles onto the outwash surface. The stumps were rooted in a deeply weathered pedogenic surface and prior to their exposure were buried by 3-5 m of sediment. … With one exception, these dates collectively reflect the consequences of a single Neoglacial advance of the Saskatchewan Glacier into an established valley bottom forest. 34
  • 35. Quelccaya Glacier, Peru Distichia muscoides, a component of Andean peat deposits, exposed in recent Quelccaya glacier retreat. Present limit is 400-500 m lower than the discovery. Peat samples have a wide variety of 14C dates - many about 4500 BP. 35
  • 36. Green Alps Left- modern view of a pass in the Alps (with glacier lines of 1922 and 1856); right - Schlüchter and Jörin 2004 reconstruction of view Roman times of 2000 years ago 36
  • 38. Why did IPCC feature the “least important” figure? It is one of those odd ironies that the figure that everyone keeps talking about is actually the least important from the point of view of understanding climate responses to forcing. Gavin Schmidt, 2005 38
  • 39. Is it the “Least Important” Figure? Left: IPCC 2001 Synthesis for Policy makers Figure SPM-10b with MBH reconstruction; Right: IPCC 1990 version of Lamb (about 1 deg range) together with IPCC 2007 SPM range of scenarios: yellow shows “constant 2000 GHG”. 39
  • 40. “Worse than We Thought” There is (yet another) odd inversion about: the idea that if we were to switch from, say, MBH (less variance) to Moberg (more) that would somehow imply a reduction in expected future warming. That is completely wrong. If the past temperatures varied more, it implies a *higher* sensitivity to forcing, and therefore a *higher* future William Connolley, 2005 40
  • 41. Visit www.climateaudit.org for ongoing discussion. Presentation will be posted at www.climateaudit.org/pdf/newyork09 with bibliography 41