
Empfohlen
Empfohlen
Weitere ähnliche Inhalte
Was ist angesagt?
Was ist angesagt? (17)
Ähnlich wie Alembic pharma multibagger-jan-2016
Ähnlich wie Alembic pharma multibagger-jan-2016 (20)
Kürzlich hochgeladen
Kürzlich hochgeladen (20)
Alembic pharma multibagger-jan-2016
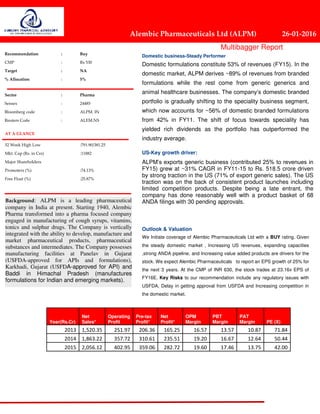
- 1. Recommendation : Buy CMP : Rs 530 Target : NA % Allocation : 5% Sector : Pharma Sensex : 24485 Bloomberg code : ALPM. IN Reuters Code : ALEM.NS AT A GLANCE 52 Week High Low :791.90/381.25 Mkt. Cap (Rs. in Crs) :11882 Major Shareholders Promoters (%) :74.13% Free Float (%) :25.87% Domestic business-Steady Performer Domestic formulations constitute 53% of revenues (FY15). In the domestic market, ALPM derives ~89% of revenues from branded formulations while the rest come from generic generics and animal healthcare businesses. The company’s domestic branded portfolio is gradually shifting to the speciality business segment, which now accounts for ~56% of domestic branded formulations from 42% in FY11. The shift of focus towards speciality has yielded rich dividends as the portfolio has outperformed the industry average. US-Key growth driver: ALPM’s exports generic business (contributed 25% to revenues in FY15) grew at ~31% CAGR in FY11-15 to Rs. 518.5 crore driven by strong traction in the US (71% of export generic sales). The US traction was on the back of consistent product launches including limited competition products. Despite being a late entrant, the company has done reasonably well with a product basket of 68 ANDA filings with 30 pending approvals. Outlook & Valuation We Initiate coverage of Alembic Pharmaceuticals Ltd with a BUY rating. Given the steady domestic market , Increasing US revenues, expanding capacities ,strong ANDA pipeline, and Increasing value added products are drivers for the stock. We expect Alembic Pharmaceuticals to report an EPS growth of 25% for the next 3 years. At the CMP of INR 630, the stock trades at 23.16x EPS of FY16E. Key Risks to our recommendation include any regulatory issues with USFDA, Delay in getting approval from USFDA and Increasing competition in the domestic market. Year(Rs.Cr) Net Sales* Operating Profit Pre-tax Profit* Net Profit* OPM Margin PBT Margin PAT Margin PE (X) 2013 1,520.35 251.97 206.36 165.25 16.57 13.57 10.87 71.84 2014 1,863.22 357.72 310.61 235.51 19.20 16.67 12.64 50.44 2015 2,056.12 402.95 359.06 282.72 19.60 17.46 13.75 42.00 26 January 2016 Alembic Pharmaceuticals Ltd (ALPM) 26-01-2016 Multibagger Report Background: ALPM is a leading pharmaceutical company in India at present. Starting 1940, Alembic Pharma transformed into a pharma focused company engaged in manufacturing of cough syrups, vitamins, tonics and sulphur drugs. The Company is vertically integrated with the ability to develop, manufacture and market pharmaceutical products, pharmaceutical substances and intermediates. The Company possesses manufacturing facilities at Panelav in Gujarat (USFDA-approved for APIs and formulations), Karkhadi, Gujarat (USFDA-approved for API) and Baddi in Himachal Pradesh (manufactures formulations for Indian and emerging markets).
- 2. Investment Arguments Company Profile: ALPM is a leading pharmaceutical company in India at present. Starting 1940, Alembic Pharma transformed into a pharma focused company engaged in manufacturing of cough syrups, vitamins, tonics and sulphur drugs. The Company is vertically integrated with the ability to develop, manufacture and market pharmaceutical products, pharmaceutical ubstances and intermediates. The Company possesses manufacturing facilities at Panelav in Gujarat (USFDA-approved for APIs and formulations), Karkhadi, Gujarat (USFDA-approved for API) and Baddi in Himachal Pradesh (manufactures formulations for Indian and emerging markets). Until 2010 ALPM was a pure domestic focused company along with presence in API segments. The Company’s five brands ( Azithral, Roxid, Althrocin, Wikoryl and Gestofit ) feature among top-300 pharmaceutical brands. Post demerger of company’s core pharma business (now Alembic Pharmaceuticals Ltd) from Alembic Ltd, ALPM transformed into an aggressive and focused company. Management started focusing aggressively on export to regulated markets (US and Europe) and chronic therapies in the domestic market.
- 3. Domestic Market & Exports – Key Growth Driver: Domestic formulations constitute 53% of revenues (FY15). In the domestic market, APL derives ~89% of revenues from branded formulations while the rest come from generic generics and animal healthcare businesses. The domestic branded formulation segment has been further segregated into two sub-segments - 1) acute and 2) speciality (cardiology, diabetology, gynaecology, GI, orthopaedic and dermatology). While the acute portfolio includes some of the legacy brands developed and owned by the company, the specialty portfolio was acquired from Dabur Pharma in 2007. The company’s domestic branded portfolio is gradually shifting to the speciality business segment, which now accounts for ~56% of domestic branded formulations from 42% in FY11. The shift of focus towards speciality has yielded rich dividends as the portfolio has outperformed the industry average. From Rs. 251 crore in FY11, the speciality segment has grown at a CAGR of 21.6% to Rs. 549 crore by FY15. Till date, the company has launched 170 products. The current MR strength is ~5000. Overall, domestic formulations have grown at 12.3% CAGR in FY11-15 to Rs.1103/- crore. Currently, 25-30% of the domestic portfolio is under the National List of Essential Medicines (NLEM) list. Export formulations constitute 28% of revenues (FY15). Of this, ~90% of export formulations are generics catering to the regulated markets of the US, Canada and Europe. In these markets, the company has adopted a partnership approach to push sales. APL owns 67 approved products across developed markets. The company’s generic exports grew at a CAGR of 31% to Rs. 1536 crore during FY11-15 mainly due to strong growth in the US (71% of export generic sales) on the back of consistent product launches including limited competition products. The current ANDA filings stand at 68 including 30 pending approvals of which 50% are Para IV and shared exclusivity filings. APL currently markets 26 products in the US through partners. The branded exports business caters to key emerging markets in South East Asia, CIS and East Africa. The API business accounts for 18% of revenues. Total 70% of APIs have been used for captive consumption. Till date, the company has filed 72 DMFs. US - Key Growth Driver: ALPM’s exports generic business (contributed 25% to revenues in FY15) grew at ~31% CAGR in FY11-15 to Rs. 518.5 crore driven by strong traction in the US (71% of export
- 4. generic sales). The US traction was on the back of consistent product launches including limited competition products. Despite being a late entrant, the company has done reasonably well with a product basket of 68 ANDA filings with 30 pending approvals. Analysing the quality of filings, the company has stepped further from typical Para III filings to more remunerative Para IV and FTFs (as on FY15, the company owned ~34 Para IV filings compared to nil in FY09). The company has already demonstrated the required capabilities by securing approvals of limited completion products such as gAbilify (aripiprazole; CNS), gExforge (Amlodipine and Valsartan; CVS), gCelebrex (Celecoxib; Pain) and gMicardis (Telmisartan; CVS). ALPM’s FY15 growth in the US was just 11% YoY due to high base, price erosion in some products and lack of new product approvals. However, the company has started FY16 on a strong footing with approved products such as gAbilify (~US$5 billion annual sales; ~10% market share), gExforge (~US$ 400 million) and gCelebrex (~US$ 2.4 billion). The company has launched gAbilify under shared exclusivity. Due to limited competition and with the assumption of ~10% market share during the exclusivity period, we expect gAbilify to contribute ~US$80 million to its revenues for FY16. Even on a normalised basis (ex-gAbilify), with the assumption of eight to ten annual product launches, we expect the company to generate US$ 35-45 million incremental annual sales from the US, which will translate into a CAGR of 46% over FY15-18E in the US. Domestic Formulations - Steady Performer: Domestic formulation business has shown 12.3% CAGR over FY11-15 on account of increasing its focus on chronic segment, volume growth, new product launches & price hikes. Company expects to launch 20 products annually, strengthening the market coverage on progressive molecules and also intend to widen its therapeutic presence through new divisions. Company has identified new therapy-Respiratory to further expand company’s spread. The field force attrition rate has also come down sharply to 15-20% from 35. Lower API Contribution: Alembic’s API business represents critical backward integration and it contributes around 18% of sales. It supplies APIs to both domestic and international markets; nearly 90% was derived from the regulated markets. Company invested large amount in building state-of-the-art API blocks in the last few years. These capacities will help address the augmented requirement of
- 5. APIs over the next couple of years. Company is increasingly using the capacities to supply internally targeting 35% of captive usage & only undertaking high margin orders from regulated markets and reduced supplies to non regulated markets. We expect contribution from API segment to overall revenues likely to come down which would help company to expand its margins. Increasing R&D Expenditure: The Company identifies and develops genericisation opportunities, novel drug delivery systems (NDDS), new technology platforms and alternate therapies with speed. These are difficult to develop, marginalizing competition clutter. Going forward, the company’s efforts are directed towards undertaking complex regulatory filings & plans to launch 1-2 limited competition products every year. It is working on 50 R&D projects & evaluating and focusing on development of derma & injectable space to drive next phase of growth. Therefore we believe R&D expenses to increase from current 5.9% in FY15 to 7-8% by FY17. Way ahead of peers in complex pipeline: On the competitive landscape, ALPM's US revenues can be closely compared to IPCA or Torrent Pharma (US revenues of less than US$150mn). The US growth for all the three players, including Alembic, was largely driven by highly competitive products, so far. However, a closer look at the US pipeline (post screening the DMF filings for all peers), for future launches, highlights that Alembic has been filing for far more complex and niche products compared to its peers. Going ahead we foresee Alembic closely competing with large peers like Lupin and Cadila in few interesting opportunities. Interestingly, Alembic has also filed for complex generics
- 6. like Elmiron and Toprol XL wherein patents have expired but due to complexity of the drug there have been no or less generic competition. Global Pharma Market Pharmaceuticals market plays a vital role in an economy as well as ensuring welfare of the citizens. The global pharma market stood at US$ 980 bn in 2013 (as per Statista 2014) and has grown at ~8% CAGR over 2001-13. US is the largest pharma market at ~US$392 bn or ~40% contribution followed by Europe (EU countries) at ~US$ 265 bn or ~27% contribution and Japan at ~US$115 or 11.7% contribution. The Indian Pharma Market (IPM) stood at US$ 13.0 bn or at a mere 1.3% contribution to the global pharma market. Though the IPM is ranked 12th globally in value terms, it is the third largest in volume terms (due to lower pricing of drugs). Indian pharmaceuticals Overview The pharmaceutical market for India constitutes domestic (IPM - Indian Pharma Market) and exports markets. The IPM which stood at US$13.0bn in 2013, has witnessed a steady CAGR ~11% over 2000-2013 driven by improving affordability, better health awareness, higher penetration of healthcare facilities and worsening lifestyles. The Indian pharma exports kick started when companies entered the global markets way back in 1990's (post India's adoption of liberal economic policies). Pharma exports from India posted a CAGR of 25% over 1990-2013 and stood at ~Rs 900 bn or US$ 14.7bn in 2013. Today every 3rd pill in the world is manufactured in India. As per Pharmexcil (Pharmaceuticals Export Promotion Council of India), both the domestic as well exports are expected to grow at >16% CAGR from US$ 14.7/13.0bn to US$41/45bn over 2013-2020.
- 7. The IPM is largely a branded generic market wherein drugs are sold by brand names, unlike in US and other developed markets, where drugs are sold by generic (chemical) name. The Indian market comprises of over 5000 pharma companies, 22,000 stockist/distributors and over 600,000 retailers (chemist shops). IPM has witnessed a steady CAGR 11% over 2000-2013 driven by improving affordability, better health awareness, higher penetration of healthcare facilities. IPM – Skewed towards Acute Therapies The Indian market is largely an acute therapy market with ~70% contribution from that segment. Acute drugs are those medications which are prescribed by doctors for only 3-6 weeks. Large global markets comparatively are more chornic in nature with ~60% contribution. Chronic drugs are medications which are taken for a longer period, for e.g. medication for diabetes, blood pressure, oncology and cholesterol. From the company's perspective, better share in chronic therapies lead to higher growth.
- 8. IPM - Competitive Dynamics The Indian pharma market is very fragmented with top 10 players contributing ~40% the market and top 25 companies accounting for ~70% of the market. The largest player as of 2014 is Abbott with 6.03% market share. The IPM in 1970's was dominated by MNC's with hardly few Indian companies in top 25. However, when the Indian Patent Act changed from product patent to process patent, Indian companies emerged by manufacturing copycat drugs. By early 2000, there were about 20 Indian companies in top 25. In 2005, the Patent Act re-established product patent, a patent law that was in line with the WTO mandate. Post the product patent implementation no Indian companies could launch new (patented) products and MNC's entered the Indian markets once again with their patented molecules/ drugs. Moreover, after Abbott- Piramal and Ranbaxy-Daiichi takeover, top 3 out of top 5 companies in IPM were MNC's. By 2015 (assuming Sun-Ranbaxy merger is completed) Sun will become the largest player in the market with ~8.5% market share and top 4 out of top 5 companies will be of Indian origin. IPM-Growth Drivers Improving per capita spend India's spend on drugs is amongst the lowest compared to top 15 pharma markets. The per capita spend has been around US$60-64 pa (between 2010 and 2014) as per World Bank. As the per capita income continues to grow (10.4% in FY13-14) led by good economic growth, disposable incomes are likely to go up and the per capita spend on drugs is set to increase.
- 9. Changing Disease Profile Though the IPM is currently an acute market, the shift towards chronic has been swift. With changing lifestyles the occurrence of chronic ailments has increased over the years. The chronic segment contributed ~23% in 2005 at ~US$ 1.15bn. Whereas as of 2013 the chronic market stood at US$ 3.9bn contributing ~30% to the IPM, a CAGR of 16.5%. The chronic segment is expected to register 16-18% growth compared to single digit growth in the acute segment over the coming years. The core focus of companies over the years has been to enhance the chronic product basket as well increase penetration through recruiting field force. The most chronic focused companies in the IPM include, Torrent Pharma, Sun, Lupin and Unichem all of whom have more than 60% contribution from chronic.
- 10. Increasing Insurance Coverage In India, unlike US/EU, the spending of drugs is largely out of pocket, which form around 90% of payments. In the planning commission's draft twelve five-year plan, the vision laid out for India's healthcare sector is to establish a system of universal health coverage. This would be achieved primarily through more extensive insurance coverage, which would move up from 10% currently to 90%, partly through government hospitals or government payments. Higher penetration to drive growth: Around 2/3rd of India's population lives in rural areas, but rural markets contribute < 20% of the overall IPM sales. Moreover the split of hospitals and doctors between rural and urban also remained highly skewed towards urban areas. With government's intention of universal health coverage, there is an immense opportunity for expansion of the IPM.
- 11. Profit & Loss (Consolidated)