1. Back to the Basics
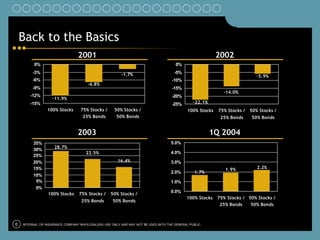
2001 2002
0% 0%
-3% -1.7% -5%
-5.9%
-6% -10%
-6.8%
-9% -15%
-14.0%
-12% -20%
-11.9%
-15% -25% -22.1%
100% Stocks 75% Stocks / 50% Stocks / 100% Stocks 75% Stocks / 50% Stocks /
25% Bonds 50% Bonds 25% Bonds 50% Bonds
2003 1Q 2004
35% 5.0%
28.7%
30%
22.5% 4.0%
25%
20% 16.4% 3.0%
15% 1.9% 2.2%
2.0% 1.7%
10%
5% 1.0%
0%
0.0%
100% Stocks 75% Stocks / 50% Stocks /
100% Stocks 75% Stocks / 50% Stocks /
25% Bonds 50% Bonds
25% Bonds 50% Bonds
0 INTERNAL OR INSURANCE COMPANY WHOLESALERS USE ONLY AND MAY NOT BE USED WITH THE GENERAL PUBLIC.
2. Who Cares?
Asset Allocation Matters Most
Stock Selection
l According to a key study of 4.6%
Other
pension fund performance*, Market Timing 2.2%
the overwhelming determinant 1.7%
of the success or failure of an
investment strategy is how the
assets were divided among the
various asset classes (stocks,
bonds, cash equivalents), and not
what securities were owned or
when they were bought or sold.
Asset Allocation Decision
91.5%
1 INTERNAL OR INSURANCE COMPANY WHOLESALERS USE ONLY AND MAY NOT BE USED WITH THE GENERAL PUBLIC.
3. StorySelling
Imagine a baseball soaring towards a
pane glass window. The risk that the
baseball would ruin the entire window is
pretty high.
If a baseball hits a traditional divided
window, the damage could be limited to
a single pane. The same concept applies
to investing.
A portfolio with just a single type of
investment can leave you at greater risk.
Diversification can help limit that risk.
2 INTERNAL OR INSURANCE COMPANY WHOLESALERS USE ONLY AND MAY NOT BE USED WITH THE GENERAL PUBLIC.
4. Diversify—Winners Rotate
Best Performing Asset Class from 1990-2003
Value Blend Growth
1990 Large-Cap
1998 >$7.75 Bn
1995 Mid-Cap
1993
1999 $1.3 Bn to $7.75 Bn
1992 1996 1991
1997 2000 1994 Small-Cap
<$1.3 Bn
2001 2002 2003
3 INTERNAL OR INSURANCE COMPANY WHOLESALERS USE ONLY AND MAY NOT BE USED WITH THE GENERAL PUBLIC.
5. Don’t be a “Johnny Come Lately”
Percentage Performance One-Year Later
250
216.42
200
150 124.99
97.98 87.84
100
56.16 58.09
50 38.64 37.24
22.06
3.82
0
-7.10 -9.44
-31.26 -21.77
-50
1996 1997 1997 1998 1998 1999 1999 2000 2000 2001 2001 2002 2002 2003
Year’s Top 25 Funds Same Funds One Year Later
4 INTERNAL OR INSURANCE COMPANY WHOLESALERS USE ONLY AND MAY NOT BE USED WITH THE GENERAL PUBLIC.
6. Case Study: Chasing Returns
Can Lead to Disappointment
History has shown that generally buy-and-hold investors who maintained a
well-allocated portfolio tended to fare better than those who
chased market trends.
Chasing highest returns:
$100,000 invested in previous $107,006
year’s high performer
Chasing lowest returns:
$100,000 invested in previous $116,345
year’s low performer
Buy and Hold:
A one-time $100,000
investment distributed evenly $127,002
over six market indices
1993 – 2002
5 INTERNAL OR INSURANCE COMPANY WHOLESALERS USE ONLY AND MAY NOT BE USED WITH THE GENERAL PUBLIC.
7. Value and Growth: Own Them Both
Style Rotation—Beyond Our Control
50%
40%
30%
20%
10%
0%
-10%
-20%
-30%
90
91
92
93
94
95
96
97
84
85
86
87
88
89
02
03
98
99
00
01
19
19
19
19
19
19
19
19
19
19
19
19
19
19
20
20
19
19
20
20
Russell 1000® Value Russell 1000® Growth
6 INTERNAL OR INSURANCE COMPANY WHOLESALERS USE ONLY AND MAY NOT BE USED WITH THE GENERAL PUBLIC.
8. The Van Kampen 50/50 Solution
A Balanced Solution—Within Our Control
50% VK Emerging Growth LIT
50% VK Growth and Income LIT
7 INTERNAL OR INSURANCE COMPANY WHOLESALERS USE ONLY AND MAY NOT BE USED WITH THE GENERAL PUBLIC.
9. A Van Kampen Solution vs. S&P500®
A Core Holding With Impressive Relative Performance
100% S&P 500® Van Kampen 50/50
5 year average annual return 5 year average annual return
through 12/31/03: through 12/31/03:
4.16% 11.45%
8 INTERNAL OR INSURANCE COMPANY WHOLESALERS USE ONLY AND MAY NOT BE USED WITH THE GENERAL PUBLIC.
10. VK 50/50 * vs. S&P 500®
$250,000
$200,000
$156,650
$150,000
$100,000
$124,944
$50,000
$0
1997 1998 1999 2000 2001 2002 2003
VK 50/50 S&P 500
A $31,706 Advantage
9 INTERNAL OR INSURANCE COMPANY WHOLESALERS USE ONLY AND MAY NOT BE USED WITH THE GENERAL PUBLIC.
11. Performance Review
Average Annual Total Return Percentages (Periods Ending June 30, 2004)
Year-To- Since
Date 1 Year 3 Year 5 year Inception
LIT Emerging Growth Portfolio 2.39 14.97 -8.37 -1.91 10.75
(Inception: 7/03/1995)
LIT Growth and Income Portfolio 3.48 20.02 3.09 5.48 10.55
(Inception: 12/23/1996)
10 INTERNAL OR INSURANCE COMPANY WHOLESALERS USE ONLY AND MAY NOT BE USED WITH THE GENERAL PUBLIC.
12. The Solution—
Experience on your Team
The Growth and Income Team
l 5 team members with a combined 45 years of experience
l The management team looks for undervalued companies
that are experiencing positive change that they believe
may provide superior returns relative to the market.
l The team seeks positive returns through growth and
income.
The Emerging Growth Team*
l 6 team members with a combined 90 years of experience
l The fund’s style of investing has been around for over
three decades and many market cycles.
l The team has consistently stuck to this style of looking for
stocks with growing earnings.
Team members will change without notice.
11 INTERNAL OR INSURANCE COMPANY WHOLESALERS USE ONLY AND MAY NOT BE USED WITH THE GENERAL PUBLIC.
13. Experience Matters
Experience is More than Just An Asset in Down Markets
Growth of $10,000: March 1994 – March 2004
Over the past 10 years, which $30,000 $28,394
encompassed both the bull
$27,500
markets, funds with experienced
managers have returned an $25,000
$23,673
average of 10.96% annually.
$22,500
Managers with less experience
delivered 9.36% over the same $20,000
period. Avg. return of funds Avg. return of funds
run by manager w/ run by manager w/
10 years or less 10 years or more
experience experience
12 INTERNAL OR INSURANCE COMPANY WHOLESALERS USE ONLY AND MAY NOT BE USED WITH THE GENERAL PUBLIC.