Micro economics - Summary for CPT
•
75 gefällt mir•43,633 views

Summary of Micro Economics for CA CPT

Empfohlen
Weitere ähnliche Inhalte
Was ist angesagt?
Was ist angesagt? (19)
Ähnlich wie Micro economics - Summary for CPT
Ähnlich wie Micro economics - Summary for CPT (20)
Mehr von pace2race
Mehr von pace2race (17)
Kürzlich hochgeladen
Kürzlich hochgeladen (20)
Micro economics - Summary for CPT
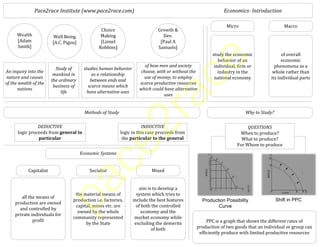
- 1. Pace2race Institute (www.pace2race.com) Economics- Introduction An inquiry into the nature and causes of the wealth of the nations Study of mankind in the ordinary business of life studies human behavior as a relationship between ends and scarce means which have alternative uses of how men and society choose, with or without the use of money, to employ scarce productive resources which could have alternative uses Methods of Study DEDUCTIVE general to particular INDUCTIVE particular to the general Why to Study? QUESTIONS Production Possibility Curve Shift in PPC Economic Systems pace2race
- 2. Pace2race Institute (www.pace2race.com) Demand demand’ refers to the quantity of a good or service that consumers are willing and able to purchase at various prices during a period of time What is Demand? Determinants of Demand Price of the commodity Level of income of the household Tastes and preferences of consumers Price of related commodities (i) Complementary (ii) Competing Law of Demand an inverse relationship between price and quantity demanded Rationale of Demand Diminishing Marginal utility Substitution effect Income effect Different uses Exceptions Conspicuous Goods Giffen goods Future expectations Speculative goods Demand Schedule is a series of quantities which consumer would like to buy at different prices at a given point of time When we plot the prices and quantities demand on a graph it is termed as a demand curve When we add up the various quantities demanded by the number of consumers in the market we can obtain the market demand schedule If we plot market demand schedule on a graph we get market demand curve Price elasticity of demand expresses the response of quantity demanded of a good to a change in its price Determinants Availability of substitutes Position of a commodity in consumer’s budget Nature of need that commodity satisfies Number of uses to which a commodity can be put Period Consumer Habits In point elasticity, we measure elasticity at a given point on a demand curve. In arc elasticity, we measure elasticity between 2 points on a demand curve. Income elasticity of demand is the degree of responsiveness of quantity demanded of goods to a small change in the income of consumers. Cross demand refers to the quantities of a commodity or service which will be purchased with reference to changes, not of that particular commodity, but of other inter-related commodities, other things remaining the same. pace2race
- 3. Pace2race Institute (www.pace2race.com) Consumer Behavior Marginal Utility It is the additional utility derived from additional unit of a commodity Assumptions of Marginal Utility Cardinal measurability of utility Constancy of marginal utility of money Hypothesis of independent utility Diminishing Marginal Utility The additional benefit which a person derives from a given increase in stock of a thing diminishes with every increase in the stock that he already has Limitation of Dim. Marg. Utility Homogeneous units Standard units of consumption Element Concept Law fails for prestigious goods Case of related goods Consumer Surplus - Marshall consumer’s surplus = What a consumer is ready to pay - What he actually pays. Limitations of Consumer Surplus Can not be measured precisely Affected by availability of substitutes Can not be measured in terms of money as marginal utility of money changes In case of necessaries, marginal utilities of earlier units are infinitely large Indifference Curve Analysis Indifference curve gives same satisfaction to the consumer at every point. It is a ordinal concept Assumptions of Indiff. Curve Analysis Consumer is rational Capable of ranking all combinations of goods If combination A has more commodities then B, then A should be preferred If consumer prefers combination A to B, B to C then he must prefer combination A to C Indifference Shedule Set of Indifference Curves Indifference Map Properties of Indifference curves Slope downward to right Always convex to origin Can never intersect each other Higher indifference curve represent higher satisfaction Indifference curve will never touch the axis a budget line shows all those combinations of two goods which the consumer can buy spending his given money income on the two goods at their given prices. All those combinations which are within the reach of the consumer (assuming that he spends all his money income) will lie on the budget line. Budget Line Consumer Equilibrium pace2race
- 4. Pace2race Institute (www.pace2race.com) Production Production is the organized activity of transforming resources into finished products in the form of goods and services; and the objective of production is to satisfy the demand of such transformed resources James Bates and J.R. Parkinson Production Factors of Production Land Labour Capital Enterprenuer Nature Gift Fixed Supply Indestructible Passive Different uses Human Effort Perishable Mobile Inseparable from laborer All laborer not productive Stages of formation Savings Mobilization Investments Functions Initiating a business Risk bearing Innovations Production Function The term production function is applied to the physical relationship between a firm’s input of resources and its output of goods or services per unit of time leaving prices aside Richard H. Leftwich Equation Assumptions q = f (a, b, c, d …….n) where ‘q’ stands for the rate of output of given commodity a,b,c,d…….n, are different factors (inputs) and services used per unit of time. Related to particular unit of time Technical knowledge is constant Factors of production are divisible Best available technique is used Cobb-Douglas Production Function where ‘Q’ is output, ‘L’ the quantity of labour and ‘C’ the quantity of capital. ‘K’ and ‘a’ are positive constants Law of Variable Proportions Stages Law of increasing returns Law of diminishing returns Law of negative returns A rational producer will always produce in stage 2 where both the marginal product and average product of the variable factors are diminishing. The law of diminishing return is the marginal product of each unit of input will decline as the amount of that output increases, holding all other inputs constant Samuelson Economies & Diseconomies ExternalInternal Technical Managerial Commercial Financial Risk Bearing Cheaper raw material Technological Development of skilled labour Growth of ancillary industries Better transportation and marketing Returns to Scale with the increase in the scale in some proportion, output increases in the same proportion increasing returns to scale means that output increases in a greater proportion than the increase in inputs. When output increases in a smaller proportion with an increase in all inputs, decreasing returns to scale are said to prevail. Constant DecreasingIncreasing pace2race
- 5. Pace2race Institute (www.pace2race.com) Cost Economic Costs economic costs include : (1) the normal return on money capital invested by the entrepreneur himself in his own business; (2) the wages or salary not paid to the entrepreneur but could have been earned Outlay & Opp. Costs Outlay costs involve actual expenditure of funds on, say, wages, material, rent, interest, etc. Opportunity cost, on the other hand, is concerned with the cost of foregone opportunity Direct or Traceable Costs Indirect or non-traceable costs Direct costs are costs that are readily identified and are traceable to a particular product, operation or plant. Indirect costs are not readily identified nor visibly traceable to specific goods, services, operations, etc. The cost function refers to the mathematical relation between cost of a product and the various determinants of costs. Cost Function Completely Fixed Cost Completely Variable Cost Semi – Variable Cost Short Run Total Cost Curves Total cost of a business is the sum of total variable cost and total fixed cost or symbolically TC = TFC + TVC Short Run Marginal and Average Cost Curves AFC is the total fixed cost divided by the number of units of output produced. Average Fixed Cost Average Variable Cost Average variable cost is the total variable cost divided by the number of units of output produced Average total cost is a sum of average variable cost and average fixed cost. i.e., ATC = AFC + AVC. Average Total Cost Constant Technology Long Run Average cost Curve Changing Technology Relationship bet. AC & MC MC < AC ---- Average Cost Falls MC > AC ---- Average Cost Rises MC = AC ---- Average Cost is Min. pace2race
- 6. Pace2race Institute (www.pace2race.com) Price Determination Where demand meets supply Equilibrium Price Shifts in Demand & Supply Demand Curve under Perfect Compt. Equilibrium MC Curve = Supply Curve Demand curve Long run equilibrium Monopoly Monopolistic Long Run Equilibrium Kinked Demand Curve Oligopoly pace2race