Value Stream Improvement Project Template
•
42 likes•13,056 views

Value stream mapping is a practical and highly effective way to learn to see and resolve disconnects, redundancies, and gaps in how work gets done. This VSM project template helps you and your project team to put together a "storyboard" for effective presentation to your key stakeholders. It includes four key phases: 1) Define and pick product/service family 2) Create a current state map 3) Develop a future state map 4) Develop an implementation plan This document consists of a VSM project template in Powerpoint format and a set of Excel templates comprising VSM charter, Results table, Implementation Plan and common VSM icons.

Recommended
More Related Content
What's hot
What's hot (20)
Similar to Value Stream Improvement Project Template
Similar to Value Stream Improvement Project Template (20)
More from Operational Excellence Consulting
More from Operational Excellence Consulting (20)
Recently uploaded
Recently uploaded (20)
Value Stream Improvement Project Template
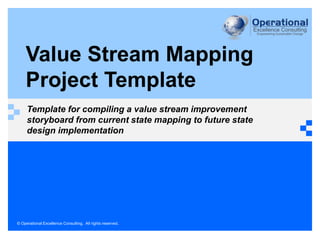
- 1. © Operational Excellence Consulting. All rights reserved. Value Stream Mapping Project Template Template for compiling a value stream improvement storyboard from current state mapping to future state design implementation
- 2. 2 Contents 1. Team organization 2. Value stream mapping roadmap 3. Phase 1: Define & Pick Product/Service Family 4. Phase 2: Current State Mapping 5. Phase 3: Future State Mapping 6. Phase 4: Implementation Plan Appendix 1 – Value stream mapping icons NOTE: This is a PARTIAL PREVIEW. To download the complete template, please visit: http://www.oeconsulting.com.sg
- 3. © Operational Excellence Consulting. All rights reserved. < Type Value Stream Improvement Project Name Here > Team Leader: <name> Value Stream Champion: <name> Executive Sponsor: <name> Date:
- 4. 4 Name of Project Team (e.g. Muda Busters) Insert your team photo here.
- 5. 5 Create Implementation Plan Design Future State Document Current State Define Product Family Define and scope problem Pick product family Determine VSM objective and benefits Create VSM charter Map current state value stream Quantify current state value stream performance Analyze and identify improvement opportunities Develop future state value stream map Prioritize improvement projects Develop implementation plan Seek management approval Implement the plan and monitor progress Value Stream Mapping Roadmap 1 2 3 4
- 6. © Operational Excellence Consulting. All rights reserved. < Type Value Stream Improvement Project Name Here > Define Phase Team Leader: <name> Value Stream Champion: <name> Executive Sponsor: <name> Date:
- 7. 7 Value Stream Mapping Roadmap Create Implementation Plan Design Future State Document Current State Define Product Family Define and scope problem Pick product family Determine VSM objective and benefits Create VSM charter Map current state value stream Quantify current state value stream performance Analyze and identify improvement opportunities Develop future state value stream map Prioritize improvement projects Develop implementation plan Seek management approval Implement the plan and monitor progress 1 2 3 4
- 8. 8 Scoping: Define a Product FamilyProducts A 321 B 4 Processes Product family C D E 5 6 7 8 9 10 Machining Drilling Assy* Pack*Weld. F X X X X X X X X X X X X X X XX X X X X X X X X X * The two work stations at assembly and packaging respectively are similar. Therefore they are considered as one work station in this analysis. Product family: • The characteristics of a product family are that the products go through the same – or nearly the same – processes (same flow) and that the products have similar process times. Group Product Families by similar downstream processes, steps or equipment
- 9. 9 VSM Charter Value Stream Mapping Charter Scope Accountable Parties Schedule & Logistics Value Stream Value Stream being improved Executive Sponsor Director, VP or C-level Event Date(s) 3 days typically Specific Conditions What circumstances are included and excluded? (e.g type of customer, geographic location, etc.) Value Stream Champion If needed - often director or manager level Start/End Times Start and end times Customer Demand How many times is this done per wk, mth, yr? Facilitator / VSM Manager Skilled person leading the activity Location Need ample wall space Trigger What need does the value stream address? First Step Task on first process block Team Lead Not always needed Meals Provided? Always a nice touch; keeps the team from wandering.Last Step Task on last process block Boundaries & Limitations What is the team NOT authorized to change? Coordinator The person arranging logistics (reserving the room, ordering food, sending meeting notices, etc.) Interim Briefing(s) Aid in consensus building and organizational learning. FS Implementation Timeframe Typically 90-120 days Briefing Attendees List required attendees; others are optional. Current State Problems & Business Needs Mapping Team 1 What's driving the need for improvement? Function / Role Name Contact Information 2 1 Leadership-heavy 3 2 4 3 5 4 Measurable Target Condition 5 1 Reduce <defined metric> from X to Y (Z% improvement) 6 2 7 3 8 4 9 5 19 Benefits to Customers On-Call Support 1 How will internal/external customers benefit as a result Function / Role Name Contact Information 2 of improvements to the value stream? 1 SMEs that may not be needed full time 3 2 4 3 5 4 Benefits to Business Approvals 1 What other benefits will the business or internal customers Executive Sponsor Value Stream Champion Facilitator / VSM Manager 2 realize as a result of improvements to the VSM? 3 4 Signature: Signature: Signature: 5 Date: Date: Date:
- 10. 10 Considerations & Approach • What are the current and future demand rates? • Is the VSM showing what happens 80 percent of the time to reduce variation and focus on improving the majority of the work? • If it is prudent to focus initially on the 20% that are the exceptions, the charter should clearly define the specific conditions being mapped and the reasons for focusing on the exceptions. Alternatively, the space here can be used. • Is the VSM depicting the flow of an average lot size or work that happens on a typical shift or others? • <Add other relevant information if necessary to help the audience or reader understand the VSM>
- 11. 11 Roles & Responsibilities Team Roles Responsibilities Executive Sponsor Value Stream Mapping Champion Facilitator Logistics Coordinator Team Leader Team Members
- 12. 12 Objective Attendees / Roles Day / Time / Frequency Project Status Meeting Biweekly ‘drum beat’ to communicate project status, success, issue management Project Phase Tollgate Conducted at the end of each phase Cadence Meeting Weekly ‘drum beat’ to communicate project plan activities, project status, success, issue mgmt. <Other Meetings> <insert description> Communication Plan
- 13. 13 Define Phase Deliverables • VSM charter • VSM Manager sign-off • Executive Sponsor sign-off • Communication plan
- 14. © Operational Excellence Consulting. All rights reserved. Current State Mapping Phase Team Leader: <name> Value Stream Champion: <name> Executive Sponsor: <name> Date: < Type Value Stream Improvement Project Name Here >
- 15. 15 Value Stream Mapping Roadmap Create Implementation Plan Design Future State Document Current State Define Product Family Define and scope problem Pick product family Determine VSM objective and benefits Create VSM charter Map current state value stream Quantify current state value stream performance Analyze and identify improvement opportunities Develop future state value stream map Prioritize improvement projects Develop implementation plan Seek management approval Implement the plan and monitor progress 1 2 3 4
- 16. 16 Basic Mapping Symbols External Organization Process Block Data Block Work-in-Process In-box Push Arrow Material Receipts & Shipments Manual Information Flow Electronic Information Flow Operator / Employee Go See Scheduling Movement by Truck Minutes MinutesMinutesMinutes HoursHoursHoursLead Time Cycle Time Timeline Takt = 60 min 2 Shifts CT = 25 min C/O = 25 min
- 17. 17 Data Collection Plan What Data Box Metrics to Measure How to Measure Data Source Sampling Plan VSM Objective it relates to Comments Prepare a data collection plan for the Data Boxes.
- 18. 18 Operational Definitions • Provide operational definitions of each metric in the data box: Lead time Process time Quality Changeover time FTE (full time equivalent) etc.
- 19. 19 Current State Value Stream Map Demand all families = 100 pcs/day. Demand family A = 35 pcs/day. 2 shifts. Takt time = 532 sec. Customers Machining Ct = 420s Co = 20m Up = 70% ☺ = 1 Shifts = 3 Drilling Ct = 145s Co = 15m Up = 50% ☺ = 1 Shifts = 2 Welding Ct = 185s Co = 8m Up = 70% ☺ = 1 Shifts = 2 Assembly Ct = 360s Co = 7m Up = 80% ☺ = 1 Shifts = 2 Packaging Ct = 40s Co = 3m Up = 15% ☺ = 1 Shifts = 2 Suppliers MRP Weekly plan Forecasts = 30 days Daily orders Continuous forecasts Daily orders 58 days 6 days 9 days 5 days 2 days 42 days 420 sec 145 sec 185 sec 360 sec 40 sec Component A = 35 pcs per/day. Orders are placed on demand. Lead time from order is placed= 2 days. 2030 pcs 210 pcs 315 pcs 175 pcs 70 pcs 1470 pcs = 122 days =1150 sec. Current state value stream map should show the key process activities. A good range is 5 to 15 process boxes. Show the timeline below the current state value stream. ILLUSTRATIVE
- 20. 20 Metric Current State Goal Projected Future State % Improvement Timeline Lead Time Timeline Cycle Time % Activity Rolled First Pass Yield # Employees Floor Space Used # Shifts Add Other Relevant Metrics Current State Value Stream Mapping Results
- 21. 21 Current State Findings & Analysis Order Value Add Delivery Unnecessary Non Value Add Necessary Non Value Add
- 22. 22 Current State Findings & Analysis 15% 20% 65% Value Add (VA) Necessary Non-Value Add (SNVA) Unnecessary Non- Value Add (UNVA)
- 23. 23 Current State Mapping Phase Deliverables • Operational definitions of each metric in the data box • Current state value stream map Process boxes Data boxes Timeline Metrics Lead Time Process Time Quality • Current state plant layout/spaghetti diagram • Current state results • List of current state analysis and findings
- 24. © Operational Excellence Consulting. All rights reserved. Future State Mapping Phase Team Leader: <name> Value Stream Champion: <name> Executive Sponsor: <name> Date: < Type Value Stream Improvement Project Name Here >
- 25. 25 Value Stream Mapping Roadmap Create Implementation Plan Design Future State Document Current State Define Product Family Define and scope problem Pick product family Determine VSM objective and benefits Create VSM charter Map current state value stream Quantify current state value stream performance Analyze and identify improvement opportunities Develop future state value stream map Prioritize improvement projects Develop implementation plan Seek management approval Implement the plan and monitor progress 1 2 3 4
- 26. 26 Develop Future State Value Stream Map Demand all families = 100 pcs/day. Demand family A = 35 pcs/day. 1 shift. Takt time = 266 sec. Customers Machining Ct = 420s Co = 5m Up = 85% ☺ = 1 Shifts = 2 U-Cell Ct = 250s Co = 1-3m Up = 65-80% ☺ = 4 Shifts = 1 Suppliers MRP Daily plan Forecasts = 30 days Daily orders Continuous forecasts Daily ordersComponent A = 35 pcs per/day. Orders are placed on demand. Lead time from order is placed= 2 days. Goal 700 pcs Goal 140 pcs Goal 70 pcs Kanban U-cell Orders 20 days 4 days 2 days Sum = 730 sec = 26 days =1150 sec. 420 sec Kanban Changeover time Increase OEE Physical layout Flow between work stations etc. Daily planning Changeover times Increase OEE Task distribution ILLUSTRATIVE Define the future state value stream map. Highlight “Kaizen bursts” to indicate proposed improvements.
- 27. © Operational Excellence Consulting. All rights reserved. Implementation Phase Team Leader: <name> Value Stream Champion: <name> Executive Sponsor: <name> Date: < Type Value Stream Improvement Project Name Here >
- 28. 28 Value Stream Mapping Roadmap Create Implementation Plan Design Future State Document Current State Define Product Family Define and scope problem Pick product family Determine VSM objective and benefits Create VSM charter Map current state value stream Quantify current state value stream performance Analyze and identify improvement opportunities Develop future state value stream map Prioritize improvement projects Develop implementation plan Seek management approval Implement the plan and monitor progress 1 2 3 4
- 29. 29 Implementation Plan Future State Implementation Plan Value Stream Implementation Plan Review Dates Executive Sponsor Value Stream Champion Value Stream Mapping Facilitator Date Created Block # Goal / Objective Improvement Activity Owner Implementation Schedule (weeks) Date 1 2 3 4 5 6 7 8 9 10 11 12 Complete Approvals Executive Sponsor Value Stream Champion Value Stream Mapping Facilitator Signature: Signature: Signature: Date: Date: Dates:
- 30. © Operational Excellence Consulting. All rights reserved. About Operational Excellence Consulting
- 31. 31 About Operational Excellence Consulting • Operational Excellence Consulting is a management training and consulting firm that assists organizations in improving business performance and effectiveness. • The firm’s mission is to create business value for organizations through innovative operational excellence management training and consulting solutions. • OEC takes a unique “beyond the tools” approach to enable clients develop internal capabilities and cultural transformation to achieve sustainable world-class excellence and competitive advantage. For more information, please visit www.oeconsulting.com.sg
- 32. © Operational Excellence Consulting. All rights reserved. To download this template, please visit us at: www.oeconsulting.com.sg END OF PARTIAL PREVIEW