
Empfohlen
Weitere ähnliche Inhalte
Was ist angesagt?
Was ist angesagt? (20)
Andere mochten auch
Ähnlich wie HR Dashboard Metrics 2013
Ähnlich wie HR Dashboard Metrics 2013 (20)
Kürzlich hochgeladen
Kürzlich hochgeladen (20)
HR Dashboard Metrics 2013
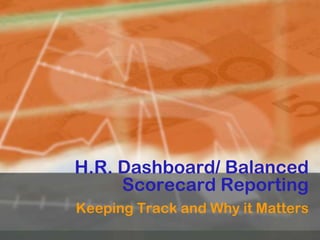
- 1. H.R. Dashboard/ Balanced Scorecard Reporting Keeping Track and Why it Matters
- 16. Dashboards are typically used for… Displaying metrics defined by the organization
- 18. Time to Fill
- 19. Dashboards are typically used for… The identified metrics are typically expressed as key performance indicators (KPIs), and a typical dashboard brings several KPIs together
- 21. KPI’s are important to strategy success Organizational Objective TIER ONE STATUS Executive Board, President, Provost, VPs, Deans AVPs, Chairs & Executive Directors Managers & Supervisors Line Staff & Students
- 22. Aligning Workforce Performance to Organizational Objectives • Performance Management • HR Process Consolidation • HR Management Tools Workforce Performance Lifecycle Strategy Execution Culture Structure Align All HR Strategies to Organizational Needs • Integrating knowledge to HR Mgmt. • Staff Retention • HR perceived value HR Development • Onboard & Orientation • Training • Mentoring
- 27. HR EVA (Economic Value Added) Three Principles: 1. Narrow down what’s measured 2. Develop an economic model for metrics (e.g. replacement cost for high potential employees is 6x’s compensation.) 3. Relate metrics to Executive Level’s desired data (use historical comparisons from materials you have already.)
- 30. So how does a scorecard fit in? “A scorecard for HR provides management a set of metrics with which to benchmark performance of an HR department and to show its value as a whole. The scorecard helps to present the HR department as a strategic asset and establish it as a partner in the organization.” –HR.Toolbox.com
- 31. Scorecard continued… “It also provides a basis for defining what functions the HR department does and does not do, as well as provide cost savings by optimizing solutions and balancing duties within the department. Having a measurement system in place helps an organization to define HR strategically and organizationally.” –HR.Toolbox.com
- 37. “One of the biggest competencies missing from HR is storytelling. If the data you present to line executives isn’t immediately seen as actionable, meaning people don’t know what the story means and what to do with it, dashboards become viewed as a throwaway process and technology pretty quickly.” - Jason Averbrook, CEO of Knowledge Fusion
- 38. “The reality is that quantifying HR is like quantifying love: It’s best to set your own standards rather than rely on the definitions of others.” – Thomas Casey, Workforce Magazine
- 39. Humbly Brought to you By Megan (with a little deco help from Aria!)
Hinweis der Redaktion
- When lights on your dashboard light up, or when you hear various bells or alarms going ;off on your dashboard, what is it telling you??? Tiny dash is from Toyota TF109, built right into console; model T speedster; Hayabusa motorcycle; Bentley Continental and Lightmatter dash (possibly from Acura or Honda)
- There are Gauges on this dashboard and surely they are likable by even the “Gauge Haters”. The top gauges use the 90 degree angle rather than the comple 180 degrees or full Circle and hence squeezing more from the screen pixels.
- Not clear what’s being measured; benchmarking but is the metric valued?
- Organization must be in alignment in order for the KPI’s to hold value
- Include all measures in a collaborative way. Example: Training working with E.R. to develop classes based on common complaints, exit interviews, performance reviews would increase both unit’s dashboards positively!
- Financial: How will this strategy contribute to the bottom line?Customers: What value will our services apply to satisfy customers & generate more “business for our unit?Internal Process: The actual processes that create & deliver customer value perspective; focus is on the activity & key processes required to excel at providing the value expected in a productive and efficient wayInnovation & learning: Intangible assets of the org, mainly internal SKAs required to support the “value creating” processes
- The scorecard is another tool used for metrics to really make a statement. We would put together a department scorecard to reflect how we did for the year and to assess where we want to go in the coming year. The scorecard depends on good performance indicators to build a solid measuring tool – just like a sports scorecard! How did we do, what did we do to get those results and what CAN we do to improve next year?
- Not only should your information be relevant and timely, but it should be easy to read, well-communicated so that anyone can read it and know what’s being measured. Finding facts and stats are easy…it just takes a little creativity to make it meaningful.
- It may not be for your first time preparing reports or running data sheets, but this process requires us to dig a little deeper and re-frame our technical thinking…we are moving from a tactical HR office to a TRANSITIONAL HR ORGANIZATION! TAKE THE LEAP!!! (Ann Marie…how was your weekend adventure?)
- It’s true colors grab your attention…but make sure your metrics have merit too. “Vivid” in this case could also refer to what makes your information sharing memorable?
- You don’t have to feel like this will just be extra work… a lot of the work is being done on a daily basis (or should be!) How many people come in to see us weekly, daily, hourly? How many of the same requests do we get? Via e-mail, via website, via phone, via walk-in? What trends do you see in the various benefits people sign-up for? Collecting this info in an Excel sheet is easy! Then you can pull it and present it in charts or benchmarking reports whenever it’s needed, or on a regular reporting schedule.
- Lately, I have been calling down to Employment asking for interview notes or Reference Checks that managers may have sent in for various employees…only ONCE have I actually gotten anything back because Managers sometimes don’t think it’s important to “keep any of that stuff after they hire people.” WHY??? If we make the case for relevancy…so we become!