Corrosion Management Services India
•
10 gefällt mir•2,920 views

Corrosion Management Activities in India

Empfohlen
Weitere ähnliche Inhalte
Was ist angesagt?
Was ist angesagt? (8)
Ähnlich wie Corrosion Management Services India
Ähnlich wie Corrosion Management Services India (20)
Mehr von Valliappan Manickam
Mehr von Valliappan Manickam (10)
Corrosion Management Services India
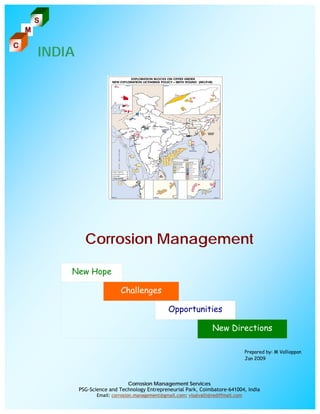
- 1. S M C INDIA Corrosion Management New Hope Challenges Opportunities New Directions Prepared by: M Valliappan Jan 2009 Corrosion Management Services PSG-Science and Technology Entrepreneurial Park, Coimbatore-641004, India Email: corrosion.management@gmail.com; visalvalli@rediffmail.com
- 2. S M C Contents Key Economic Indicators .............................................................................3 Country Profile .......................................................................................3 Cost of Corrosion in India ...........................................................................4 Overview of Industries in India .....................................................................5 Oil and Gas ............................................................................................... 5 Chemicals ................................................................................................. 6 Petrochemicals ....................................................................................... 6 Inorganic Chemicals ................................................................................. 6 Organic Chemicals ................................................................................... 6 Fine and Speciality Chemicals ..................................................................... 7 Bulk Drugs ............................................................................................. 7 Agrochemicals ........................................................................................ 7 1 Key Players – Operating Companies .................................................................8 ONGC ..................................................................................................... 8 Cairn India ............................................................................................... 9 Reliance Industries..................................................................................... 9 IOCL ..................................................................................................... 11 BPCL ...................................................................................................... 13 HPCL...................................................................................................... 14 Key Players - Corrosion Awareness in India ..................................................... 15 Key Factors for Corrosion Management .......................................................... 15
- 3. S M C Analysis Criteria and Reporting Levels ........................................................... 16 Corrosion Management Activities in India ........................................................ 16 Overview................................................................................................. 16 Corrosion Management Functional Areas ......................................................... 17 Market Research Analysis Criteria ................................................................ 17 Present Trend Vs Future Growth .................................................................. 18 Index of Production – Industries in India ..................................................... 18 Production Growth .................................................................................. 19 Comparative Analysis ............................................................................... 19 India, Malaysia, Singapore, Indonesia and Middle East........................................ 19 Market Research – Qualitative Assessment – India Vs Other Countries .................. 20 Industry specific Analysis ......................................................................... 21 Oil and Gas .............................................................................................. 21 Chemicals and Power .................................................................................. 22 What I Can Do? .................................................................................... 23 Corrosion Management Services .................................................................. 23 2 Testimonies ......................................................................................... 25 Corrosion Software Development ................................................................. 25 Corrosion Awareness in India...................................................................... 25 NACE India Section Award - 2003 ............................................................. 25 Press Clipping ........................................................................................ 26 Technical Publications.............................................................................. 27 CV Summary ........................................................................................ 28 Current Development ............................................................................... 29
- 4. S M Key Economic Indicators C GDP: $804 billion (2006 est.) Growth: Estimated 8 percent or higher in 2006-07; 7 percent in 2004-05 Breakdown: Services equal 54 percent of the GDP; industry and agriculture equal 46 percent Ranking: 10th largest economy in the world and one of its fastest growing; fourth largest in purchasing -power parity terms. Per capita income: $720 in 2005 -06, (double the figure of two decades ago). Of the 1.1 billion people, 39 percent live on less than $1 per day. Purchasing power: In 2006, approximately 180 -200 million people had growing purchasing power, thus creating a growing middle-class consumer population. Youth Power: Over 58 percent of the Indian population is under the age of 20. That is over 564 million people, nearly twice the total population of the United States. Source: BUYUSA.GOV -- U.S. Commercial Service –India Country Profile 3 Source: Doing Business in South Asia in 2007
- 5. S M Cost of Corrosion in India C Cost of Corrosion in India 2007 2005 2003 0 20,000 40,000 60,000 80,000 100,000 120,000 140,000 160,000 Total Loss in Crores Source: CORCON conference – NACE India Section- Press Clippings Cost of Corrosion in India - Sectorwise Infrastructure 4 15% Others 28% Utility Services 32% Defence and Nuclear 13% Production and Manufacturing 12%
- 6. S M Overview of Industries in India C Oil and Gas India, in 2004-2005, met 75 %of its crude oil demand through imports. The domestic production of crude oil has been in the range of 30-34 Million Metric Tons from 2001-2005. About 60 % of its crude import is from Middle East. The consumption of natural gas grew at a CAGR of 2.7 % in the period 1999-2005, supported by rise in availability through domestic and imported sources of gas. Oil comprises 36 % of India’s primary energy consumption in 2005, and is expected to grow both in absolute and percentage terms driven by overall economic growth. Growth in demand is expected to catapult the overall demand to 196 Million Metric Tons in 2011-2012 and 250 Million Metric Tons in 2024-25. Demand for oil is expected to grow from 119 Million Tons Oil Equivalent (MTOE), from 2004, to 250 MTOE, during 2025, at an annual growth of 3.6%. During the same period domestic production from existing developed reserves is expected to grow at approximately 2.5 %. Natural gas comprises 9 % of India’s primary energy consumption at present and it will be 14% of energy mix by 2010. Demand for natural gas is also likely to increase at an annual growth rate of 7.3%. Source: http://www.researchandmarkets.com/reports/338112/ 5 Source: ONGC, OIL and DGHA, Ministry of Petroleum, Govt. of India.
- 7. S M C Chemicals Contributes to 13% of GDP. One of the fastest growing sectors of Indian economy. Chemical Industry in India is fragmented and dispersed - multi product and multi faceted. Chemicals sold directly to large customers and through distribution channels. Distribution channels mostly 6 consist of stockists and dealers spread all over India addressing small segments and retail market. Petrochemicals The major category in the chemicals. One of the fastest sectors at 13% p.a. Basic chemicals like Ethylene, Propylene, Benzene and Xylene. Intermediates like MEG, PAN and LAB. Synthetic fibres like Nylon, PSF and PFY. Polymers like LDPE/HDPE, PVC, Polyester and PET. Synthetic rubber like SBR, PBR. Major players are Reliance, IPCL, NOCIL, Haldia and GAIL. Inorganic Chemicals US$ 2.5 Billion industry. Covers basic products like Caustic, Chlorine, Sulphuric Acid etc. Inorganic chemicals mostly used in detergents, glass, soap, fertiliser, alkalies etc. Competition from imports are on the rise. Organic Chemicals 1 Billion Dollar industry. Covers a wide range of chemicals. Units concentrated mostly in the Western India.
- 8. S M Fine and Speciality Chemicals Low volume, high price/margin chemicals. C Fragmented with large number of players. Major Players - Domestic: ION Exchange, Balmer Lawrie, Dai Ichi Karkaria: MNC: Ciba, Hoechst, Foseco, Nalco Chemicals, Clariant, ICI: Many small Indian companies. Market around US$ 80 million p.a. Major end user segments - Textile, Leather, paper, detergent, rubber, paints, polyester, oil and gas etc. Growing very fast. Bulk Drugs Large market due to large population Large exports (US$600-800 million) which is around 6-8% of global drugs market. Total market is US$3 Billion / pa. Out of 475 drugs used, 425 are locally produced. Over 350 units in the organised sector and many more in the unorganised sector. Bulk drug units concentrated around three areas: Bombay – Ankleshwar; Hyderabad – Madras; Chandigarh. India very strong in reverse Engineering, molecular chemistry and because patents not on products but on process. Major players: Ranbaxy, Shasun, Cipla, Dr. Reddy's, Cheminor, Lupin, IPCA, Sun, Cadilla, Wockhardt, Aurobindo, Kopran etc. Most of the bulk drug companies are Indian companies, whereas some of the major pharmaceutical formulation companies are MNCs. Agrochemicals India is a large agricultural economy which is the major user. Average Indian consumption is very low (1/20th of world average). Market size 100,000 MT (in terms of technical grade). 7 US$ 800 million and Growth at 10% pa. Consumption varies depending on crop and region Cash crops like sugarcane, tobacco etc. are the major consumers of pesticides (above 60%). Two types of producers -Technical – 40; Formulators - above 500. Major players: Domestic-United Phosphorus, Rallis and Excel; MNCs: Hoechst Agrevo, Novartis and Bayer Significant exports. Source: http://www.indianchemicalportal.com Source: KPMG Report – The Indian Chemical Industry
- 9. S M Key Players – Operating Companies C ONGC Discovered 6 of the 7 producing basins in India: Cambay Basin (1958); Rajasthan Basin (1967); A & AA FB (1973); Mumbai Offshore (1974); KG Basin (1980); Cauvery Basin (1985). Established over 6.4 of the 8.5 billion metric tonnes of In-place hydrocarbon reserves discovered so far in India. Produces over 1 million barrels of Oil Equivalent per day. Contributes around 80% of domestic oil and gas production. Strategic Goals – 2020: Double Oil and Gas In-place reserves to 12 billion tones. Augment global recovery factor from existing 28% to 40%. Obtain 20 million tonnes per annum equity Oil from abroad. 100% QHSE (Quality, Health, Safety) Infrastructure: ONGC owns and operates through: 70 onland drilling rigs, 29 offshore drilling rigs and 74 onland work-over rigs; 147 well platforms and 32 process platforms; 55 Offshore Support Vessels (OSVs) and 2 Multipurpose Support Vessels (MSVs), one seismic survey vessel and 2 for stimulation services; More than 15,000 kilometers of pipelines, the biggest pipelines in network in India, including more than 4,500 kilometers of sub-sea pipelines; Five Virtual Reality centres to augment accuracy in its exploration efforts. 8 ONGC, in its endeavor to empower its regional work centers and to bring more accountability, had undertaken a corporate restructuring exercise by which the regional locations and departments have been categorized under Assets (Producing centres), Basins (Exploring centres), Plants (Processing centres) and Services. Apart from this ten R&D and Management Institutes are there. There are ten (10) Assets, three (3) in Offshore and seven (7) in Onshore. Offshore Assets: Mumbai High, Neelam & Heera and Bassein & Satellite. Onshore Assets: Ahmedabad, Ankleshwar, Mehsana, Rajahmundry, Cauvery, Assam and Tripura. There are seven (7) Basins, one (1) in Offshore and six (6) in Onshore: Offshore: Western offshore. Onshore: Western Onshore (Cambay and Jodhpur), Assam & Assam Arakan, Krishna Godavari, Cauvery, Bengal-Purnea-Mahanadi and Frontier There are four (4) Plants producing Value Added Products: Uran (Maharashtra), Hazira (Gujarat), Gandhar (Gujarat) and Tatipaka (Andhra Pradesh-Mini Refinery). Another is coming up at Karaikal, Tamilnadu. Source: http://wwww.ongcindia.com
- 10. S M Cairn India C Cairn India was listed on 9 January 2007 on the Bombay and National Stock Exchanges. The Initial Public Offering (IPO) of Cairn India was the largest IPO to date in the Indian primary equity markets and Cairn India currently has a market capitalisation in excess of $5 billion, ranking as the fourth largest oil and gas company in India. Operations The Company operates the largest producing oil field in the Indian private sector and has pioneered the use of cutting- edge technology to extend production life. Today, we have a world-class resource base, with an interest in 15 blocks in India. A Decade of Achievement Exploration More than 30 Hydrocarbon discoveries: Onshore Shallow Offshore Deep Offshore Development Fast-track development Lakshmi gas field discovery in May 2000 and first gas by October 2002. Ravva developed from a 3,700 bopd field to 35,000 bopd field in 26 months, now producing over 50000 bopd. Mangala FDP approved within 30 months from discovery 9 Production Operates the largest producing field in Indian Private Sector. Combined field direct opex of Ravva and Cambay is $1/boe. Pioneered use of cutting-edge technologies to extend production life Source: http://wwww.cairnindia.com Reliance Industries RIL is the largest Oil & Gas acreage holder among the Private sector companies in India with 34 domestic exploration blocks covering an area of about 331,000 sq. km. This is in addition to its interest in one exploration block each in Yemen and Oman RIL also has 5 coal bed methane (CBM) blocks covering an area of about 4,000 sq. km. RIL is India's first private sector company in the Exploration and Production (E&P) sector to have discovered large gas reserves. The E&P strategy of RIL is aimed at further enhancing the level of vertical integration in its energy business, and realising value across the entire energy chain, while fulfilling important national priorities.
- 11. S M In the years to come, RIL is well positioned to be amongst the largest value creators in the upstream oil and gas sector. RIL's portfolio of E&P assets, gives it the potential to create value across entire value chain from wellhead to burner C tip. Accretion of new reserves through exploration, development of existing oil and gas reserves and development of related downstream infrastructure facilities would result in significant value creation for RIL in future. RIL has achieved a high success rate of 74 % in terms of discoveries made from the wells drilled thus far, excluding wells under evaluation. Reliance Petroleum Reliance Petroleum Limited ("RPL" or the "Company"), was set up to harness an emerging value creation opportunity in the global refining sector by Reliance Industries Limited (RIL), one of India's largest private sector company with a significant presence across the entire energy chain and a global leadership across key product segments. Currently, RPL is 75% owned subsidiary of RIL. RPL also benefits from a strategic alliance with Chevron India Holdings Pte Limited, Singapore, a wholly owned subsidiary of Chevron Corporation USA (Chevron), which currently holds a 5% equity stake. RPL was formed to set up a greenfield petroleum refinery and polypropylene plant in the Special Economic Zone (SEZ) at Jamnagar in Gujarat. This global sized, highly complex refinery is being located adjacent to RIL's existing refinery and petrochemicals complex, which is amongst the largest and most efficient in the world, thus offering significant synergies. With an annual crude processing capacity of 580,000 barrels per stream day (BPSD), RPL will be the sixth largest 10 refinery in the world. It will have a complexity of 14.0, using the Nelson Complexity Index, ranking it amongst the highest in the sector. The polypropylene plant will have a capacity to produce 0.9 million metric tonnes per annum. The refinery project is being implemented at a capital cost of Rs 27,000 crore being funded through a mix of equity and debt. This represents a capital cost of less than US $10,000 per barrel per day and compares very favourably with the average capital cost of new refineries announced in recent years. The International Energy Agency (IEA) estimates the average capital cost of new refinery in the OECD nations to be in the region of US $15,000 to 20,000 per barrel per day. The low capital cost of RPL becomes even more attractive when adjusted for high complexity of the refinery. RPL's low capital cost is a result of the benefits of 'intelligent repeat' of design and engineering aspects of RIL's existing refinery, proactive procurement strategy and faster implementation of the refinery project. This is expected to provide sustainable competitive advantage in the market place and enable RPL to deliver superior value in the coming years. RPL has embarked on an aggressive implementation plan and is targeting to complete the project within a short span of 3 years by 'intelligently replicating' the existing refinery of RIL, through repeat efforts on the engineering, procurement and construction fronts, with the same team, viz. Bechtel, UOP, Foster Wheeler that created the existing refinery of RIL at Jamnagar - considered to be a modern temple of resurgent India. Source: http://wwww.ril.com
- 12. S M IOCL C Refineries Indian Oil Corporation Ltd. is currently India's largest company by sales with a turnover of Rs. 220,779 crore (US $51 billion), the highest-ever for an Indian company, and profits of Rs. 7499 crore (US $1.73 billion) for fiscal 2006. IndianOil is also the highest ranked Indian company in the prestigious Fortune 'Global 500' listing, having moved up 18 places to the 135th position this year based on fiscal 2006 performance. It is also the 20th largest petroleum company in the world. IndianOil controls 10 of India’s 19 refineries. The group refining capacity is 60.2 million metric tonnes per annum (MMTPA) or 1.2 million barrels per day -the largest share among refining companies in India. It accounts for 40.4% share of national refining capacity. 11
- 13. S M Pipelines C IndianOil’s cross-country pipelines network is nearly 9,300 km in length and 61.72 million metric tonnes per annum (MMTPA) in capacity. Pipelines being the safest, cost-effective, environment-friendly and energy-efficient mode of transportation, have been continuously adding to the efficiency and productivity of IndianOil's refineries and marketing set-up. IndianOil's oldest pipeline, the Guwahati-Siliguri Pipeline commissioned way back in 1964, is still being operated at designed pressure and capacity. All IndianOil pipelines are certified to ISO 14001:1996 environment management system and ISO 9001:2000 quality management system while giving paramount importance to safety too. 12 Source: http://wwww.iocl.com
- 14. S M BPCL C BPCL Refineries - a Transformed Organisation BPCL, a Fortune 500 Company with an equity base of Rs.300 crore, is a leading player in the Petroleum Sector in the country. BPCL currently have Refineries at Mumbai and Kochi with a capacity of 12 Million Metric Tonnes (MMT) and 7.5 MMTPA respectively for refining crude oil. BPC's subsidiary at Numaligarh has a capacity of 3 MMT. Mumbai Refinery Future Plans: Specific areas in which R&D is being carried out by the Company Catalytic processes Clean Fuel Technology Residue Upgradation Detailed crude evaluations Value added products Modelling and simulation of Refinery processes Corrosion and fouling Analytical methods development Alternate fuels 13 High performance Diesel Engine Oil Kochi Refinery Future Plans In view of the declining market for furnace oil with high sulphur content and reducing availability / increasing prices of light and low sulphur crudes, a suitable residue upgradation facility has been found essential for Kochi Refinery. The proposed capacity expansion of the refinery by the year 2010 will result in generation of additional quantities of high sulphur heavy residue. Delayed coking has been identified as an option for upgradation of refinery residue to value added distillate products. A detailed feasibility study for refinery bottoms upgradation is being carried out with the help of a consultant. The possibility of transporting and processing some short residue from BPCL-Mumbai Refinery is also being studied. Numaligarh Refinery Future Plans In order to increase value addition to the surplus naphtha currently available at the refinery, NRL proposes a new project within the existing refinery premises to produce Motor Spirit (MS), which also conforms to Euro-III quality specifications. This is mainly by taking into consideration the Auto Fuel Policy in India on future automobile fuel quality specifications as a mater of environmental concern. Major process units to set up are: Naphtha Hydrotreating Unit (NHTU) with splitter section, Semi-Regenerative Catalytic Reformer Unit (CRU), Isomerisation Unit with Deisohexanizer Section (ISOM). M/s Toyo Engineering (I) Ltd, Mumbai has been engaged as
- 15. S M Project Monitoring Consultant. M/s AXENS, France is the Process Licensor for the project. The total plant capacity would be 225 TMTPA. C Addition of superior quality MS in product line will give better market flexibility to NRL and also increased production of LPG from the MS Project would generate additional revenue. It will ensure availability of hydrogen for meeting future needs for HSD upgradation Source: http://wwww.bharatpetroleum.com HPCL HPCL is a Fortune 500 company, with an annual turnover of over Rs 1,03,837 Crores ($ 25,142 Millions) during FY 2007- 08, 16% Refining & Marketing share in India and a strong market infrastructure. Corresponding figures for FY 2006-07 are: Rs 91,448 crores ($20,892 Million). The Corporation operates 2 major refineries producing a wide variety of petroleum fuels & specialties, one in Mumbai (West Coast) of 5.5 MMTPA capacity and the other in Vishakapatnam, (East Coast) with a capacity of 7.5 MMTPA. HPCL holds an equity stake of 16.95% in Mangalore Refinery & Petrochemicals Limited, a state-of-the-art refinery at Mangalore with a capacity of 9 MMTPA. In addition, HPCL is progressing towards setting up of a refinery in the state of Punjab in the joint sector. HPCL also owns and operates the largest Lube Refinery in the country producing Lube Base Oils of international 14 standards. This Lube Refinery accounts for over 40% of the India's total Lube Base Oil production. HPCL has successfully integrated Information Technology in its activities at different levels. The Enterprise Resource Planning (ERP) system is now operational on J.D.Edwards, an Oracle product, across the Company. Source: http://wwww.hindustanpetroleum.com
- 16. S M Key Players - Corrosion Awareness in India C 15 Source: http://wwww.naceindia.org Key Factors for Corrosion Management Corrosion Awareness Cost of corrosion HSE Awareness Environmental and Safety Regulations Industry type Industry management Attitude towards implementing new technical solutions Corrosion monitoring and management
- 17. S M Corrosion data management and analysis Corrosion expertise available – in-house, external-domestic and external-overseas C Corrosion research programs Corrosion education Corrosion conferences – national and international levels Information technology development Knowledge process outsourcing Analysis Criteria and Reporting Levels Following levels are used in all tables throughout this report for qualitative representation of opportunities available for corrosion management in India. Similar approach is also employed to focus on the opportunities, challenges and new directions for corrosion management in Malaysia, Singapore, Indonesia and Middle East presented in this market analysis report. Level Colour Coding Representation 0 No colour Activity/development is yet to be noticed 1 Activity has been initiated 2 Activities are growing; Improvements are there 3 Significant developments 16 Corrosion Management Activities in India Overview
- 18. S M C Corrosion Management Functional Areas Functional areas covered in this report are given in the following table. Corrosion Management Area Component Coupons Probes Data Loggers Corrosion Monitoring Instruments Portable Monitors Data Transmitters Retrieval Tools Impressed Current Systems Soil Analysis Pipeline Survey – CIPS/DCVG CP Evaluation and Maintenance Corrosion Monitoring Services Internal Corrosion Monitoring Chemical Treatment Optimization Laboratory Corrosion Testing Field Trials Cathodic Protection Chemical Injection Corrosion Management (CM) Design Field Trials-CM CM Component of Risk Based Inspection (RBI) CM Component of Integrity Management (IM) Corrosion Management Manual Corrosion Standards and SOPs Corrosion Data Management 17 Information Management Corrosion Software Development Integration with Other Systems Material Selection Corrosion Training Market Research Analysis Criteria Factors taken into consideration for analyzing the corrosion management business opportunities are: Index of production Industries growth rate Corrosion losses reported in the public domain through media and conferences Corrosion awareness programs in place HSE awareness programs Corrosion analysis focus Corrosion control implementation Operational corrosion monitoring facilities Corrosion management expertise Information management systems
- 19. S M Present Trend Vs Future Growth C 18 Index of Production – Industries in India Index of Production-Industries in India 250 200 150 100 50 0 1993-1994 2000-2001 2001-2002 2002-2003 2003-2004 2004-2005 2005-2006 Source: Ministry of Petroleum, Govt. of India
- 20. S M Production Growth C Source: Confederation of Indian Industries Comparative Analysis India, Malaysia, Singapore, Indonesia and Middle East 19
- 21. S M Market Research – Qualitative Assessment – India Vs Other Countries C 20
- 22. S M Industry specific Analysis C Oil and Gas 21
- 23. S M Chemicals and Power C 22
- 24. S M What I Can Do? C Corrosion Management Services Corrosion Management Services (CMS) has been started in 1998 under the Science and Technology Entrepreneurial Scheme of Department of Science and Technology (DST), Govt. of India. CMS is functioning from PSG-Science and Technology Entrepreneurial Park, Coimbatore, India. CMS specializes in the development of technology software solutions for multiplex CM and provides technical consultancy services for CM. Corrosion Management Technical Services Design, develop, implement and maintain Corrosion Management (CM) system. Conduct Corrosion Management audit. Review P&I diagrams for corrosion monitoring, chemical injection and stream sampling locations. Identify corrosion management requirements – FEED package; plant and laboratory; regular operational corrosion monitoring (OCM) and field trials; Prepare corrosion management manual; Define and use Key Performance Indicators (KPIs) – corrosion monitoring and control activities. 23 Develop ranking methodology to screen chemicals for corrosion inhibition, scale control, oxygen scavenging and microbial control. Identify International standards and develop in-house Standard Operating Procedures (SOPs) for efficient operation. Provide training to personnel for executing corrosion management operation. Gather HAZOP, HSE and Integrity Management information for CM activities; Create awareness for the leak free environment through corrosion management activities. Apply information management for planning, scheduling, reporting and integrating CM. Corrosion Risk Assessment Provide corrosion management inputs (expert corrosion rate, damage mechanism, corrosion circuits, consequence of failures and online/offline monitoring/corrosion control factors) to Risk Based Inspection, Integrity Assessment and Life Cycle Costing (LCC).
- 25. S M Prepare Corrosion Management technical reports and develop mappings for material selection, corrosion monitoring and corrosion control based on actual plant data. C Analyze corrosion management data (process data, materials of construction, equipment types, fluid composition, corrosion monitoring, corrosion control, equipment visual inspection, NDT, ILI-Intelligent Pigging, downhole tubular corrosion log and specialized inspection) in the entire process network for asset integrity report. Identify critical locations for close monitoring and risk assessment. Corrosion Management Software Develop corrosion management software solutions. Develop interface tools for linking multitude functions. Build expert system for consequence of failures and risk management. Develop simulation models for corrosion. Ability to work with various modules of plant information management – process, laboratory, inspection, maintenance and enterprise resource planning to develop relational corrosion prediction and management systems. 24 Corrosion Research and Development Provide technical support for evaluating new technologies proposed by Research and Technology division of industrial establishments. Amalgamation of corrosion research with asset corrosion management. Write technical articles on corrosion management. Ability to transform industrial experience into commercially viable and technically challenging corrosion management solutions.
- 26. S M Testimonies C Corrosion Software Development Developed integrated corrosion management software solution for Cairn Energy India Ltd., (CEIL) – S Yanam oilfield (50,000BOPD) - onshore (water injection and crude/gas processing) and offshore (seven platforms); Corrosion Awareness in India 25 NACE India Section Award - 2003 Corrosion Management Services, India Recipient of Corrosion Awareness Award-2003- Individual Engineer Category for introducing quality management systems for corrosion.
- 27. S M Press Clipping C http://www.thehindu.com/thehindu/lf/2004/11/28/stories/2004112801870200.htm Date:28/11/2004 URL: http://www.thehindu.com/thehindu/lf/2004/11/28/stories/2004112801870200.htm Back Life Bangalore Chennai Coimbatore Hyderabad Kochi Madurai Thiruvananthapuram `There is no maintenance culture in India' "When there is a breakdown or a failure there is no attempt to analyse the causes of failure. Immediate replacement is done, but the data is not used to minimise corrosion" 26 Cost reduction is an important issue facing the industry. While many systems have been implemented to control costs such as total quality management, total preventive maintenance and ISO standards, more needs to be done to address specific issues which tend to escape the purview of such general systems. Material corrosion is considered to be the number one life-limiting factor in production, manufacturing and infrastructure. India loses Rs. 36,000 crores in corrosion costs annually. Manickam Valliappan has researched and worked with the problems of industrial corrosion and has found some answers. In conversation with Puja S Navin, he discusses how he views the issue. "I began my career as a research fellow in the corrosion department of the Central Electrochemical Research Institute (CECRI), Karaikudi, in 1987. During my Chemical Engineering course, I learnt about industrial corrosion and developed an interest in it. It was also during this time CECRI was coming up and I joined it." From 1987 to 1995, he worked on various industrial projects with oil, gas and refining sector. It
- 28. S M Technical Publications Number of Publications: Seventeen C Partial List: 1. Computerized Multiplex Corrosion Management System, Materials Performance, April 2005, NACE International, USA, pp40-43. (peer reviewed - ISSN: 0094 -1492) 2. Corrosion Management for Quality Control and Assurance, Paper No. 05059, Corrosion 2005 Annual Conference, NACE International, USA. 3. Corrosion Management in Cooling Water Systems, Materials Performance, Feb 2002, NACE International, USA. (peer reviewed - ISSN: 0094 -1492) 4. Software Analysis of Cooling Water Treatment Problems - eCorr 2000 - Internet Conference - http://www.corrosionsource.com/CS2000/session8 - Applications of Computers and Internet for Corrosion Control. 5. Influence of MIC on the Pitting Resistance of Stainless Steels in Sea Water - Intercorr 96 - The first Global Internet Corrosion Conference - Session 5 - Industry focus - http://www.intercorr.com 6. Selection of Biocides for Oil fields - Review and Laboratory Assessment - 15th World Petroleum 27 Congress, Forum 15, China. 7. Pitting Corrosion of Stainless Steels in Acidified Chloride Medium - 13th International Corrosion Congress, November '96, Australia, Paper No. 380. 8. Electrochemical Dissolution of Cu-Ni alloys in Acidic Chloride Medium - 13th International Corrosion Congress, November '96, Australia, Paper N0. 129. 9. Concern over the Selection of Biocides for Oil fields and Power plants - Second Arabian Corrosion Congress, October '96, Kuwait - Oil field Corrosion Session. 10. Pitting Corrosion of Stainless Steels in Acidified Chloride Medium - STAINLESS STEELS Conference, June '96, Germany.
- 29. S M CV Summary C A Corrosion Management Consultant who has demonstrated the ability to work independently and lead diverse teams of engineering professionals from the asset owners and service contractors to achieve maximum efficiency of corrosion management functions. Proven ability to analyze an organization's corrosion management requirements, resource planning, develop innovative and cost-effective solutions for corrosion analysis, increasing life of equipments, and improving asset integrity for safe and reliable operation. Academic Qualification and Professional Certifications B.Tech., (Chemical Engineering); Graduated from Coimbatore Institute of Technology, Bharathiyar University, India (1982-’86). 1. NACE International certified 'Chemical Treatment Specialist' (Certification No.4949 issued on 01 May 1998). 2. NACE International certified ‘Senior Corrosion Technologist'. Award: Recipient of NACE International-India section award for excellence in corrosion for introducing quality management systems in the year 2003. Experience Since Jan 1987 Corrosion Consultant Kuwait Oil Company (KOC), Kuwait Jan 2007-Present Specialized Corrosion Engineer Kuwait Oil Company (KOC), Kuwait Feb 2005-Dec 2006 28 Self-employed Consultant Corrosion Management Services, India Jun 1998-Present Corrosion Engineer Kuwait National Petroleum Co., Kuwait Mar 1997-May 1998 Research Engineer Corrosion Lab, Kuwait University, Kuwait Feb 1995-Feb 1997 Research Fellow Central Electrochemical Research Institute, India Jan 1987 – Jan 1995 Recent Accomplishments Kuwait Oil Company, Kuwait KOC produces 2.6 MMBOPD Oil (Varied composition – API Gravity, CO2, H2S, Salt Content and Water Cut - South & East–1500 MBOPD; West- 500; North-600) and 1,348 MMCFPD Associated Gas from 20 Gathering Centers (process oil from more than 500 wells), 4 Booster Stations, and 2 Water Injection systems. Successfully developed in-house laboratory procedures for fluid analyses relevant for corrosion management. Prepared specifications for corrosion monitoring and control activities; Developed the first-of- its kind sampling and data management matrices for internal corrosion monitoring activities; produced corrosion mappings for the entire process network. Application of technology software solutions for corrosion management, corrosion prediction, operations information management, inspection management, risk based inspection and integrity management.
- 30. S M Provided CM inputs to Risk-based Inspection (RBI) system and gather inputs from RBI for correlating corrosion management data with risk assessment; Reviewed corrosion circuits, C expert corrosion rate and damage mechanism information provided by RBI group. Explore CM inputs for Integrity Management to identify internal/external threats and consequences. Integration of Production Operation Information, ILI Survey (Intelligent Pigging) and Corrosion Log, and Risk Based Inspection with Corrosion Management. Identified requirements for the design and development of interface tools for integrated analysis of corrosion management with process management, risk based inspection and integrity management. Corrosion Management Services, India Recipient of NACE India section award in 2003 for introducing quality management system for corrosion management. Initiated indigenous software solution development in India for corrosion management under Science and Technology Entrepreneurial Scheme of Department of Science and Technology (DST), Government of India; successfully implemented the integrated management system with Cairn Energy India Ltd. Continuing the state-of-the-art multiplex corrosion management software development. Executed B-O-T type corrosion management contract in Cairn Energy. Proficiency in Technical Software Solutions 1. Integrated Corrosion Management built on MS Access for process-corrosion mapping; Corrosion 29 Data Management using Amulet V 6.0. 2. FINDER-Version.9.2.2 – E & P data management system developed by Schlumberger. 3. Business Process Explorer-Version.2.6.0.404 – POIS developed by ASPEN Technology. 4. Orbit Plus and Orbit Onshore developed by DNV. 5. Linaview PRO – Pipeline Integrity Management Suite developed by Tuboscope. 6. ArcGIS 9.2 – Geographic Information System developed by ESRI 7. Downholesat for scale prediction. 8. PREDICT and NORSOK M-506 for expert corrosion rate calculation. 9. Data acquisition system for corrosion monitoring probes. 10. MS Office applications including MS Project. Current Development Development of corrosion management for risk based inspection. Concept