SlideShare ist ein Scribd-Unternehmen logo
1 von 47
Downloaden Sie, um offline zu lesen
Fundstrat Global Advisors
150 East 52nd St, 31st floor | New York, NY 10022
Bitcoin and Blockchain
Trust, Millennials and Wall Street
For Reg AC certification and other important disclosures, see Disclosures, Slide 54.
Thomas J. Lee, CFA AC
Head of Research
thomas@fundstrat.com
twitter: @fundstrat
Robert Sluymer, CFAAC
Head of Technical Strategy
robert.sluymer@fundstrat.com
twitter: @rsluymer
Sam DoctorAC
Head of Data Science
Research
sam.doctor@fundstrat.com
twitter: @fundstratQuant
L. Thomas Block
Policy Strategist
tom.block@fundstrat.com
twitter: @TomBlock_FS
Strategy Research
Portfolio Strategy
Quantitative
Strategy
Technical Strategy
Washington & Policy
Strategy
Sales
John Bai
Head of Sales
john@fundstrat.com
Bill Vasilakos
bill.vasilakos@fundstrat.com
Tzu-Wen Chen
tzuwen.chen@fundstrat.com
Thomas J. Lee, CFA AC
Robert Sluymer, CFAAC
Sam DoctorAC
Ken Xuan
www.Fundstrat.com | Bloomberg: FSGA <<GO>>
Crypto Currency
Strategy
Performance 1Q18 2Q18 3Q18 QTD YTD
Bitcoin (28%) – – (28%) (28%)
FS CryptoFX 10 (28%) – – (28%) (28%)
FS CryptoFX 40 (20%) – – (20%) (20%)
FS CryptoFX 250 (9%) – – (9%) (9%)
FS CryptoFX 300 (26%) – – (26%) (26%)
FS CryptoFX Agg. (26%) – – (26%) (26%)
Slide 2
This page intentionally left blank
Slide 3
Overview
Digital Trust
Millennials driving change
Crypto is an asset class
Why Wall Street will care
Slide 4
Figure: Trust in U.S. Government at 60-year lows
% who trust the US government in Washington always or most of the time
Trust in U.S. government at 60-year lows…
Source: Pew Research Center. Fundstrat, Bloomberg
Slide 5
Figure: Few countries see their citizens trust their government
Question is what % “Trust the national government to do what is right for our country”
Outside the US, trust in governments is even worse…
Source: Fundstrat, Bloomberg
U.S.
Few countries
score better
than the U.S., in
terms of trust by
their citizens...
…Note the
prevalence of
Asian and Latin
American
nations with low
trust ratings…
Slide 6
Blockchain and bitcoin growing faster outside the US
Bitcoin and blockchain are attractive
outside the US because of the inherent
structures of those regions.
• Regions with unstable financial
systems or governance make
bitcoin more attractive.
• Regions with currency controls
or strict regulations.
• Regions with uncertain economic
or financial outlook.
• Hence, we see bitcoin and
blockchain adoption as a global
story.
Slide 7
Earlier in 2016, Facebook IQ,
a team of researchers,
scientists and analysts funded
and supported by Facebook
Inc., published a white paper
entitled “Millennials +
money: The unfiltered
journey” to evaluate the
beliefs and thoughts of
today’s youth on traditional
banking and financial
systems. The paper found
that 92 percent
of millennials firmly
expressed their distrust of
banks.
92 Percent of Millennials Don’t Trust Banks
Slide 8
Blockchain enables digital money to exist with trust…
Paper money Credit card / Electronic
Digital money Blockchain
Double
spend…
Fraud…
Printing
press…
51%
protection…
Slide 9
Figure: Examples of fractionalization to digital asset tokenization
Not a complete list
Asset tokenization is an evolution of fractionalization….
Source: Fundstrat, Bloomberg
2008: Airbnb
Brian Chesky and Joe Gebbia came
up with the idea of putting an air
mattress in their living room and
turning it into a bed and breakfast.
2009: Uber
Founded ias UberCab by Garrett
Camp, the cofounder of
StumbleUpon, and Travis Kalanick.
2009: Kickstarter
Kickstarter launched on April 28,
2009, by Perry Chen, Yancey
Strickler, and Charles Adler.
1972: Frequent Flyer Miles
the very first modern frequent-flyer program was created in
1972 by Western Direct Marketing, for United Airlines.
1970: Mortgage Securitization
The U.S. Department of Housing and Urban Development
created the first mortgage-backed security. Ginnie Mae
mortgage loans.
1969:Time-shares
The first non-hotel timeshare in
the US was the Kaua`i Kailani,
started in Kauai, Hawaii in 1969
by the people who later founded
Vacation Internationale.
1987: Netjets fractional jet ownership
In 1987, the NetJets program was officially
announced becoming the first fractional aircraft
ownership format in history.
2017: Venezuelan Oil
Venezuela plans to issue a crypto
currency backed by oil
Slide 10
Figure: Illustrative example of a token for a social media company
Simply a concept, please do not judge this to be a business plan
Would Facebook be an ICO today?
Source: Fundstrat, Bloomberg
Customer
Operations
Capital
Structure
Posts
engaging
content
user
Adds other
users
Speculate
on user growth
Equity
(FB owns 33%
tokens)
Speculate on
monetization
token
Slide 11
Figure: Illustrative example of a token for a digital based business
Simply a concept, please do not judge this to be a business plan
Should Amazon issue a token?
Source: Fundstrat, Bloomberg
Customer
Operations
Capital
Structure
Purchases
goods
customer
Writes
engaging
reviews
Speculate
on user growth
Equity
(AMZN owns 33%
tokens)
Speculate on
spending
token
Slide 12
Risks
• Mining conglomerates becomes too powerful and essentially
takeover the blockchain.
• Millennials decide they like gold and allocate away from risky
assets.
• A major blockchain is hacked by a nation-state.
• Governments decide they have to destroy blockchain.
• Citizens decide they trust governments and banks.
• Quantum computers hack encryption.
• Humor: A crypto-expose is featured on 60 minutes
Slide 13
Overview
Digital Trust
Millennials driving change
Crypto is an asset class
Why Wall Street will care
Slide 14
Figure: Comparative size of generations
Population in millions
Millennials are largest population cohort ever
Source: Fundstrat, Census Bureau. Note, the population of each cohort exceeds the total births due to immigration.
43.2
44.1
79.5
65.8
95.8
Peak size of generation
(includes immigration)Generation
Year of
peak Peak size
As %
Pop # in cohort
As %
Pop
Avg
age
Greatest Generation 1910 1927 1930 43.2 35% 2.6 1% 92.9
Silent Generation 1928 1945 1974 44.1 21% 25.8 8% 78.5
Baby Boomers 1946 1964 1999 79.5 28% 73.8 23% 61.3
GenX 1965 1980 2018 65.8 20% 65.8 20% 44.5
Millenials 1981 2000 2038 95.8 25% 89.2 27% 26.5
Years of
birth
Statistics @ 2017
Generation
Year of
peak Peak size
As %
Pop # in cohort
As %
Pop
Avg
age
eatest Generation 1910 1927 1930 43.2 35% 2.6 1% 92.9
ent Generation 1928 1945 1974 44.1 21% 25.8 8% 78.5
by Boomers 1946 1964 1999 79.5 28% 73.8 23% 61.3
enX 1965 1980 2018 65.8 20% 65.8 20% 44.5
llenials 1981 2000 2038 95.8 25% 89.2 27% 26.5
Years of
birth
Statistics @ 2017
Greatest Generation
Silent Generation
Baby Boomers
Generation X
Millennials
Slide 15
Figure: What did each generation look like in their 20s
Fundsdtrat and public information
Demographics: Looking at the world through the eyes of a millennial…
Source: Fundstrat, Bloomberg
Baby Boomers
Generation X
Millennials
1980 1990 2000 2010 2020
Slide 16
Each generation sees innovations… its mostly digital today
Source: Fundstrat
Figure: Innovations seen when each generation was in their 20s
General sources. Wired magazine.
Each generation is also characterized by innovations that differentiate that generation from prior generations.
• As shown below, what differentiates the millennial experience (in their 20s) is the growth of social media and
digital businesses. Notably, we believe blockchain is the newest innovation.
Baby Boomers in their 20s
1970s-1980s
GenX in their 20s
1990s-2000s
Millennials in their 20s
2000s-now
Woman entering workforce
Mail order business
PCs/Apple
Microsoft/GUIs
GPS
Game consoles
Mobile phones
Laserdisc/CDs
email
WWW/ e-commerce
Digital Cellular
Mobile email
Mobile data
Text messaging
Google
Paypal
Video Games
Digital photography
MP3
Facebook
Uber
Airbnb
Instagram
Kickstarter
Digital video streaming
Blockchain/Bitcoin
Electric cars
Online dating
Disruptive and
misunderstood
by prior
generation
Disruptive and
misunderstood
by prior
generation
Slide 17
Figure: Topix vs S&P 500
Boomers: By 1975, many would have said Japan stock bubble peaked…
Source: Fundstrat, Bloomberg
Baby Boomers
40X rise from
1950 to 1972
Slide 18
Figure: Topix vs S&P 500
Boomers: Good thing “bosom buddies” didn’t listen to bubble talk…
Source: Fundstrat, Bloomberg
Baby Boomers
400X rise from
1950 to 1990
40X rise from
1950 to 1972
Source: Fundstrat, Bloomberg, Updata
Slide 19
Figure: Life cycle of Millennial spending and income
Survey of Consumer Finance for 2017 “real income” levels (born between 1981-2000)
Source: Fundstrat, Bloomberg, Census Bureau
Millennials average age is 26.5… still early in life cycle
The oldest millennials are 36 but the average age is 26.5. As shown below, this means the peak of millennials are driving the
automobile market but just beginning to impact the housing market. And early in the investing market.
• As the following slides show, millennials are now the most important cohort to follow for several key segments.
$15,080
$21,684
$27,924
$40,456
$50,440 $49,556
$51,324
$48,932
$10,000
$15,000
$20,000
$25,000
$30,000
$35,000
$40,000
$45,000
$50,000
$55,000
10 13 16 19 22 25 28 31 34 37 40 43 46 49 52 55 58 61 64 67
Averageannualearnings
Age of Millennial
Age 21-35
Automobile
+ Drinking age
Age 25-45
Home
purchasing
Age 30-60
Prime Income
years
2001 2004 2007 2010 2013 2016 2019 2022 2025 2028 2031 2034 2037 2040 2043 2046 2049 2052 2055 2058
Millennials
Average Age
today
Source: Fundstrat, Bloomberg, Updata
Slide 20
Figure: Composition of Generations by age group
Census bureau
Source: Fundstrat, Bloomberg, Census bureau
Millennials maturing autos, peak homebuying and early prime income
To highlight the life cycle of various generations, we have highlighted population distribution and shown the various generations
and their respective distribution. Additionally, we shaded the various life cycle behaviors (auto buying, etc.).
• Millennials are now dominating Automobile purchasing, entering homebuying and beginning to generate prime
income.
8.9
22.1
20.1
16.9
5.8
2017
12.6
19.7
21.0
12.6
2017
12.8
22.2
23.5
22.0
8.7
2017
20.2
20.3
20.7
12.6
2017
20.2
20.3
20.7
21.1
22.2
23.5
22.0
21.3
19.7
21.0
21.4
22.1
20.1
16.9
12.9
8.8
6.0
3.9
1.9
0.6
Age 0 ~ 4
Age 5 ~ 9
Age 10 ~ 14
Age 15 ~ 19
Age 20 ~ 24
Age 25 ~ 29
Age 30 ~ 34
Age 35 ~ 39
Age 40 ~ 44
Age 45 ~ 49
Age 50 ~ 54
Age 55 ~ 59
Age 60 ~ 64
Age 65 ~ 69
Age 70 ~ 74
Age 75 ~ 79
Age 80 ~ 84
Age 85 ~ 89
Age 90 ~ 94
Age 95 ~ 99
Age 100 ~ 104
2017 GenerationZBoomers GenX Millennials
1st time Car
buyer (21-35)
1st time
homebuyer
(25-49)
Prime income
(30-64)
Retirement years
(65+)
Peak per capita
Healthcare costs
(75+)
Source: Fundstrat, Bloomberg, Updata
Slide 21
Source: Fundstrat, Bloomberg, Factset
Housing follow generations and implies peak starts 2029 or so…
We believe the prime market for homebuyers is age 25-45 and as shown below, this cohort size seems to explain housing cycles.
• If precedent generations are a template, housing starts should rise through 2029 towards 2.5 million starts.
1973
1989
2010
2026
1.0
11.0
21.0
31.0
41.0
51.0
61.0
71.0
81.0
91.0
101.0
1960
1961
1962
1963
1964
1965
1966
1967
1968
1969
1970
1971
1972
1973
1974
1975
1976
1977
1978
1979
1980
1981
1982
1983
1984
1985
1986
1987
1988
1989
1990
1991
1992
1993
1994
1995
1996
1997
1998
1999
2000
2001
2002
2003
2004
2005
2006
2007
2008
2009
2010
2011
2012
2013
2014
2015
2016
2017
2018
2019
2020
2021
2022
2023
2024
2025
2026
2027
2028
2029
2030
2031
2032
2033
2034
2035
2036
2037
2038
2039
2040
#age25-45(millions)
Silent Generation:
1929-1945
Baby boomers:
1946-1964
GenX:
1965-1980
Millennials:
1981-2000
Millennials only now
starting to buy
homes and should
boost the market
past 2026…
BULLISH
Housing SAAR
Figure: Housing starts and comparative size of generations age 25-45. Starts reported in thousands.
Since 1960
Source: Fundstrat, Bloomberg, Updata
Slide 22
Figure: Composition of Generations by age group
Census bureau
Source: Fundstrat, Bloomberg, Census bureau
Millennials are just entering their prime income years
Of the 96 million millennials, about 30 million are just entering their prime income years.
• Thus, the key question from an investment perspective is how the millennials will impact the investment market in
the coming decades. After all, each generation seemed to prefer a different investment product.
8.9
22.1
20.1
16.9
5.8
2017
12.6
19.7
21.0
12.6
2017
12.8
22.2
23.5
22.0
8.7
2017
20.2
20.3
20.7
12.6
2017
20.2
20.3
20.7
21.1
22.2
23.5
22.0
21.3
19.7
21.0
21.4
22.1
20.1
16.9
12.9
8.8
6.0
3.9
1.9
0.6
Age 0 ~ 4
Age 5 ~ 9
Age 10 ~ 14
Age 15 ~ 19
Age 20 ~ 24
Age 25 ~ 29
Age 30 ~ 34
Age 35 ~ 39
Age 40 ~ 44
Age 45 ~ 49
Age 50 ~ 54
Age 55 ~ 59
Age 60 ~ 64
Age 65 ~ 69
Age 70 ~ 74
Age 75 ~ 79
Age 80 ~ 84
Age 85 ~ 89
Age 90 ~ 94
Age 95 ~ 99
Age 100 ~ 104
2017 GenerationZBoomers GenX Millennials
Prime
income
(30-64)
About 30 million of the 96 million millennials are
entering their prime income years…
Hence, they will be sizable contributors to the
change in the investing landscape…
Slide 23
Silent Generation bought gold…
Millennials
aren’t buying
Gold…
Gold
As shown below, the Silent Generation was in their prime income years. The USD moved off the gold standard in 1971.
• As shown, this surge in gold and coincident generational prime income of “Silent Generation” means this
generation is the key cohort of “gold bugs”.
Figure: Comparative Gold prices and the prime income years of various generations
Census bureau
USD off gold
standard August
15, 1971
China demand +
Financial crisis
1962 1980
1999
2018
2036
1.0
11.0
21.0
31.0
41.0
51.0
61.0
71.0
81.0
91.0
101.0
1930
1933
1936
1939
1942
1945
1948
1951
1954
1957
1960
1963
1966
1969
1972
1975
1978
1981
1984
1987
1990
1993
1996
1999
2002
2005
2008
2011
2014
2017
2020
2023
2026
2029
2032
2035
2038
2041
2044
2047
2050
2053
2056
2059
#Americans
Prime income years (age 35-60)--Greatest generation (1910-1927) Prime income years (age 35-60)--Silent Generation (1928-1945)
Prime income years (age 35-60)--Boomers (1946-1964) Prime income years (age 35-60)--GenX (1965-1980)
Prime income years (age 35-60)--Millenials (1981-2000)
1962 1980
1999
2018
2036
1.0
11.0
21.0
31.0
41.0
51.0
61.0
71.0
81.0
91.0
101.0
1930
1933
1936
1939
1942
1945
1948
1951
1954
1957
1960
1963
1966
1969
1972
1975
1978
1981
1984
1987
1990
1993
1996
1999
2002
2005
2008
2011
2014
2017
2020
2023
2026
2029
2032
2035
2038
2041
2044
2047
2050
2053
2056
2059
#Americans
Prime income years (age 35-60)--Greatest generation (1910-1927)
Prime income years (age 35-60)--Silent Generation (1928-1945)
Prime income years (age 35-60)--Boomers (1946-1964)
Prime income years (age 35-60)--GenX (1965-1980)
Prime income years (age 35-60)--Millenials (1981-2000)
Slide 24
Boomers bought equities… millennials like “Growth stocks”
S&P 500
The Baby boomers prime income years stretched from 1982 and peaked in 1999.
• Baby boomers prime income years stretched from 1982 and peaked in 1999, coinciding with equity market peak.
Boomers prime
income years
1982-1999
Figure: Comparative S&P 500 prices and the prime income years of various generations
Census bureau We believe
Millennials
like equities,
and seems
like they favor
“Growth”
stocks and
digital-based
companies…
1
11
21
31
41
51
61
71
81
91
1930
1933
1936
1939
1942
1945
1948
1951
1954
1957
1960
1963
1966
1969
1972
1975
1978
1981
1984
1987
1990
1993
1996
1999
2002
2005
2008
2011
2014
2017
2020
2023
2026
2029
2032
2035
2038
2041
2044
2047
2050
2053
2056
2059
#ofAmericans
Prime income years (age 35-60)--
Silent Generation
Prime income years (age 35-60)--
Boomer
Prime income years (age 35-60)--
Gen-X
Prime income years (age 35-60)--
Millenial
Slide 25
GenX really liked Hedge funds…
The prime years for hedge funds (based on number) was 1990s to 2007. Since then, the number of funds has been declining.
• The hedge fund industry is evolving and those with deep fundamental or a unique advantage will likely appeal to
millennials..
0
500
1,000
1,500
2,000
2,500
3,000
3,500
4,000
Dec'45
Jul'48
Feb'51
Sep'53
Apr'56
Nov'58
Jun'61
Jan'64
Aug'66
Mar'69
Oct'71
May'74
Dec'76
Jul'79
Feb'82
Sep'84
Apr'87
Nov'89
Jun'92
Jan'95
Aug'97
Mar'00
Oct'02
May'05
Dec'07
Jul'10
Feb'13
Sep'15
Apr'18
# Hedge funds
(worldwide)
Figure: Comparative number of Hedge funds and the prime income years of various generations
Morningstar
Not entirely
clear…
Prime years
were 1999 to
2007, coinciding
with GenX
0.01
0.1
1
10
100
1000
10000
100000
1000000
10000000
2010
2012
2014
2016
1980
1999
2018
2036
1.0
11.0
21.0
31.0
41.0
51.0
61.0
71.0
81.0
91.0
101.0
#Americans
Prime income years (age 35-60)--Greatest generation
(1910-1927)
Prime income years (age 35-60)--Silent Generation
(1928-1945)
Prime income years (age 35-60)--Boomers (1946-1964)
Prime income years (age 35-60)--GenX (1965-1980)
Slide 26
Millennials LOVE Bitcoin and Blockchain
Figure: Fundstrat FS CryptoFX 300 Index
Morningstar
$100k
$1M
$10M
Slide 27
Overview
Digital Trust
Millennials driving change
Crypto is an asset class
Why Wall Street will care
Slide 28
Regulation: St Louis Fed is constructive on bitcoin and blockchain…
Source: https://files.stlouisfed.org/files/htdocs/publications/review/2018/01/10/a-short-introduction-to-the-world-of-cryptocurrencies.pdf
Figure: Abstract St Louis Fed
Published January 10, 2018
The St Louis Fed even sees bitcoin as a useful crypto-currency
Textbook 30-yrs ago… Reality today…
IPOs
Only profitable Technology
companies go public…
% profitable at IPO
1980-1995
average 92%
1999-2000
2013-2017
average
20%
Private
Equity
Public equity is larger than
the private market…
# private equity
companies as percent
of Wilshire 5000
2000:
32% 2016: 84%
Bonds
Bonds are income
instruments…
% bonds with negative
rates (G7, ex-US)
2000: 0% 2017: 80%
Central
Banks
Central banks only own
bonds and risk-free assets…
BoJ ownership of Topix 2002: 0% 2015: 2.5%
Slide 29
Finance 101 books 30-yrs ago not true anymore… will evolve for crypto…
Figure: Comparative changes in approach to valuations
Fundstrat estimates.
We believe crypto and blockchain valuations will lead to an evolution in thinking about market valuations for tokens.
While these are not traditional equities, there are elements available to create a valuation approach.
• Investors seem to be dismissive of the value of tokens, because of the apparent blurriness of token
governance versus equity (like a tracking stock) and the unclear position within a capital structure.
• But as highlighted below, while fundamental valuation remains central to any approach, markets have evolved
their approach to valuations of assets.
https://site.warrington.ufl.edu/ritter/files/2018/01/IPOs2017Statistics-1.pdf
https://www.toptal.com/finance/private-equity-consultants/private-equity-industry
Slide 30
Digital Store of Value addresses $280T market…
20-yr
CAGR
Value
($ billions) % Total
Gold Estimate Fundstrat 5.0 $9,000 3
Collectible Art https://www2.deloitte.com/lu/en/pages/
art-finance/articles/art-finance-
report.html
3.0 $17,000 6
Real Estate
http://www.mcguire.com/blog/2017/04/
savills-world-worth/ 5.0 $228,000 82
Government bonds
(neg rate)
Deutsche Bank -0.5 * $20,000 7
Cars, collectibles Estimate Fundstrat 7.0 $5,000 2
Global stores of value $280,000 100
Bitcoin n/a $200 0.1
Figure: Comparative Store of Value
$ Billions.
%
* Average interest rate of negative rate government bonds
%
%
%
Slide 31
Figure: Annual World Gold Production
Units in metric tons. Thru 2015. From US Geological Survey
Gold supply growth is ~3%... Will be higher than bitcoin in a few years…
Source: Fundstrat, Bloomberg
3,100
0
500
1,000
1,500
2,000
2,500
3,000
3,500
Jan '21 Sep '32 May '44 Jan '56 Sep '67 May '79 Jan '91 Sep '02 May '14
Annualworldgoldproduction
(metrictons,1000kg)
2.7%
-6%
-4%
-2%
0%
2%
4%
6%
8%
Jan '21 Sep '32 May '44 Jan '56 Sep '67 May '79 Jan '91 Sep '02 May '14
10-yrCAGRAnnualProduction
10-yr CAGR of Gold production
surged to 2.7%...
Annual production exceeded
3,100 metric tons
Surged in
past 7 years..
100-yr avg:
1.9%
Dec '35
$35
Feb '75
$184
Jan '80
$684 Dec '87
$493
Sep '11
$1,789
Jul '17
$1,223
Dec '35
1157%
Feb '75
773%
Jan '80
1879%
Dec '87
817%
Sep '11
956%
Jul '17
481%
0%
200%
400%
600%
800%
1000%
1200%
1400%
1600%
1800%
2000%
Jan '21 Apr '27 Jul '33 Oct '39 Jan '46 Apr '52 Jul '58 Oct '64 Jan '71 Apr '77 Jul '83 Oct '89 Jan '96 Apr '02 Jul '08 Oct '14 Jan '21
Goldoutstandingas%
USDincirculation
Slide 32
Figure: Gold price and gold value outstanding as % USD in circulation
Gold price is shown as $ per troy oz. Ratio of Gold value to USD is percent. Since 1921
Gold a buy when value as % circulation <300%... a sell >750%
Source: Fundstrat, Bloomberg
Gold
Spot price
($/troy oz)
Gold overvalued
>750%
Gold under-
valued
<300%
1934 Gold Reserve Act passed:
Private ownership prohibited
1971 gold standard abandoned:
USD no longer pegged to gold
Slide 33
Figure: Comparative value of Intangibles as % total EV
Based on Bloomberg data
Intangibles (including brand) essentially 91% FANG value…
Source: Fundstrat, Bloomberg
EV Tangible Assets Intangible value estimates
Ticker Company
Enterprise
Value PP&E
Prepaid
expenses
Deferred
Tax
Assets LT Assets
Current
Assets ex-
Cash
Intangible
Value
Intangible as
% EV
FB Facebook Inc-A $485,860 $8,591 $1,312 $4,952 $471,005 97%
AMZN Amazon.Com Inc $642,703 $29,114 $3,869 $19,800 $589,920 92%
AAPL Apple Inc $738,444 $33,783 $8,974 $1,188 $54,464 $640,035 87%
NFLX Netflix Inc $97,807 $250 $227 $7,389 $3,987 $85,954 88%
NVDA Nvidia Corp $130,831 $521 $62 $1,738 $128,510 98%
GOOG Alphabet Inc-Cl C $674,371 $34,234 $1,819 $383 $0 $19,075 $618,860 92%
TSLA Tesla Inc $64,871 $5,983 $9,539 $2,867 $46,483 72%
FAANNG Composite $2,834,887 $112,476 $1,819 $9,584 $23,359 $106,882 $2,580,767 91%
S&P 500 $28,618,706 $4,541,372 $4,556 $359,580 $1,140,730 $3,988,148 $22,017,705 77%
Slide 34
Figure: General categories of tokens
Per Fundstrat
Store of Value still best. Is 2018 the year we see growth in tokenization?
Source: Fundstrat, Bloomberg
Store of Value Digital Currency Utility Security tokens
Purpose Digital Gold Currency Pay for services Fractional exposure
A store of value is the function
of an asset that can be saved,
retrieved and useful when
retrieved. More generally, a
store of value is anything that
retains purchasing power into
the future.
Digital currencies use
encryption to regulate the
generation of units of currency
and verify the transfer of funds,
independently of a central
bank.
The utility tokens are services
or units of services that can be
purchased, similar to API keys,
used to access the service.
These fund projects of shared
infrastructure.
Tokens are representing shares
of a business. The SEC
considers these a security and
fall under the 1934 Security
Exchange Act.
Appreciation potential Yes Yes Yes Yes
Decentralized or not? Blockchain Blockchain mostly Mixed Mixed
Representative Tokens Bitcoin
Ethereum classic
Ethereum
Neo
Qtum
Bitcoin Cash
Zcash
Monero
Dash
Telegram (GRAM)
Powerledger
SingularityNET
FunFair
Paragon
STEEM
KWHcoin
Filecoin
Tron
Tether
Basecoin
LAToken
Goldmint (MNT)
Jibrel Networks (JNT)
High-net worth families allocate $1.6T to Art…
Per PrivateInvestor.com
Art cannot be compared to
traditional assets such as equities,
bonds or even commodities. The
access to information is restricted
for the layman, liquidity is often
constrained, holding costs are
comparatively high and even
through there are techniques to
analyze the market, the value of an
artwork is ultimately driven by a
large variety of parameters, part of
those being extremely difficult to
predict.
If family offices own
about 10%-15% of all
collectible art, this
implies that the
aggregate value of Art
as a store of value is
$11 to $17 Trillion.
http://www.privateartinvestor.com/art-business/art-collecting-as-a-means-to-store-value/
https://www2.deloitte.com/lu/en/pages/art-finance/articles/art-finance-report.html
Figure: Estimated Family Office allocation to Art
From Deloitte Art Report 2017
3.0%
-20%
0%
20%
20-yr CAGR
Slide 36
Art has appreciated at 3% gross 20-year CAGR…
0
1
4
16
64
256
1,024
4,096
16,384
1875
1879
1883
1887
1891
1895
1899
1903
1907
1911
1915
1919
1923
1927
1931
1935
1939
1943
1947
1951
1955
1959
1963
1967
1971
1975
1979
1983
1987
1991
1995
1999
2003
2007
2011
2015
2019
2023
2027
2031
2035
2039
Mei Moses/ Artprice.comFigure: Art Price performance since 1875
1875 to 2002 is Mei Moses. From 2002 to now is Artprice.com. 100=1875
Source: Fundstrat, Bloomberg
Art has essentially been
flat past 20-years…
Flat
Flat
We have shown the price performance of art from 1875 to today, concatenating the Mei Moses art index (acquired by
Sotheby’s) with a more modern series developed by artprice.com.
• While there was a period of tremendous appreciation from 1950 to 1987, Art since then, has performed a lot
less spectacularly—in fact, in the past 20 years, the CAGR was 3%. Art storage has high maintenance cost
(see prior page) and there is also survivorship bias (does not track destroyed art)—hence, future durability of
Art as a store of value to outperform the last 20-years is not clear.
Slide 37
Figure: Key variables in valuing Bitcoin and other cryptocurrencies
$ trillions, except bitcoin value
Framework for bitcoin: ~$125,000 per unit by 2022
We have created a framework for valuing bitcoin, based on the assumptions outlined below:
• In short, we looked at the projected growth of money supply (M0) and a forecast for the ratio of the
alternative currencies to M0 (gold historically is the bulk of this value). And then allocated a share to bitcoin.
Under this forecast, we see bitcoin rising to $125,000 by 2022.
Source: Fundstrat, Bloomberg
M0, or cash assets,
including currency and
is called narrow money
Money supply
growth
Ratio of alternatives,
including gold to M0.
Ratio alternative
currency to M0
Bitcoin share of
alternative currency. 5-
year projection
Bitcoin share of
alternative
1. 2. 3.x x =
Based on 21mm
maximum units (fully
diluted)
Bitcoin
value
Value
$1.55TCurrent: 487% ~3.5% ~$15,000
$2.2T2022E: 600% ~20.0% ~$125,000
1921-2017
Average:
7.0% 554%
Slide 38
Figure: Alt-coins surged since December
Based on the liquid universe of alt-coins. 57 in 2014. 250 in 2015. 400 in 2016. >700 in 2017.
2017 was an exceptionally good year for alt-tokens and 2018 so far…
Below we have calculated the percentage of alt-tokens that have risen by at least 200% in the past 90-days—and since
2014, this has been a surprisingly cyclical series.
• In 2015 and 2016, the peak of the alt-coin rallies was 28% of tokens rising 200% in a rolling 3M period. In 2017,
this figure peaked at 81% in mid-2017 and in early-2018, this is hovering at 78% and approaching the 2017
highs.
• Not surprisingly, when alt-coins are selling off, this is bullish for bitcoin/ETH.
Source: Fundstrat, Bloomberg
28.0% 29.6%
80.6%
77.6%
0%
10%
20%
30%
40%
50%
60%
70%
80%
90%
%Coins(liquiduniverse)
% of coin with over 200% 90-day trailing return
Alt-coin
rotation peak
Alt-coin
rotation peak
Alt-coin
rotation peak
Figure: Correlation Matrix (%)
Based on the daily return of last 90 days
Source: Coinmarketcap.com, Bloomberg, other sources and Fundstrat.
Cross Token Correlation Matrix
Slide 39
Bitcoin
Ethereum
Ripple
Litecoin
Dash
IOTA
Monero
NEO
EthereumClassic
Zcash
NEM
BitConnect
Lisk
Waves
Stratis
Steem
Ark
Bytecoin
BasicAttenti...
Augur
MaidSafeCoin
Golem
StellarLumens
BitShares
Komodo
Decred
Ardor
PIVX
Factom
Veritaseum
GameCredits
Siacoin
Gnosis
Iconomi
ByteballBytes
DigiByte
Dogecoin
MCAP
Status
Bancor
Verge
Syscoin
Nxt
Edgeless
Ubiq
NAVCoin
Rise
Vertcoin
FirstBlood
Triggers
Bitcoin 100 38 22 55 1 25 37 21 28 24 32 92 24 47 41 55 12 59 24 24 28 30 21 30 47 22 44 16 16 33 26 24 24 23 29 29 51 37 28 35 39 26 54 7 13 33 21 10 17 2
Ethereum 100 59 71 35 33 57 52 66 64 75 43 63 59 60 40 48 49 45 72 67 57 29 51 53 55 46 52 68 35 53 53 67 68 45 60 52 20 45 93 41 40 37 26 45 38 42 34 48 23
Ripple 100 60 14 38 49 36 59 50 56 23 44 42 45 19 28 31 43 48 52 42 32 42 36 22 40 48 52 24 36 37 37 42 24 46 45 12 47 53 20 35 20 20 46 12 19 20 34 11
Litecoin 100 27 37 54 41 63 56 69 57 60 50 50 34 41 54 56 60 60 51 30 50 50 37 54 50 59 32 53 51 46 48 44 56 63 25 55 65 30 56 40 27 50 39 29 26 45 22
Dash 100 12 35 21 4 48 26 (5) 25 9 14 9 1 4 9 29 32 20 1 17 9 21 8 10 20 10 18 11 4 25 14 6 10 1 14 25 (2) 21 7 13 19 9 10 9 8 7
IOTA 100 62 28 50 42 54 18 55 50 57 32 42 40 45 44 51 47 44 54 41 19 41 43 48 38 33 50 34 41 31 59 46 34 42 39 30 30 26 30 57 38 37 13 46 14
Monero 100 39 59 57 65 33 52 59 56 40 41 51 47 56 70 49 42 45 39 33 44 41 63 42 34 41 42 53 33 43 57 14 42 55 25 46 37 23 56 46 30 29 38 10
NEO 100 37 48 51 26 50 49 51 32 44 32 38 49 53 45 28 47 47 42 49 39 48 27 56 49 38 36 47 55 41 12 33 53 43 39 27 39 49 36 38 25 51 15
Ethereum Classic 100 50 61 29 48 46 58 32 40 37 38 56 51 50 37 49 40 36 38 52 65 27 41 43 49 54 27 55 47 7 53 61 32 32 30 20 46 26 28 20 47 16
Zcash 100 57 26 51 47 46 26 36 32 39 62 51 53 34 49 35 35 40 41 57 19 41 39 52 54 43 49 45 23 42 56 25 30 23 23 51 30 22 18 44 14
NEM 100 36 75 67 64 35 57 52 63 73 77 67 47 53 58 45 52 65 73 45 62 65 59 60 47 73 57 18 59 73 43 59 37 33 70 52 38 49 62 24
BitConnect 100 33 48 40 56 20 61 34 31 31 33 20 30 51 27 46 18 22 34 30 26 32 28 37 34 48 34 31 44 39 31 47 16 15 36 24 15 24 4
Lisk 100 62 57 29 60 41 57 57 69 60 34 47 52 39 43 57 67 46 68 51 51 52 46 58 45 28 49 66 43 52 24 38 62 55 40 41 65 33
Waves 100 65 44 53 48 49 49 59 49 48 44 55 38 50 46 56 41 53 49 46 57 51 64 51 24 45 60 50 48 47 27 52 54 29 40 49 23
Stratis 100 61 41 53 40 59 67 60 42 49 65 56 47 55 59 35 58 59 47 52 48 65 53 27 53 60 47 50 49 37 54 44 33 28 54 34
Steem 100 25 59 24 39 38 34 16 29 63 38 49 27 32 41 29 44 26 32 27 33 39 19 25 43 46 28 62 29 24 30 19 21 29 6
Ark 100 42 47 52 49 41 28 37 44 42 49 54 62 38 38 49 43 43 44 57 32 13 32 52 42 44 28 42 48 42 39 28 50 30
Bytecoin 100 39 52 55 45 32 46 55 40 51 35 47 48 41 56 38 39 49 50 70 31 44 59 38 36 49 31 38 42 43 26 46 17
Basic Attenti... 100 49 57 58 41 37 54 42 52 48 46 50 49 49 46 41 41 57 48 18 38 49 38 59 24 53 66 49 37 33 51 25
Augur 100 69 62 30 46 48 52 55 61 68 30 51 66 64 65 52 63 56 24 46 72 38 44 41 40 55 36 47 32 58 22
MaidSafeCoin 100 67 42 55 52 48 47 61 60 42 59 55 51 49 48 61 52 22 56 69 44 56 33 40 68 50 55 42 58 18
Golem 100 40 48 56 51 52 48 49 34 52 60 53 48 64 62 48 27 59 56 38 50 35 39 72 42 48 35 61 22
Stellar Lumens 100 45 23 20 29 31 37 21 26 37 37 28 25 50 39 17 36 30 20 37 26 14 39 20 13 33 33 7
BitShares 100 41 23 44 27 49 19 39 54 36 37 45 62 52 15 56 52 43 25 38 17 50 28 54 17 53 27
Komodo 100 52 60 45 51 42 55 53 36 37 47 54 50 37 44 55 55 44 49 42 52 54 35 23 55 22
Decred 100 35 39 51 28 43 43 44 47 46 47 38 24 25 59 42 38 24 53 44 38 34 32 39 41
Ardor 100 48 38 33 39 56 37 33 47 50 47 24 45 44 39 48 62 33 53 38 36 25 42 16
PIVX 100 54 37 50 49 41 46 30 46 40 13 49 51 36 47 32 38 55 38 28 42 48 24
Factom 100 32 57 60 51 69 40 65 55 17 46 70 41 44 24 35 58 46 36 35 54 29
Veritaseum 100 29 23 37 28 21 29 27 22 18 40 28 30 25 28 37 39 27 28 36 12
GameCredits 100 53 38 43 36 55 57 25 50 57 45 47 25 33 51 41 36 29 57 33
Siacoin 100 40 50 48 73 63 24 51 54 43 40 44 43 49 29 44 23 60 22
Gnosis 100 55 38 57 37 21 35 70 28 27 29 30 48 40 29 31 44 11
Iconomi 100 38 54 50 15 42 67 35 37 21 29 43 32 32 27 42 21
Byteball Bytes 100 59 45 17 34 50 29 36 19 36 50 41 40 21 52 21
DigiByte 100 58 26 53 63 52 46 36 43 57 43 48 32 65 25
Dogecoin 100 23 47 53 33 41 35 28 45 30 36 16 45 15
MCAP 100 23 20 19 6 23 22 18 18 18 5 15 10
Status 100 46 36 33 38 21 58 32 42 34 52 25
Bancor 100 46 39 31 33 48 44 51 38 52 24
Verge 100 23 38 29 40 43 55 33 42 29
Syscoin 100 30 39 49 42 23 43 42 24
Nxt 100 21 26 27 18 18 27 13
Edgeless 100 40 42 37 19 48 40
Ubiq 100 53 39 41 55 28
NAV Coin 100 27 39 45 34
Rise 100 18 45 29
Vertcoin 100 32 15
FirstBlood 100 49
Triggers 100
How to read this: the “Highest/Lowest
Win Ratio” based on past 90-day daily
return. High Win Ratio means the
cryptocurrency more positive return days
How to read this: Upside less Downside vol is
calculated by using the volatility of daily returns
on up days minus the volatility of daily returns
on down days over the past 90 days.
Source: Coinmarketcap.com, Bloomberg, other sources and Fundstrat.
FS CryptoFX 10 and 40 members ranked by Win Ratio and Upside less Downside Vol
Rank
Win
Ratio
90
Day
% Rank
Win
Ratio
90
Day
%
1 Bitcoin 61 254 26 Ethereum Classic 49 73
2 BitConnect 57 194 27 Veritaseum 48 49
3 FirstBlood 57 (2) 28 Monero 48 116
4 Dogecoin 57 54 29 Nxt 48 596
5 Ardor 56 274 30 Siacoin 48 32
6 Litecoin 56 50 31 Decred 47 53
7 IOTA 53 638 32 Bancor 47 7
8 Komodo 53 0 33 PIVX 47 26
9 Stratis 53 43 34 Dash 47 122
10 Zcash 52 49 35 NEO 47 46
11 Ripple 52 16 36 GameCredits 47 (3)
12 Bytecoin 52 39 37 Steem 47 23
13 Vertcoin 52 864 38 Basic Attenti... 47 (16)
14 Rise 52 10 39 Ubiq 47 (12)
15 Ethereum 51 53 40 Gnosis 47 (26)
16 Augur 51 18 41 Factom 47 (21)
17 Ark 51 49 42 Byteball Bytes 46 (27)
18 Status 51 75 43 MaidSafeCoin 46 (24)
19 Stellar Lumens 51 657 44 Edgeless 46 73
20 BitShares 51 56 45 MCAP 46 (39)
21 Waves 50 75 46 NEM 44 (13)
22 Verge 50 17 47 Golem 44 (22)
23 DigiByte 50 (15) 48 Syscoin 44 24
24 NAV Coin 50 18 49 Iconomi 43 (28)
25 Lisk 49 17 50 Triggers 43 (23)
Rank
UV
less
DV
90
Day
% Rank
UV
less
DV
90
Day
%
1 Triggers 219 (23) 26 Ark 21 49
2 Stellar Lumens 170 657 27 Stratis 20 43
3 MCAP 145 (39) 28 Byteball Bytes 18 (27)
4 IOTA 138 638 29 MaidSafeCoin 17 (24)
5 Nxt 137 596 30 Zcash 17 49
6 NAV Coin 117 18 31 BitConnect 17 194
7 Gnosis 115 (26) 32 GameCredits 17 (3)
8 Syscoin 106 24 33 DigiByte 14 (15)
9 Steem 96 23 34 Bitcoin 14 254
10 Dash 93 122 35 Lisk 13 17
11 Veritaseum 87 49 36 Factom 13 (21)
12 Rise 85 10 37 NEM 10 (13)
13 Vertcoin 76 864 38 Basic Attenti... 10 (16)
14 NEO 75 46 39 BitShares 10 56
15 Decred 70 53 40 FirstBlood 9 (2)
16 Edgeless 58 73 41 Augur 9 18
17 Status 52 75 42 Ethereum 8 53
18 Siacoin 51 32 43 Dogecoin 5 54
19 PIVX 45 26 44 Golem 4 (22)
20 Iconomi 43 (28) 45 Ubiq 3 (12)
21 Ardor 42 274 46 Bancor 1 7
22 Waves 33 75 47 Ripple (2) 16
23 Monero 31 116 48 Bytecoin (7) 39
24 Verge 25 17 49 Komodo (13) 0
25 Ethereum Classic 24 73 50 Litecoin (15) 50
Slide 40
Top 25
Win
Ratio
UV
less
DV
90
Day
% Bottom 25
Win
Ratio
UV
less
DV
90
Day
%
1 IOTA 53 138 638 1 Golem 44 4 (22)
2 Stellar Lumens 51 170 657 2 Ubiq 47 3 (12)
3 Rise 52 85 10 3 NEM 44 10 (13)
4 Vertcoin 52 76 864 4 Bancor 47 1 7
5 Ardor 56 42 274 5 Factom 47 13 (21)
6 NAV Coin 50 117 18 6 Basic Attenti... 47 10 (16)
7 BitConnect 57 17 194 7 MaidSafeCoin 46 17 (24)
8 Nxt 48 137 596 8 Byteball Bytes 46 18 (27)
9 Status 51 52 75 9 Iconomi 43 43 (28)
10 Bitcoin 61 14 254 10 GameCredits 47 17 (3)
11 Stratis 53 20 43 11 Bytecoin 52 (7) 39
12 Veritaseum 48 87 49 12 Lisk 49 13 17
13 Zcash 52 17 49 13 Edgeless 46 58 73
14 FirstBlood 57 9 (2) 14 BitShares 51 10 56
15 Waves 50 33 75 15 Ripple 52 (2) 16
16 Ark 51 21 49 16 Ethereum 51 8 53
17 Dash 47 93 122 17 Augur 51 9 18
18 Verge 50 25 17 18 Komodo 53 (13) 0
19 Steem 47 96 23 19 Litecoin 56 (15) 50
20 Decred 47 70 53 20 DigiByte 50 14 (15)
21 Dogecoin 57 5 54 21 Syscoin 44 106 24
22 Gnosis 47 115 (26) 22 PIVX 47 45 26
23 MCAP 46 145 (39) 23 Monero 48 31 116
24 Siacoin 48 51 32 24 Ethereum Classic 49 24 73
25 NEO 47 75 46 25 Triggers 43 219 (23)
How to read this: The Leadership Ratio ranks the
cryptocurrencies on the combined Win Ratio and Upside
less Downside Volatility spread
Win Ratio — 90 days
Sorted high to low
Upside Vol less downside Vol — 90 days
Sorted high to low
A B
Leadership Ratio (avg of A + B)
Sorted high to low
Rank of A + B
Slide 41
Overview
Digital Trust
Millennials driving change
Crypto is an asset class
Why Wall Street will care
Slide 42
Figure: Comparative Profitability
Estimates for Coinbase
Profits to be made: Coinbase profitability may exceed ICE in 2018
Source: Fundstrat, Bloomberg
Coinbase
Intercontinental
Exchange
(ICE)
Est. sales 2017 >$1 billion $4.6 billion
Est. profit margin 60% 35%
Net profit $600mm $1.6 billion
Slide 43
Figure: Market Cap of Country Stock Markets
$
Cryptoassets are larger than most country equity markets…
Source: Fundstrat, Bloomberg
Market Cap
Crypto assets $550,000,000,000
Rank Country Name Market Cap
1 United States $27,352,200,720,000
2 China $7,320,738,379,789
3 Euro area $6,217,813,253,466
4 Japan $4,955,299,652,289
5 Hong Kong SAR, China $3,193,235,542,860
6 France $2,156,832,792,355
7 Canada $1,993,522,735,730
8 Germany $1,716,041,505,061
9 South Asia $1,585,359,261,547
10 India $1,566,680,487,701
11 Switzerland $1,403,355,611,193
12 Australia $1,268,493,506,774
13 Korea, Rep. $1,254,541,184,535
14 South Africa $951,320,328,604
15 Netherlands $854,349,119,294
16 Brazil $758,558,918,035
17 Spain $704,551,326,648
18 Singapore $640,427,546,857
19 Russian Federation $622,051,532,645
20 Saudi Arabia $448,831,069,542
21 Thailand $432,956,179,451
22 Indonesia $425,767,769,936
23 Belgium $377,756,548,791
24 Malaysia $359,788,303,781
25 Mexico $350,809,553,624
Ranks 26-100 $2,817,299,785,779
Total $71,728,582,616,286
Crypto assets $550,000,000,000
Almost same size as:
Brazil
Spain
Singapore
Russia
Larger than:
Ireland
Spain
Israel
Greece
Turkey
Thailand
Vietnam
Slide 44
Crypto-currencies are simply not correlated to equities, bonds, gold, HF.
Bitcoin
FS
CryptoFX
10
FS
CryptoFX
40
FS
CryptoFX
250
FS
CryptoFX
300
FS
CryptoFX
Aggregate S&P 500
The US
Dollar
Index
MSCI All
World
Index
Bloomberg
Barclays
US Agg
Bond
Index
Salient
Risk
Parity
Index
Bloomberg
Comdty
Total
Return
Index
Bloomberg
Barclays
US
Treasury
Index Gold Oil
Bitcoin 100 91 31 37 88 88 13 14 1 8 2 (17) 9 (9) (11)
FS CryptoFX 10 100 54 55 100 100 11 4 5 10 1 (15) 11 (5) (7)
FS CryptoFX 40 100 79 62 62 13 (3) 10 9 3 (0) 9 11 5
FS CryptoFX 250 100 62 62 5 (14) 10 16 1 (5) 16 17 (8)
FS CryptoFX 300 100 100 12 3 7 11 1 (14) 11 (4) (7)
FS CryptoFX Aggregate 100 12 3 7 11 1 (14) 11 (4) (7)
S&P 500 100 23 69 (20) 16 (12) (22) (6) 3
The US Dollar Index 100 11 (17) (3) (26) (19) (45) (7)
MSCI All World Index 100 (16) 28 (6) (18) 7 11
Bloomberg Barclays US Agg Bond Index 100 65 35 99 50 27
Salient Risk Parity Index 100 71 64 59 53
Bloomberg Comdty Total Return Index 100 35 63 67
Bloomberg Barclays US Treasury Index 100 50 26
Gold 100 27
Oil 100
Figure: FS Crypto FX Indices Correlation Matrix against Major Asset Classes (%)
Based on the daily return of last 90 days
Take a look at the correlation matrix below. What really stands out is that correlations to other asset classes is low.
• Interesting to see the negative correlation to other commodities and perhaps this explains why CTAs and
commodity funds seem to be earlier in looking at crypto.
12.4%
6.4%
(11.5%)
2.0%
(20%)
(10%)
0%
10%
20%
30%
90Dcorrelation
6.1%
10.2%
6.4%
8.3%
(9.0%) (7.6%)
18.2%
0.7%
-20%
-15%
-10%
-5%
0%
5%
10%
15%
20%
25%
30%
90Dcorrelation
Slide 45
Crypto correlation to other asset classes is low and falling…
Source: Coinmarketcap.com, Bloomberg, other sources and Fundstrat.
Figure: 90D Rolling Correlation - Bitcoin & FS CryptoFX 10 Correlation against Major Asset Classes
Over last 100 days
Bitcoin
FS CryptoFX 10
S&P 500
BBG US Agg Bond Idx
Gold
Salient Risk Parity Idx
Bitcoin correlation to other asset
classes is declining and continues
to be negatively correlated to
Gold—not surprising and
evidence of cannibalization of
demand for gold.
Even looking at the top 10 tokens
(which includes bitcoin), the
correlation to other asset classes
is quite low.
When looking at rolling correlations of Bitcoin to other asset classes, the correlation is still low.
Source: Fundstrat, Bloomberg, Updta
$120.68
$128.54
$141.01
$168.89
$90
$180
10/2/2014
11/2/2014
12/2/2014
1/2/2015
2/2/2015
3/2/2015
4/2/2015
5/2/2015
6/2/2015
7/2/2015
8/2/2015
9/2/2015
10/2/2015
11/2/2015
12/2/2015
1/2/2016
2/2/2016
3/2/2016
4/2/2016
5/2/2016
6/2/2016
7/2/2016
8/2/2016
9/2/2016
10/2/2016
11/2/2016
12/2/2016
1/2/2017
2/2/2017
3/2/2017
4/2/2017
5/2/2017
6/2/2017
7/2/2017
8/2/2017
9/2/2017
Typical Conservative Moderate Bitcoin-plus Crypto 10
Figure: Performance metrics of various asset allocation portfolios with modest crypto-currency exposure
Each portfolios rebalanced every 3-months.
ENHANCED PORTFOLIO RETURN: Crypto adds return, boosts Sharpe-ratio
Slide 46
To illustrate the positive effects from adding Crypto currencies to a portfolio, consider the performance of various
portfolios below.
• By adding even 2% to the portfolio (funded by reducing equities by 200bp), 3-yr annualized gains rise 226bp.
Pushing this to 5% increases total return by 547bp, nearly doubling the return of a typical stock/bond blend.
Ratio 3-yr Portfolio Performance Metrics
Stocks / Bonds /
Bitcoin / Crypto 10
Return
CAGR
Annualized
Volatility Sharpe Ratio
Maximum
Drawdown
Typical 60% / 40% / 0% / 0% 6.47% 7.38% 59% (7.9% )
Conservative 58% / 40% / 2% / 0% 8.73% 7.32% 91% (7.2% )
Moderate 55% / 40% / 5% / 0% 12.14% 7.86% 128% (7.4% )
Bitcoin-plus Crypto 10 50% / 40% / 5% / 5% 19.22% 9.54% 180% (8.0% )
Disclosures
This research is for the clients of Fundstrat Global Advisors only. For important disclosures and rating histories regarding sectors or companies that are the subject of this report, please contact your sales
representative or Fundstrat Global Advisors at 150 East 52nd Street, New York, NY, 10022 USA.
Analyst Certification (Reg AC)
Thomas J. Lee, the research analyst denoted by an “AC” on the cover of this report, hereby certifies that all of the views expressed in this report accurately reflect his personal views, which have not been
influenced by considerations of the firm’s business or client relationships.
Neither I, nor a member of my household is an officer, director, or advisory board member of the issuer(s) or has another significant affiliation with the issuer(s) that is/are the subject of this research
report. There is a possibility that we will from time to time have long or short positions in, and buy or sell, the securities or derivatives, if any, referred to in this research
Conflicts of Interest
This research contains the views, opinions and recommendations of Fundstrat. As of the time of writing and publication of this presentation, Fundstrat does not know of, or have reason to know of any
material conflicts of interest at the time of the publication of this presentation. The Company has no contractual relationship, nor have we received any compensation from any of the companies listed in
this research report.
Analyst Industry/Sector Views
Positive (+): The analyst expects the performance of his industry/sector coverage universe over the next 6-18 months to be attractive vs. the relevant broad market benchmark, being the S&P 500 for
North America.
Neutral (N): The analyst expects the performance of his or her industry/sector coverage universe over the next 6-18 months to be in line with the relevant broad market benchmark, being the S&P 500 for
North America.
Negative (-): The analyst expects his or her industry coverage universe over the next 6-18 months to underperform vs. the relevant broad market benchmark, being the S&P 500 for North America.
General Disclosures
Fundstrat Global Advisors is an independent research company and is not a registered investment advisor and is not acting as a broker dealer under any federal or state securities laws. Fundstrat Global
Advisors is a member of IRC Securities’ Research Prime Services Platform. IRC Securities is a FINRA registered broker-dealer that is focused on supporting the independent research industry. Certain
personnel of Fundstrat (i.e. Research Analysts) are registered representatives of IRC Securities, a FINRA member firm registered as a broker-dealer with the Securities and Exchange Commission and
certain state securities regulators. As registered representatives and independent contractors of IRC Securities, such personnel may receive commissions paid to or shared with IRC Securities for
transactions placed by Fundstrat clients directly with IRC Securities or with securities firms that may share commissions with IRC Securities in accordance with applicable SEC and FINRA requirements. IRC
Securities does not distribute the research of Fundstrat, which is available to select institutional clients that have engaged Fundstrat.
As registered representatives of IRC Securities our analysts must follow IRC Securities’ Written Supervisory Procedures. Notable compliance policies include (1) prohibition of insider trading or the
facilitation thereof, (2) maintaining client confidentiality, (3) archival of electronic communications, and (4) appropriate use of electronic communications, amongst other compliance related policies.
Fundstrat does not have the same conflicts that traditional sell-side research organizations have because Fundstrat (1) does not conduct any investment banking activities, (2) does not manage any
investment funds, and (3) our clients are only institutional investors.
This research is for the clients of Fundstrat Global Advisors only. Additional information is available upon request. Information has been obtained from sources believed to be reliable but Fundstrat Global
Advisors does not warrant its completeness or accuracy except with respect to any disclosures relative to Fundstrat and the analyst's involvement (if any) with any of the subject companies of the
research. All pricing is as of the market close for the securities discussed, unless otherwise stated. Opinions and estimates constitute our judgment as of the date of this material and are subject to change
without notice. Past performance is not indicative of future results. This material is not intended as an offer or solicitation for the purchase or sale of any financial instrument. The opinions and
recommendations herein do not take into account individual client circumstances, risk tolerance, objectives, or needs and are not intended as recommendations of particular securities, financial
instruments or strategies. The recipient of this report must make its own independent decision regarding any securities or financial instruments mentioned herein. Except in circumstances where
Fundstrat expressly agrees otherwise in writing, Fundstrat is not acting as a municipal advisor and the opinions or views contained herein are not intended to be, and do not constitute, advice, including
within the meaning of Section 15B of the Securities Exchange Act of 1934. All research reports are disseminated and available to all clients simultaneously through electronic publication to our internal
client website, fundstrat.com. Not all research content is redistributed to our clients or made available to third-party aggregators or the media. Please contact your sales representative if you would like to
receive any of our research publications.
Copyright 2017 Fundstrat Global Advisors LLC. All rights reserved. No part of this material may be reprinted, sold or redistributed without the prior written consent of Fundstrat Global Advisors LLC.
Slide 47Version: 6/26/17

Más contenido relacionado

Was ist angesagt?

Fintech Overview and Growth Drivers
Fintech Overview and Growth DriversFintech Overview and Growth Drivers
Fintech Overview and Growth DriversRatnakar Pandey
 
Seed stage 2019 final
Seed stage 2019   finalSeed stage 2019   final
Seed stage 2019 finalMark Suster
 
Startup roadmap 2014 vecsenyi
Startup roadmap 2014 vecsenyiStartup roadmap 2014 vecsenyi
Startup roadmap 2014 vecsenyiValalkozasIndito
 
Topic 6 fintech
Topic 6 fintechTopic 6 fintech
Topic 6 fintechallen1215
 
EECS 441 Company Presentation: Lemonade
EECS 441 Company Presentation: LemonadeEECS 441 Company Presentation: Lemonade
EECS 441 Company Presentation: LemonadeAndrewLopes6
 
Linkedin Series B Pitch Deck
Linkedin Series B Pitch DeckLinkedin Series B Pitch Deck
Linkedin Series B Pitch DeckJoseph Hsieh
 
Upfront vc analysis 2016
Upfront vc analysis 2016Upfront vc analysis 2016
Upfront vc analysis 2016Mark Suster
 
Mint.com Pre-Launch Pitch Deck
Mint.com Pre-Launch Pitch DeckMint.com Pre-Launch Pitch Deck
Mint.com Pre-Launch Pitch DeckHiten Shah
 
Global FinTech Trends
Global FinTech TrendsGlobal FinTech Trends
Global FinTech TrendsJohn Owens
 
Nubank: Neobank from Brazil to the whole Latin America
Nubank: Neobank from Brazil to the whole Latin AmericaNubank: Neobank from Brazil to the whole Latin America
Nubank: Neobank from Brazil to the whole Latin AmericaSam Ghosh
 
Cryptocurrencies and AML
Cryptocurrencies and AMLCryptocurrencies and AML
Cryptocurrencies and AMLMinerva
 
Hardbacon Pitch Deck
Hardbacon Pitch DeckHardbacon Pitch Deck
Hardbacon Pitch DeckJulien Brault
 
Hisobus - dtac accelerate batch 7
Hisobus - dtac accelerate batch 7Hisobus - dtac accelerate batch 7
Hisobus - dtac accelerate batch 7dtac Accelerate
 
Messari Report Crypto Theses for 2022
Messari Report Crypto Theses for 2022Messari Report Crypto Theses for 2022
Messari Report Crypto Theses for 2022IQbal KHan
 
The Next Phase of FinTech Collaboration
The Next Phase of FinTech Collaboration The Next Phase of FinTech Collaboration
The Next Phase of FinTech Collaboration Devie Mohan
 
Analytics in banking services
Analytics in banking servicesAnalytics in banking services
Analytics in banking servicesMariyageorge
 

Was ist angesagt? (20)

Fintech Overview and Growth Drivers
Fintech Overview and Growth DriversFintech Overview and Growth Drivers
Fintech Overview and Growth Drivers
 
Seed stage 2019 final
Seed stage 2019   finalSeed stage 2019   final
Seed stage 2019 final
 
Fintech Business & Payments Strategy
Fintech Business & Payments StrategyFintech Business & Payments Strategy
Fintech Business & Payments Strategy
 
Startup roadmap 2014 vecsenyi
Startup roadmap 2014 vecsenyiStartup roadmap 2014 vecsenyi
Startup roadmap 2014 vecsenyi
 
Fintech
FintechFintech
Fintech
 
Topic 6 fintech
Topic 6 fintechTopic 6 fintech
Topic 6 fintech
 
EECS 441 Company Presentation: Lemonade
EECS 441 Company Presentation: LemonadeEECS 441 Company Presentation: Lemonade
EECS 441 Company Presentation: Lemonade
 
Linkedin Series B Pitch Deck
Linkedin Series B Pitch DeckLinkedin Series B Pitch Deck
Linkedin Series B Pitch Deck
 
Upfront vc analysis 2016
Upfront vc analysis 2016Upfront vc analysis 2016
Upfront vc analysis 2016
 
Mint.com Pre-Launch Pitch Deck
Mint.com Pre-Launch Pitch DeckMint.com Pre-Launch Pitch Deck
Mint.com Pre-Launch Pitch Deck
 
Global FinTech Trends
Global FinTech TrendsGlobal FinTech Trends
Global FinTech Trends
 
Uber pitch deck
Uber pitch deckUber pitch deck
Uber pitch deck
 
Nubank: Neobank from Brazil to the whole Latin America
Nubank: Neobank from Brazil to the whole Latin AmericaNubank: Neobank from Brazil to the whole Latin America
Nubank: Neobank from Brazil to the whole Latin America
 
Cryptocurrencies and AML
Cryptocurrencies and AMLCryptocurrencies and AML
Cryptocurrencies and AML
 
AppBind
AppBindAppBind
AppBind
 
Hardbacon Pitch Deck
Hardbacon Pitch DeckHardbacon Pitch Deck
Hardbacon Pitch Deck
 
Hisobus - dtac accelerate batch 7
Hisobus - dtac accelerate batch 7Hisobus - dtac accelerate batch 7
Hisobus - dtac accelerate batch 7
 
Messari Report Crypto Theses for 2022
Messari Report Crypto Theses for 2022Messari Report Crypto Theses for 2022
Messari Report Crypto Theses for 2022
 
The Next Phase of FinTech Collaboration
The Next Phase of FinTech Collaboration The Next Phase of FinTech Collaboration
The Next Phase of FinTech Collaboration
 
Analytics in banking services
Analytics in banking servicesAnalytics in banking services
Analytics in banking services
 

Ähnlich wie Fundstrat Bitcoin & Blockchain presentation for Upfront Summit

Netwealth educational webinar - Top 10 learnings from Silicon Valley fintech ...
Netwealth educational webinar - Top 10 learnings from Silicon Valley fintech ...Netwealth educational webinar - Top 10 learnings from Silicon Valley fintech ...
Netwealth educational webinar - Top 10 learnings from Silicon Valley fintech ...netwealthInvest
 
BITCOIN: LEFT FOR DEAD HUNDREDS OF TIMES – STILL ALIVE AND KICKING
BITCOIN: LEFT FOR DEAD HUNDREDS OF TIMES – STILL ALIVE AND KICKINGBITCOIN: LEFT FOR DEAD HUNDREDS OF TIMES – STILL ALIVE AND KICKING
BITCOIN: LEFT FOR DEAD HUNDREDS OF TIMES – STILL ALIVE AND KICKINGSteven Rhyner
 
Fintech 2024.pdf Fintech 2024.pdf Fintech 2024.pdf Fintech 2024.pdf
Fintech 2024.pdf Fintech 2024.pdf Fintech 2024.pdf Fintech 2024.pdfFintech 2024.pdf Fintech 2024.pdf Fintech 2024.pdf Fintech 2024.pdf
Fintech 2024.pdf Fintech 2024.pdf Fintech 2024.pdf Fintech 2024.pdfAlemayhuTefire1
 
The Future of Money, Frank Schwab, 2019
The Future of Money, Frank Schwab, 2019The Future of Money, Frank Schwab, 2019
The Future of Money, Frank Schwab, 2019Frank Schwab
 
The future-of-cryptocurrency-2021
The future-of-cryptocurrency-2021The future-of-cryptocurrency-2021
The future-of-cryptocurrency-2021zer zeed
 
entrepreneurshipandtheearlystageecosysteminchina
entrepreneurshipandtheearlystageecosysteminchinaentrepreneurshipandtheearlystageecosysteminchina
entrepreneurshipandtheearlystageecosysteminchinamjc1
 
Technopreneurship and the Early Stage Ecosystem in China 2011
Technopreneurship and the Early Stage Ecosystem in China 2011Technopreneurship and the Early Stage Ecosystem in China 2011
Technopreneurship and the Early Stage Ecosystem in China 2011Chris Evdemon
 
Technopreneurship and the Early Stage Ecosystem in China 2011
Technopreneurship and the Early Stage Ecosystem in China 2011Technopreneurship and the Early Stage Ecosystem in China 2011
Technopreneurship and the Early Stage Ecosystem in China 2011Finn Evdemon Capital Partners
 
Blockchains in the mainstream - interviews with entrepreneurs
Blockchains in the mainstream - interviews with entrepreneurs Blockchains in the mainstream - interviews with entrepreneurs
Blockchains in the mainstream - interviews with entrepreneurs Ian Beckett
 
JP Morgan Crypto Report - Feb 3, 2022 "The Maltese Falcon"
JP Morgan Crypto Report - Feb 3, 2022 "The Maltese Falcon"JP Morgan Crypto Report - Feb 3, 2022 "The Maltese Falcon"
JP Morgan Crypto Report - Feb 3, 2022 "The Maltese Falcon"Mike Dudas
 
Third Industrial Revolution Sept 2014
Third Industrial Revolution Sept 2014Third Industrial Revolution Sept 2014
Third Industrial Revolution Sept 2014Robin Teigland
 
Blockchain Capital's 2019 Year in Review
Blockchain Capital's 2019 Year in ReviewBlockchain Capital's 2019 Year in Review
Blockchain Capital's 2019 Year in ReviewKinjal Shah
 
Culture And Anarchy An Essay In Political And Social Criticism Summary
Culture And Anarchy An Essay In Political And Social Criticism SummaryCulture And Anarchy An Essay In Political And Social Criticism Summary
Culture And Anarchy An Essay In Political And Social Criticism SummarySarah Camacho
 
BITCOIN IS POTENTIAL NATIONAL THREAT, SAYS U.S. REGULATOR
BITCOIN IS POTENTIAL NATIONAL THREAT, SAYS U.S. REGULATORBITCOIN IS POTENTIAL NATIONAL THREAT, SAYS U.S. REGULATOR
BITCOIN IS POTENTIAL NATIONAL THREAT, SAYS U.S. REGULATORSteven Rhyner
 
DigitalFX: A New Asset Class for Investors
DigitalFX: A New Asset Class for Investors DigitalFX: A New Asset Class for Investors
DigitalFX: A New Asset Class for Investors MecklerMedia
 
cryptocurrencies
cryptocurrenciescryptocurrencies
cryptocurrenciesNeil Liu
 
How to make money with cryptocurrency in 2022.pdf
How to make money with cryptocurrency in 2022.pdfHow to make money with cryptocurrency in 2022.pdf
How to make money with cryptocurrency in 2022.pdfNerajKumar2
 
Bank geoown presentation
Bank geoown presentationBank geoown presentation
Bank geoown presentationAbhijeet Kelkar
 

Ähnlich wie Fundstrat Bitcoin & Blockchain presentation for Upfront Summit (20)

Netwealth educational webinar - Top 10 learnings from Silicon Valley fintech ...
Netwealth educational webinar - Top 10 learnings from Silicon Valley fintech ...Netwealth educational webinar - Top 10 learnings from Silicon Valley fintech ...
Netwealth educational webinar - Top 10 learnings from Silicon Valley fintech ...
 
BITCOIN: LEFT FOR DEAD HUNDREDS OF TIMES – STILL ALIVE AND KICKING
BITCOIN: LEFT FOR DEAD HUNDREDS OF TIMES – STILL ALIVE AND KICKINGBITCOIN: LEFT FOR DEAD HUNDREDS OF TIMES – STILL ALIVE AND KICKING
BITCOIN: LEFT FOR DEAD HUNDREDS OF TIMES – STILL ALIVE AND KICKING
 
Fintech 2024.pdf Fintech 2024.pdf Fintech 2024.pdf Fintech 2024.pdf
Fintech 2024.pdf Fintech 2024.pdf Fintech 2024.pdf Fintech 2024.pdfFintech 2024.pdf Fintech 2024.pdf Fintech 2024.pdf Fintech 2024.pdf
Fintech 2024.pdf Fintech 2024.pdf Fintech 2024.pdf Fintech 2024.pdf
 
The Right Now Economy
The Right Now EconomyThe Right Now Economy
The Right Now Economy
 
The Future of Money, Frank Schwab, 2019
The Future of Money, Frank Schwab, 2019The Future of Money, Frank Schwab, 2019
The Future of Money, Frank Schwab, 2019
 
The future-of-cryptocurrency-2021
The future-of-cryptocurrency-2021The future-of-cryptocurrency-2021
The future-of-cryptocurrency-2021
 
entrepreneurshipandtheearlystageecosysteminchina
entrepreneurshipandtheearlystageecosysteminchinaentrepreneurshipandtheearlystageecosysteminchina
entrepreneurshipandtheearlystageecosysteminchina
 
Technopreneurship and the Early Stage Ecosystem in China 2011
Technopreneurship and the Early Stage Ecosystem in China 2011Technopreneurship and the Early Stage Ecosystem in China 2011
Technopreneurship and the Early Stage Ecosystem in China 2011
 
Technopreneurship and the Early Stage Ecosystem in China 2011
Technopreneurship and the Early Stage Ecosystem in China 2011Technopreneurship and the Early Stage Ecosystem in China 2011
Technopreneurship and the Early Stage Ecosystem in China 2011
 
Blockchains in the mainstream - interviews with entrepreneurs
Blockchains in the mainstream - interviews with entrepreneurs Blockchains in the mainstream - interviews with entrepreneurs
Blockchains in the mainstream - interviews with entrepreneurs
 
JP Morgan Crypto Report - Feb 3, 2022 "The Maltese Falcon"
JP Morgan Crypto Report - Feb 3, 2022 "The Maltese Falcon"JP Morgan Crypto Report - Feb 3, 2022 "The Maltese Falcon"
JP Morgan Crypto Report - Feb 3, 2022 "The Maltese Falcon"
 
Why Bitcoin Matters
Why Bitcoin MattersWhy Bitcoin Matters
Why Bitcoin Matters
 
Third Industrial Revolution Sept 2014
Third Industrial Revolution Sept 2014Third Industrial Revolution Sept 2014
Third Industrial Revolution Sept 2014
 
Blockchain Capital's 2019 Year in Review
Blockchain Capital's 2019 Year in ReviewBlockchain Capital's 2019 Year in Review
Blockchain Capital's 2019 Year in Review
 
Culture And Anarchy An Essay In Political And Social Criticism Summary
Culture And Anarchy An Essay In Political And Social Criticism SummaryCulture And Anarchy An Essay In Political And Social Criticism Summary
Culture And Anarchy An Essay In Political And Social Criticism Summary
 
BITCOIN IS POTENTIAL NATIONAL THREAT, SAYS U.S. REGULATOR
BITCOIN IS POTENTIAL NATIONAL THREAT, SAYS U.S. REGULATORBITCOIN IS POTENTIAL NATIONAL THREAT, SAYS U.S. REGULATOR
BITCOIN IS POTENTIAL NATIONAL THREAT, SAYS U.S. REGULATOR
 
DigitalFX: A New Asset Class for Investors
DigitalFX: A New Asset Class for Investors DigitalFX: A New Asset Class for Investors
DigitalFX: A New Asset Class for Investors
 
cryptocurrencies
cryptocurrenciescryptocurrencies
cryptocurrencies
 
How to make money with cryptocurrency in 2022.pdf
How to make money with cryptocurrency in 2022.pdfHow to make money with cryptocurrency in 2022.pdf
How to make money with cryptocurrency in 2022.pdf
 
Bank geoown presentation
Bank geoown presentationBank geoown presentation
Bank geoown presentation
 

Mehr von Mark Suster

Funding in the time of Corona Virus
Funding in the time of Corona VirusFunding in the time of Corona Virus
Funding in the time of Corona VirusMark Suster
 
Managing Your Startup Board
Managing Your Startup BoardManaging Your Startup Board
Managing Your Startup BoardMark Suster
 
Is vc still a thing final
Is vc still a thing   finalIs vc still a thing   final
Is vc still a thing finalMark Suster
 
Staff at vc firms
Staff at vc firmsStaff at vc firms
Staff at vc firmsMark Suster
 
ICO 2.0 Summit - Keynote Presetnation
ICO 2.0 Summit - Keynote PresetnationICO 2.0 Summit - Keynote Presetnation
ICO 2.0 Summit - Keynote PresetnationMark Suster
 
Upfront Ventures Bitcoin & Blockchain VC Survey
Upfront Ventures Bitcoin & Blockchain VC SurveyUpfront Ventures Bitcoin & Blockchain VC Survey
Upfront Ventures Bitcoin & Blockchain VC SurveyMark Suster
 
Upfront Ventures blockchain and crypto deck
Upfront Ventures blockchain and crypto deckUpfront Ventures blockchain and crypto deck
Upfront Ventures blockchain and crypto deckMark Suster
 
Upfront Ventures VC Survey 2017
Upfront Ventures VC Survey 2017Upfront Ventures VC Survey 2017
Upfront Ventures VC Survey 2017Mark Suster
 
Upfront LP Survey of the Venture Capital & Startup Industry
Upfront LP Survey of the Venture Capital & Startup IndustryUpfront LP Survey of the Venture Capital & Startup Industry
Upfront LP Survey of the Venture Capital & Startup IndustryMark Suster
 
Upfront State of the VC & Tech Industry 2017
Upfront State of the VC & Tech Industry 2017Upfront State of the VC & Tech Industry 2017
Upfront State of the VC & Tech Industry 2017Mark Suster
 
Final LA tech and venture landscape
Final LA tech and venture landscapeFinal LA tech and venture landscape
Final LA tech and venture landscapeMark Suster
 
Final san diego venture group keynote 2016
Final san diego venture group keynote   2016Final san diego venture group keynote   2016
Final san diego venture group keynote 2016Mark Suster
 
Final upfront lp survey data 2016
Final upfront lp survey data 2016Final upfront lp survey data 2016
Final upfront lp survey data 2016Mark Suster
 
VC survey data 2016
VC survey data 2016VC survey data 2016
VC survey data 2016Mark Suster
 
Final venture outlook 2016
Final venture outlook 2016Final venture outlook 2016
Final venture outlook 2016Mark Suster
 
There is Something Going on in the LA Tech Market by Upfront Ventures
There is Something Going on in the LA Tech Market by Upfront VenturesThere is Something Going on in the LA Tech Market by Upfront Ventures
There is Something Going on in the LA Tech Market by Upfront VenturesMark Suster
 
The Changing Structure of the Venture Capital Industry
The Changing Structure of the Venture Capital IndustryThe Changing Structure of the Venture Capital Industry
The Changing Structure of the Venture Capital IndustryMark Suster
 
Why It's Morning in Venture Capital
Why It's Morning in Venture CapitalWhy It's Morning in Venture Capital
Why It's Morning in Venture CapitalMark Suster
 
Final web summit (dublin oct 2013)
Final web summit (dublin oct 2013)Final web summit (dublin oct 2013)
Final web summit (dublin oct 2013)Mark Suster
 
Online video market sept 2013
Online video market sept 2013Online video market sept 2013
Online video market sept 2013Mark Suster
 

Mehr von Mark Suster (20)

Funding in the time of Corona Virus
Funding in the time of Corona VirusFunding in the time of Corona Virus
Funding in the time of Corona Virus
 
Managing Your Startup Board
Managing Your Startup BoardManaging Your Startup Board
Managing Your Startup Board
 
Is vc still a thing final
Is vc still a thing   finalIs vc still a thing   final
Is vc still a thing final
 
Staff at vc firms
Staff at vc firmsStaff at vc firms
Staff at vc firms
 
ICO 2.0 Summit - Keynote Presetnation
ICO 2.0 Summit - Keynote PresetnationICO 2.0 Summit - Keynote Presetnation
ICO 2.0 Summit - Keynote Presetnation
 
Upfront Ventures Bitcoin & Blockchain VC Survey
Upfront Ventures Bitcoin & Blockchain VC SurveyUpfront Ventures Bitcoin & Blockchain VC Survey
Upfront Ventures Bitcoin & Blockchain VC Survey
 
Upfront Ventures blockchain and crypto deck
Upfront Ventures blockchain and crypto deckUpfront Ventures blockchain and crypto deck
Upfront Ventures blockchain and crypto deck
 
Upfront Ventures VC Survey 2017
Upfront Ventures VC Survey 2017Upfront Ventures VC Survey 2017
Upfront Ventures VC Survey 2017
 
Upfront LP Survey of the Venture Capital & Startup Industry
Upfront LP Survey of the Venture Capital & Startup IndustryUpfront LP Survey of the Venture Capital & Startup Industry
Upfront LP Survey of the Venture Capital & Startup Industry
 
Upfront State of the VC & Tech Industry 2017
Upfront State of the VC & Tech Industry 2017Upfront State of the VC & Tech Industry 2017
Upfront State of the VC & Tech Industry 2017
 
Final LA tech and venture landscape
Final LA tech and venture landscapeFinal LA tech and venture landscape
Final LA tech and venture landscape
 
Final san diego venture group keynote 2016
Final san diego venture group keynote   2016Final san diego venture group keynote   2016
Final san diego venture group keynote 2016
 
Final upfront lp survey data 2016
Final upfront lp survey data 2016Final upfront lp survey data 2016
Final upfront lp survey data 2016
 
VC survey data 2016
VC survey data 2016VC survey data 2016
VC survey data 2016
 
Final venture outlook 2016
Final venture outlook 2016Final venture outlook 2016
Final venture outlook 2016
 
There is Something Going on in the LA Tech Market by Upfront Ventures
There is Something Going on in the LA Tech Market by Upfront VenturesThere is Something Going on in the LA Tech Market by Upfront Ventures
There is Something Going on in the LA Tech Market by Upfront Ventures
 
The Changing Structure of the Venture Capital Industry
The Changing Structure of the Venture Capital IndustryThe Changing Structure of the Venture Capital Industry
The Changing Structure of the Venture Capital Industry
 
Why It's Morning in Venture Capital
Why It's Morning in Venture CapitalWhy It's Morning in Venture Capital
Why It's Morning in Venture Capital
 
Final web summit (dublin oct 2013)
Final web summit (dublin oct 2013)Final web summit (dublin oct 2013)
Final web summit (dublin oct 2013)
 
Online video market sept 2013
Online video market sept 2013Online video market sept 2013
Online video market sept 2013
 

Último

10 Tips for Great Teams CSUN Conference 2024
10 Tips for Great Teams CSUN Conference 202410 Tips for Great Teams CSUN Conference 2024
10 Tips for Great Teams CSUN Conference 2024Nate Evans
 
Record of Module Forensic photography in
Record of Module Forensic photography inRecord of Module Forensic photography in
Record of Module Forensic photography inalexademileighpacal
 
The Vietnam Believer_Newsletter_Vol.001_Mar12 2024
The Vietnam Believer_Newsletter_Vol.001_Mar12 2024The Vietnam Believer_Newsletter_Vol.001_Mar12 2024
The Vietnam Believer_Newsletter_Vol.001_Mar12 2024believeminhh
 
L-1 VISA Business (Plan Sample) - Plan Writers
L-1 VISA Business (Plan Sample) - Plan WritersL-1 VISA Business (Plan Sample) - Plan Writers
L-1 VISA Business (Plan Sample) - Plan WritersPlan Writers
 
0311 National Accounts Online Giving Trends.pdf
0311 National Accounts Online Giving Trends.pdf0311 National Accounts Online Giving Trends.pdf
0311 National Accounts Online Giving Trends.pdfBloomerang
 
Benihana of Tokyo case study11111111.pdf
Benihana of Tokyo case study11111111.pdfBenihana of Tokyo case study11111111.pdf
Benihana of Tokyo case study11111111.pdfjavenxxx01
 
PHX Corporate Presentation March 2024 Final
PHX Corporate Presentation March 2024 FinalPHX Corporate Presentation March 2024 Final
PHX Corporate Presentation March 2024 FinalPanhandleOilandGas
 
How The Hustle Milestone Referral Program Got 300K Subscribers
How The Hustle Milestone Referral Program Got 300K SubscribersHow The Hustle Milestone Referral Program Got 300K Subscribers
How The Hustle Milestone Referral Program Got 300K SubscribersFlyyx Tech
 
Optimize Your CRM Customization and Beyond
Optimize Your CRM Customization and BeyondOptimize Your CRM Customization and Beyond
Optimize Your CRM Customization and BeyondBoundify
 
EPC Contractors aspects Presentation.pdf
EPC Contractors  aspects Presentation.pdfEPC Contractors  aspects Presentation.pdf
EPC Contractors aspects Presentation.pdfGiuseppe Tommasone
 
NewBase 14 March 2024 Energy News issue - 1707 by Khaled Al Awadi_compress...
NewBase  14 March  2024  Energy News issue - 1707 by Khaled Al Awadi_compress...NewBase  14 March  2024  Energy News issue - 1707 by Khaled Al Awadi_compress...
NewBase 14 March 2024 Energy News issue - 1707 by Khaled Al Awadi_compress...Khaled Al Awadi
 
Meet Raj Shamani: A Trailblazing Entrepreneur
Meet Raj Shamani: A Trailblazing EntrepreneurMeet Raj Shamani: A Trailblazing Entrepreneur
Meet Raj Shamani: A Trailblazing Entrepreneurramya202104
 
pitchdeck ORPC 2019 data info turine.pdf
pitchdeck ORPC 2019 data info turine.pdfpitchdeck ORPC 2019 data info turine.pdf
pitchdeck ORPC 2019 data info turine.pdflebob12
 
Shopclues: Failure & Solutions in Business Model
Shopclues: Failure & Solutions in Business ModelShopclues: Failure & Solutions in Business Model
Shopclues: Failure & Solutions in Business ModelBhaviniSharma12
 
Mist Cooling & Fogging System Company in Saudi Arabia
Mist Cooling & Fogging System Company in Saudi ArabiaMist Cooling & Fogging System Company in Saudi Arabia
Mist Cooling & Fogging System Company in Saudi Arabiaopstechsanjanasingh
 
Green Innovations: Wristbands Ireland's Eco-Friendly Products
Green Innovations: Wristbands Ireland's Eco-Friendly ProductsGreen Innovations: Wristbands Ireland's Eco-Friendly Products
Green Innovations: Wristbands Ireland's Eco-Friendly ProductsWristbands Ireland
 
Business Models and Business Model Innovation
Business Models and Business Model InnovationBusiness Models and Business Model Innovation
Business Models and Business Model InnovationMichal Hron
 
Project Work on Consumer Behavior in Fast Food Restaurants. Their behavior to...
Project Work on Consumer Behavior in Fast Food Restaurants. Their behavior to...Project Work on Consumer Behavior in Fast Food Restaurants. Their behavior to...
Project Work on Consumer Behavior in Fast Food Restaurants. Their behavior to...BilalAhmed717
 
The Smart Bridge Interview now Veranda Learning
The Smart Bridge Interview now Veranda LearningThe Smart Bridge Interview now Veranda Learning
The Smart Bridge Interview now Veranda LearningNaval Singh
 

Último (20)

WAM Corporate Presentation Mar 12 2024.pdf
WAM Corporate Presentation Mar 12 2024.pdfWAM Corporate Presentation Mar 12 2024.pdf
WAM Corporate Presentation Mar 12 2024.pdf
 
10 Tips for Great Teams CSUN Conference 2024
10 Tips for Great Teams CSUN Conference 202410 Tips for Great Teams CSUN Conference 2024
10 Tips for Great Teams CSUN Conference 2024
 
Record of Module Forensic photography in
Record of Module Forensic photography inRecord of Module Forensic photography in
Record of Module Forensic photography in
 
The Vietnam Believer_Newsletter_Vol.001_Mar12 2024
The Vietnam Believer_Newsletter_Vol.001_Mar12 2024The Vietnam Believer_Newsletter_Vol.001_Mar12 2024
The Vietnam Believer_Newsletter_Vol.001_Mar12 2024
 
L-1 VISA Business (Plan Sample) - Plan Writers
L-1 VISA Business (Plan Sample) - Plan WritersL-1 VISA Business (Plan Sample) - Plan Writers
L-1 VISA Business (Plan Sample) - Plan Writers
 
0311 National Accounts Online Giving Trends.pdf
0311 National Accounts Online Giving Trends.pdf0311 National Accounts Online Giving Trends.pdf
0311 National Accounts Online Giving Trends.pdf
 
Benihana of Tokyo case study11111111.pdf
Benihana of Tokyo case study11111111.pdfBenihana of Tokyo case study11111111.pdf
Benihana of Tokyo case study11111111.pdf
 
PHX Corporate Presentation March 2024 Final
PHX Corporate Presentation March 2024 FinalPHX Corporate Presentation March 2024 Final
PHX Corporate Presentation March 2024 Final
 
How The Hustle Milestone Referral Program Got 300K Subscribers
How The Hustle Milestone Referral Program Got 300K SubscribersHow The Hustle Milestone Referral Program Got 300K Subscribers
How The Hustle Milestone Referral Program Got 300K Subscribers
 
Optimize Your CRM Customization and Beyond
Optimize Your CRM Customization and BeyondOptimize Your CRM Customization and Beyond
Optimize Your CRM Customization and Beyond
 
EPC Contractors aspects Presentation.pdf
EPC Contractors  aspects Presentation.pdfEPC Contractors  aspects Presentation.pdf
EPC Contractors aspects Presentation.pdf
 
NewBase 14 March 2024 Energy News issue - 1707 by Khaled Al Awadi_compress...
NewBase  14 March  2024  Energy News issue - 1707 by Khaled Al Awadi_compress...NewBase  14 March  2024  Energy News issue - 1707 by Khaled Al Awadi_compress...
NewBase 14 March 2024 Energy News issue - 1707 by Khaled Al Awadi_compress...
 
Meet Raj Shamani: A Trailblazing Entrepreneur
Meet Raj Shamani: A Trailblazing EntrepreneurMeet Raj Shamani: A Trailblazing Entrepreneur
Meet Raj Shamani: A Trailblazing Entrepreneur
 
pitchdeck ORPC 2019 data info turine.pdf
pitchdeck ORPC 2019 data info turine.pdfpitchdeck ORPC 2019 data info turine.pdf
pitchdeck ORPC 2019 data info turine.pdf
 
Shopclues: Failure & Solutions in Business Model
Shopclues: Failure & Solutions in Business ModelShopclues: Failure & Solutions in Business Model
Shopclues: Failure & Solutions in Business Model
 
Mist Cooling & Fogging System Company in Saudi Arabia
Mist Cooling & Fogging System Company in Saudi ArabiaMist Cooling & Fogging System Company in Saudi Arabia
Mist Cooling & Fogging System Company in Saudi Arabia
 
Green Innovations: Wristbands Ireland's Eco-Friendly Products
Green Innovations: Wristbands Ireland's Eco-Friendly ProductsGreen Innovations: Wristbands Ireland's Eco-Friendly Products
Green Innovations: Wristbands Ireland's Eco-Friendly Products
 
Business Models and Business Model Innovation
Business Models and Business Model InnovationBusiness Models and Business Model Innovation
Business Models and Business Model Innovation
 
Project Work on Consumer Behavior in Fast Food Restaurants. Their behavior to...
Project Work on Consumer Behavior in Fast Food Restaurants. Their behavior to...Project Work on Consumer Behavior in Fast Food Restaurants. Their behavior to...
Project Work on Consumer Behavior in Fast Food Restaurants. Their behavior to...
 
The Smart Bridge Interview now Veranda Learning
The Smart Bridge Interview now Veranda LearningThe Smart Bridge Interview now Veranda Learning
The Smart Bridge Interview now Veranda Learning
 

Fundstrat Bitcoin & Blockchain presentation for Upfront Summit

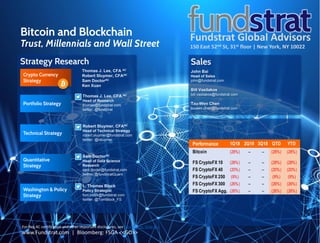
  • 1. Fundstrat Global Advisors 150 East 52nd St, 31st floor | New York, NY 10022 Bitcoin and Blockchain Trust, Millennials and Wall Street For Reg AC certification and other important disclosures, see Disclosures, Slide 54. Thomas J. Lee, CFA AC Head of Research thomas@fundstrat.com twitter: @fundstrat Robert Sluymer, CFAAC Head of Technical Strategy robert.sluymer@fundstrat.com twitter: @rsluymer Sam DoctorAC Head of Data Science Research sam.doctor@fundstrat.com twitter: @fundstratQuant L. Thomas Block Policy Strategist tom.block@fundstrat.com twitter: @TomBlock_FS Strategy Research Portfolio Strategy Quantitative Strategy Technical Strategy Washington & Policy Strategy Sales John Bai Head of Sales john@fundstrat.com Bill Vasilakos bill.vasilakos@fundstrat.com Tzu-Wen Chen tzuwen.chen@fundstrat.com Thomas J. Lee, CFA AC Robert Sluymer, CFAAC Sam DoctorAC Ken Xuan www.Fundstrat.com | Bloomberg: FSGA <<GO>> Crypto Currency Strategy Performance 1Q18 2Q18 3Q18 QTD YTD Bitcoin (28%) – – (28%) (28%) FS CryptoFX 10 (28%) – – (28%) (28%) FS CryptoFX 40 (20%) – – (20%) (20%) FS CryptoFX 250 (9%) – – (9%) (9%) FS CryptoFX 300 (26%) – – (26%) (26%) FS CryptoFX Agg. (26%) – – (26%) (26%)
  • 2. Slide 2 This page intentionally left blank
  • 3. Slide 3 Overview Digital Trust Millennials driving change Crypto is an asset class Why Wall Street will care
  • 4. Slide 4 Figure: Trust in U.S. Government at 60-year lows % who trust the US government in Washington always or most of the time Trust in U.S. government at 60-year lows… Source: Pew Research Center. Fundstrat, Bloomberg
  • 5. Slide 5 Figure: Few countries see their citizens trust their government Question is what % “Trust the national government to do what is right for our country” Outside the US, trust in governments is even worse… Source: Fundstrat, Bloomberg U.S. Few countries score better than the U.S., in terms of trust by their citizens... …Note the prevalence of Asian and Latin American nations with low trust ratings…
  • 6. Slide 6 Blockchain and bitcoin growing faster outside the US Bitcoin and blockchain are attractive outside the US because of the inherent structures of those regions. • Regions with unstable financial systems or governance make bitcoin more attractive. • Regions with currency controls or strict regulations. • Regions with uncertain economic or financial outlook. • Hence, we see bitcoin and blockchain adoption as a global story.
  • 7. Slide 7 Earlier in 2016, Facebook IQ, a team of researchers, scientists and analysts funded and supported by Facebook Inc., published a white paper entitled “Millennials + money: The unfiltered journey” to evaluate the beliefs and thoughts of today’s youth on traditional banking and financial systems. The paper found that 92 percent of millennials firmly expressed their distrust of banks. 92 Percent of Millennials Don’t Trust Banks
  • 8. Slide 8 Blockchain enables digital money to exist with trust… Paper money Credit card / Electronic Digital money Blockchain Double spend… Fraud… Printing press… 51% protection…
  • 9. Slide 9 Figure: Examples of fractionalization to digital asset tokenization Not a complete list Asset tokenization is an evolution of fractionalization…. Source: Fundstrat, Bloomberg 2008: Airbnb Brian Chesky and Joe Gebbia came up with the idea of putting an air mattress in their living room and turning it into a bed and breakfast. 2009: Uber Founded ias UberCab by Garrett Camp, the cofounder of StumbleUpon, and Travis Kalanick. 2009: Kickstarter Kickstarter launched on April 28, 2009, by Perry Chen, Yancey Strickler, and Charles Adler. 1972: Frequent Flyer Miles the very first modern frequent-flyer program was created in 1972 by Western Direct Marketing, for United Airlines. 1970: Mortgage Securitization The U.S. Department of Housing and Urban Development created the first mortgage-backed security. Ginnie Mae mortgage loans. 1969:Time-shares The first non-hotel timeshare in the US was the Kaua`i Kailani, started in Kauai, Hawaii in 1969 by the people who later founded Vacation Internationale. 1987: Netjets fractional jet ownership In 1987, the NetJets program was officially announced becoming the first fractional aircraft ownership format in history. 2017: Venezuelan Oil Venezuela plans to issue a crypto currency backed by oil
  • 10. Slide 10 Figure: Illustrative example of a token for a social media company Simply a concept, please do not judge this to be a business plan Would Facebook be an ICO today? Source: Fundstrat, Bloomberg Customer Operations Capital Structure Posts engaging content user Adds other users Speculate on user growth Equity (FB owns 33% tokens) Speculate on monetization token
  • 11. Slide 11 Figure: Illustrative example of a token for a digital based business Simply a concept, please do not judge this to be a business plan Should Amazon issue a token? Source: Fundstrat, Bloomberg Customer Operations Capital Structure Purchases goods customer Writes engaging reviews Speculate on user growth Equity (AMZN owns 33% tokens) Speculate on spending token
  • 12. Slide 12 Risks • Mining conglomerates becomes too powerful and essentially takeover the blockchain. • Millennials decide they like gold and allocate away from risky assets. • A major blockchain is hacked by a nation-state. • Governments decide they have to destroy blockchain. • Citizens decide they trust governments and banks. • Quantum computers hack encryption. • Humor: A crypto-expose is featured on 60 minutes
  • 13. Slide 13 Overview Digital Trust Millennials driving change Crypto is an asset class Why Wall Street will care
  • 14. Slide 14 Figure: Comparative size of generations Population in millions Millennials are largest population cohort ever Source: Fundstrat, Census Bureau. Note, the population of each cohort exceeds the total births due to immigration. 43.2 44.1 79.5 65.8 95.8 Peak size of generation (includes immigration)Generation Year of peak Peak size As % Pop # in cohort As % Pop Avg age Greatest Generation 1910 1927 1930 43.2 35% 2.6 1% 92.9 Silent Generation 1928 1945 1974 44.1 21% 25.8 8% 78.5 Baby Boomers 1946 1964 1999 79.5 28% 73.8 23% 61.3 GenX 1965 1980 2018 65.8 20% 65.8 20% 44.5 Millenials 1981 2000 2038 95.8 25% 89.2 27% 26.5 Years of birth Statistics @ 2017 Generation Year of peak Peak size As % Pop # in cohort As % Pop Avg age eatest Generation 1910 1927 1930 43.2 35% 2.6 1% 92.9 ent Generation 1928 1945 1974 44.1 21% 25.8 8% 78.5 by Boomers 1946 1964 1999 79.5 28% 73.8 23% 61.3 enX 1965 1980 2018 65.8 20% 65.8 20% 44.5 llenials 1981 2000 2038 95.8 25% 89.2 27% 26.5 Years of birth Statistics @ 2017 Greatest Generation Silent Generation Baby Boomers Generation X Millennials
  • 15. Slide 15 Figure: What did each generation look like in their 20s Fundsdtrat and public information Demographics: Looking at the world through the eyes of a millennial… Source: Fundstrat, Bloomberg Baby Boomers Generation X Millennials 1980 1990 2000 2010 2020
  • 16. Slide 16 Each generation sees innovations… its mostly digital today Source: Fundstrat Figure: Innovations seen when each generation was in their 20s General sources. Wired magazine. Each generation is also characterized by innovations that differentiate that generation from prior generations. • As shown below, what differentiates the millennial experience (in their 20s) is the growth of social media and digital businesses. Notably, we believe blockchain is the newest innovation. Baby Boomers in their 20s 1970s-1980s GenX in their 20s 1990s-2000s Millennials in their 20s 2000s-now Woman entering workforce Mail order business PCs/Apple Microsoft/GUIs GPS Game consoles Mobile phones Laserdisc/CDs email WWW/ e-commerce Digital Cellular Mobile email Mobile data Text messaging Google Paypal Video Games Digital photography MP3 Facebook Uber Airbnb Instagram Kickstarter Digital video streaming Blockchain/Bitcoin Electric cars Online dating Disruptive and misunderstood by prior generation Disruptive and misunderstood by prior generation
  • 17. Slide 17 Figure: Topix vs S&P 500 Boomers: By 1975, many would have said Japan stock bubble peaked… Source: Fundstrat, Bloomberg Baby Boomers 40X rise from 1950 to 1972
  • 18. Slide 18 Figure: Topix vs S&P 500 Boomers: Good thing “bosom buddies” didn’t listen to bubble talk… Source: Fundstrat, Bloomberg Baby Boomers 400X rise from 1950 to 1990 40X rise from 1950 to 1972
  • 19. Source: Fundstrat, Bloomberg, Updata Slide 19 Figure: Life cycle of Millennial spending and income Survey of Consumer Finance for 2017 “real income” levels (born between 1981-2000) Source: Fundstrat, Bloomberg, Census Bureau Millennials average age is 26.5… still early in life cycle The oldest millennials are 36 but the average age is 26.5. As shown below, this means the peak of millennials are driving the automobile market but just beginning to impact the housing market. And early in the investing market. • As the following slides show, millennials are now the most important cohort to follow for several key segments. $15,080 $21,684 $27,924 $40,456 $50,440 $49,556 $51,324 $48,932 $10,000 $15,000 $20,000 $25,000 $30,000 $35,000 $40,000 $45,000 $50,000 $55,000 10 13 16 19 22 25 28 31 34 37 40 43 46 49 52 55 58 61 64 67 Averageannualearnings Age of Millennial Age 21-35 Automobile + Drinking age Age 25-45 Home purchasing Age 30-60 Prime Income years 2001 2004 2007 2010 2013 2016 2019 2022 2025 2028 2031 2034 2037 2040 2043 2046 2049 2052 2055 2058 Millennials Average Age today
  • 20. Source: Fundstrat, Bloomberg, Updata Slide 20 Figure: Composition of Generations by age group Census bureau Source: Fundstrat, Bloomberg, Census bureau Millennials maturing autos, peak homebuying and early prime income To highlight the life cycle of various generations, we have highlighted population distribution and shown the various generations and their respective distribution. Additionally, we shaded the various life cycle behaviors (auto buying, etc.). • Millennials are now dominating Automobile purchasing, entering homebuying and beginning to generate prime income. 8.9 22.1 20.1 16.9 5.8 2017 12.6 19.7 21.0 12.6 2017 12.8 22.2 23.5 22.0 8.7 2017 20.2 20.3 20.7 12.6 2017 20.2 20.3 20.7 21.1 22.2 23.5 22.0 21.3 19.7 21.0 21.4 22.1 20.1 16.9 12.9 8.8 6.0 3.9 1.9 0.6 Age 0 ~ 4 Age 5 ~ 9 Age 10 ~ 14 Age 15 ~ 19 Age 20 ~ 24 Age 25 ~ 29 Age 30 ~ 34 Age 35 ~ 39 Age 40 ~ 44 Age 45 ~ 49 Age 50 ~ 54 Age 55 ~ 59 Age 60 ~ 64 Age 65 ~ 69 Age 70 ~ 74 Age 75 ~ 79 Age 80 ~ 84 Age 85 ~ 89 Age 90 ~ 94 Age 95 ~ 99 Age 100 ~ 104 2017 GenerationZBoomers GenX Millennials 1st time Car buyer (21-35) 1st time homebuyer (25-49) Prime income (30-64) Retirement years (65+) Peak per capita Healthcare costs (75+)
  • 21. Source: Fundstrat, Bloomberg, Updata Slide 21 Source: Fundstrat, Bloomberg, Factset Housing follow generations and implies peak starts 2029 or so… We believe the prime market for homebuyers is age 25-45 and as shown below, this cohort size seems to explain housing cycles. • If precedent generations are a template, housing starts should rise through 2029 towards 2.5 million starts. 1973 1989 2010 2026 1.0 11.0 21.0 31.0 41.0 51.0 61.0 71.0 81.0 91.0 101.0 1960 1961 1962 1963 1964 1965 1966 1967 1968 1969 1970 1971 1972 1973 1974 1975 1976 1977 1978 1979 1980 1981 1982 1983 1984 1985 1986 1987 1988 1989 1990 1991 1992 1993 1994 1995 1996 1997 1998 1999 2000 2001 2002 2003 2004 2005 2006 2007 2008 2009 2010 2011 2012 2013 2014 2015 2016 2017 2018 2019 2020 2021 2022 2023 2024 2025 2026 2027 2028 2029 2030 2031 2032 2033 2034 2035 2036 2037 2038 2039 2040 #age25-45(millions) Silent Generation: 1929-1945 Baby boomers: 1946-1964 GenX: 1965-1980 Millennials: 1981-2000 Millennials only now starting to buy homes and should boost the market past 2026… BULLISH Housing SAAR Figure: Housing starts and comparative size of generations age 25-45. Starts reported in thousands. Since 1960
  • 22. Source: Fundstrat, Bloomberg, Updata Slide 22 Figure: Composition of Generations by age group Census bureau Source: Fundstrat, Bloomberg, Census bureau Millennials are just entering their prime income years Of the 96 million millennials, about 30 million are just entering their prime income years. • Thus, the key question from an investment perspective is how the millennials will impact the investment market in the coming decades. After all, each generation seemed to prefer a different investment product. 8.9 22.1 20.1 16.9 5.8 2017 12.6 19.7 21.0 12.6 2017 12.8 22.2 23.5 22.0 8.7 2017 20.2 20.3 20.7 12.6 2017 20.2 20.3 20.7 21.1 22.2 23.5 22.0 21.3 19.7 21.0 21.4 22.1 20.1 16.9 12.9 8.8 6.0 3.9 1.9 0.6 Age 0 ~ 4 Age 5 ~ 9 Age 10 ~ 14 Age 15 ~ 19 Age 20 ~ 24 Age 25 ~ 29 Age 30 ~ 34 Age 35 ~ 39 Age 40 ~ 44 Age 45 ~ 49 Age 50 ~ 54 Age 55 ~ 59 Age 60 ~ 64 Age 65 ~ 69 Age 70 ~ 74 Age 75 ~ 79 Age 80 ~ 84 Age 85 ~ 89 Age 90 ~ 94 Age 95 ~ 99 Age 100 ~ 104 2017 GenerationZBoomers GenX Millennials Prime income (30-64) About 30 million of the 96 million millennials are entering their prime income years… Hence, they will be sizable contributors to the change in the investing landscape…
  • 23. Slide 23 Silent Generation bought gold… Millennials aren’t buying Gold… Gold As shown below, the Silent Generation was in their prime income years. The USD moved off the gold standard in 1971. • As shown, this surge in gold and coincident generational prime income of “Silent Generation” means this generation is the key cohort of “gold bugs”. Figure: Comparative Gold prices and the prime income years of various generations Census bureau USD off gold standard August 15, 1971 China demand + Financial crisis 1962 1980 1999 2018 2036 1.0 11.0 21.0 31.0 41.0 51.0 61.0 71.0 81.0 91.0 101.0 1930 1933 1936 1939 1942 1945 1948 1951 1954 1957 1960 1963 1966 1969 1972 1975 1978 1981 1984 1987 1990 1993 1996 1999 2002 2005 2008 2011 2014 2017 2020 2023 2026 2029 2032 2035 2038 2041 2044 2047 2050 2053 2056 2059 #Americans Prime income years (age 35-60)--Greatest generation (1910-1927) Prime income years (age 35-60)--Silent Generation (1928-1945) Prime income years (age 35-60)--Boomers (1946-1964) Prime income years (age 35-60)--GenX (1965-1980) Prime income years (age 35-60)--Millenials (1981-2000)
  • 24. 1962 1980 1999 2018 2036 1.0 11.0 21.0 31.0 41.0 51.0 61.0 71.0 81.0 91.0 101.0 1930 1933 1936 1939 1942 1945 1948 1951 1954 1957 1960 1963 1966 1969 1972 1975 1978 1981 1984 1987 1990 1993 1996 1999 2002 2005 2008 2011 2014 2017 2020 2023 2026 2029 2032 2035 2038 2041 2044 2047 2050 2053 2056 2059 #Americans Prime income years (age 35-60)--Greatest generation (1910-1927) Prime income years (age 35-60)--Silent Generation (1928-1945) Prime income years (age 35-60)--Boomers (1946-1964) Prime income years (age 35-60)--GenX (1965-1980) Prime income years (age 35-60)--Millenials (1981-2000) Slide 24 Boomers bought equities… millennials like “Growth stocks” S&P 500 The Baby boomers prime income years stretched from 1982 and peaked in 1999. • Baby boomers prime income years stretched from 1982 and peaked in 1999, coinciding with equity market peak. Boomers prime income years 1982-1999 Figure: Comparative S&P 500 prices and the prime income years of various generations Census bureau We believe Millennials like equities, and seems like they favor “Growth” stocks and digital-based companies…
  • 25. 1 11 21 31 41 51 61 71 81 91 1930 1933 1936 1939 1942 1945 1948 1951 1954 1957 1960 1963 1966 1969 1972 1975 1978 1981 1984 1987 1990 1993 1996 1999 2002 2005 2008 2011 2014 2017 2020 2023 2026 2029 2032 2035 2038 2041 2044 2047 2050 2053 2056 2059 #ofAmericans Prime income years (age 35-60)-- Silent Generation Prime income years (age 35-60)-- Boomer Prime income years (age 35-60)-- Gen-X Prime income years (age 35-60)-- Millenial Slide 25 GenX really liked Hedge funds… The prime years for hedge funds (based on number) was 1990s to 2007. Since then, the number of funds has been declining. • The hedge fund industry is evolving and those with deep fundamental or a unique advantage will likely appeal to millennials.. 0 500 1,000 1,500 2,000 2,500 3,000 3,500 4,000 Dec'45 Jul'48 Feb'51 Sep'53 Apr'56 Nov'58 Jun'61 Jan'64 Aug'66 Mar'69 Oct'71 May'74 Dec'76 Jul'79 Feb'82 Sep'84 Apr'87 Nov'89 Jun'92 Jan'95 Aug'97 Mar'00 Oct'02 May'05 Dec'07 Jul'10 Feb'13 Sep'15 Apr'18 # Hedge funds (worldwide) Figure: Comparative number of Hedge funds and the prime income years of various generations Morningstar Not entirely clear… Prime years were 1999 to 2007, coinciding with GenX
  • 26. 0.01 0.1 1 10 100 1000 10000 100000 1000000 10000000 2010 2012 2014 2016 1980 1999 2018 2036 1.0 11.0 21.0 31.0 41.0 51.0 61.0 71.0 81.0 91.0 101.0 #Americans Prime income years (age 35-60)--Greatest generation (1910-1927) Prime income years (age 35-60)--Silent Generation (1928-1945) Prime income years (age 35-60)--Boomers (1946-1964) Prime income years (age 35-60)--GenX (1965-1980) Slide 26 Millennials LOVE Bitcoin and Blockchain Figure: Fundstrat FS CryptoFX 300 Index Morningstar $100k $1M $10M
  • 27. Slide 27 Overview Digital Trust Millennials driving change Crypto is an asset class Why Wall Street will care
  • 28. Slide 28 Regulation: St Louis Fed is constructive on bitcoin and blockchain… Source: https://files.stlouisfed.org/files/htdocs/publications/review/2018/01/10/a-short-introduction-to-the-world-of-cryptocurrencies.pdf Figure: Abstract St Louis Fed Published January 10, 2018 The St Louis Fed even sees bitcoin as a useful crypto-currency
  • 29. Textbook 30-yrs ago… Reality today… IPOs Only profitable Technology companies go public… % profitable at IPO 1980-1995 average 92% 1999-2000 2013-2017 average 20% Private Equity Public equity is larger than the private market… # private equity companies as percent of Wilshire 5000 2000: 32% 2016: 84% Bonds Bonds are income instruments… % bonds with negative rates (G7, ex-US) 2000: 0% 2017: 80% Central Banks Central banks only own bonds and risk-free assets… BoJ ownership of Topix 2002: 0% 2015: 2.5% Slide 29 Finance 101 books 30-yrs ago not true anymore… will evolve for crypto… Figure: Comparative changes in approach to valuations Fundstrat estimates. We believe crypto and blockchain valuations will lead to an evolution in thinking about market valuations for tokens. While these are not traditional equities, there are elements available to create a valuation approach. • Investors seem to be dismissive of the value of tokens, because of the apparent blurriness of token governance versus equity (like a tracking stock) and the unclear position within a capital structure. • But as highlighted below, while fundamental valuation remains central to any approach, markets have evolved their approach to valuations of assets. https://site.warrington.ufl.edu/ritter/files/2018/01/IPOs2017Statistics-1.pdf https://www.toptal.com/finance/private-equity-consultants/private-equity-industry
  • 30. Slide 30 Digital Store of Value addresses $280T market… 20-yr CAGR Value ($ billions) % Total Gold Estimate Fundstrat 5.0 $9,000 3 Collectible Art https://www2.deloitte.com/lu/en/pages/ art-finance/articles/art-finance- report.html 3.0 $17,000 6 Real Estate http://www.mcguire.com/blog/2017/04/ savills-world-worth/ 5.0 $228,000 82 Government bonds (neg rate) Deutsche Bank -0.5 * $20,000 7 Cars, collectibles Estimate Fundstrat 7.0 $5,000 2 Global stores of value $280,000 100 Bitcoin n/a $200 0.1 Figure: Comparative Store of Value $ Billions. % * Average interest rate of negative rate government bonds % % %
  • 31. Slide 31 Figure: Annual World Gold Production Units in metric tons. Thru 2015. From US Geological Survey Gold supply growth is ~3%... Will be higher than bitcoin in a few years… Source: Fundstrat, Bloomberg 3,100 0 500 1,000 1,500 2,000 2,500 3,000 3,500 Jan '21 Sep '32 May '44 Jan '56 Sep '67 May '79 Jan '91 Sep '02 May '14 Annualworldgoldproduction (metrictons,1000kg) 2.7% -6% -4% -2% 0% 2% 4% 6% 8% Jan '21 Sep '32 May '44 Jan '56 Sep '67 May '79 Jan '91 Sep '02 May '14 10-yrCAGRAnnualProduction 10-yr CAGR of Gold production surged to 2.7%... Annual production exceeded 3,100 metric tons Surged in past 7 years.. 100-yr avg: 1.9%
  • 32. Dec '35 $35 Feb '75 $184 Jan '80 $684 Dec '87 $493 Sep '11 $1,789 Jul '17 $1,223 Dec '35 1157% Feb '75 773% Jan '80 1879% Dec '87 817% Sep '11 956% Jul '17 481% 0% 200% 400% 600% 800% 1000% 1200% 1400% 1600% 1800% 2000% Jan '21 Apr '27 Jul '33 Oct '39 Jan '46 Apr '52 Jul '58 Oct '64 Jan '71 Apr '77 Jul '83 Oct '89 Jan '96 Apr '02 Jul '08 Oct '14 Jan '21 Goldoutstandingas% USDincirculation Slide 32 Figure: Gold price and gold value outstanding as % USD in circulation Gold price is shown as $ per troy oz. Ratio of Gold value to USD is percent. Since 1921 Gold a buy when value as % circulation <300%... a sell >750% Source: Fundstrat, Bloomberg Gold Spot price ($/troy oz) Gold overvalued >750% Gold under- valued <300% 1934 Gold Reserve Act passed: Private ownership prohibited 1971 gold standard abandoned: USD no longer pegged to gold
  • 33. Slide 33 Figure: Comparative value of Intangibles as % total EV Based on Bloomberg data Intangibles (including brand) essentially 91% FANG value… Source: Fundstrat, Bloomberg EV Tangible Assets Intangible value estimates Ticker Company Enterprise Value PP&E Prepaid expenses Deferred Tax Assets LT Assets Current Assets ex- Cash Intangible Value Intangible as % EV FB Facebook Inc-A $485,860 $8,591 $1,312 $4,952 $471,005 97% AMZN Amazon.Com Inc $642,703 $29,114 $3,869 $19,800 $589,920 92% AAPL Apple Inc $738,444 $33,783 $8,974 $1,188 $54,464 $640,035 87% NFLX Netflix Inc $97,807 $250 $227 $7,389 $3,987 $85,954 88% NVDA Nvidia Corp $130,831 $521 $62 $1,738 $128,510 98% GOOG Alphabet Inc-Cl C $674,371 $34,234 $1,819 $383 $0 $19,075 $618,860 92% TSLA Tesla Inc $64,871 $5,983 $9,539 $2,867 $46,483 72% FAANNG Composite $2,834,887 $112,476 $1,819 $9,584 $23,359 $106,882 $2,580,767 91% S&P 500 $28,618,706 $4,541,372 $4,556 $359,580 $1,140,730 $3,988,148 $22,017,705 77%
  • 34. Slide 34 Figure: General categories of tokens Per Fundstrat Store of Value still best. Is 2018 the year we see growth in tokenization? Source: Fundstrat, Bloomberg Store of Value Digital Currency Utility Security tokens Purpose Digital Gold Currency Pay for services Fractional exposure A store of value is the function of an asset that can be saved, retrieved and useful when retrieved. More generally, a store of value is anything that retains purchasing power into the future. Digital currencies use encryption to regulate the generation of units of currency and verify the transfer of funds, independently of a central bank. The utility tokens are services or units of services that can be purchased, similar to API keys, used to access the service. These fund projects of shared infrastructure. Tokens are representing shares of a business. The SEC considers these a security and fall under the 1934 Security Exchange Act. Appreciation potential Yes Yes Yes Yes Decentralized or not? Blockchain Blockchain mostly Mixed Mixed Representative Tokens Bitcoin Ethereum classic Ethereum Neo Qtum Bitcoin Cash Zcash Monero Dash Telegram (GRAM) Powerledger SingularityNET FunFair Paragon STEEM KWHcoin Filecoin Tron Tether Basecoin LAToken Goldmint (MNT) Jibrel Networks (JNT)
  • 35. High-net worth families allocate $1.6T to Art… Per PrivateInvestor.com Art cannot be compared to traditional assets such as equities, bonds or even commodities. The access to information is restricted for the layman, liquidity is often constrained, holding costs are comparatively high and even through there are techniques to analyze the market, the value of an artwork is ultimately driven by a large variety of parameters, part of those being extremely difficult to predict. If family offices own about 10%-15% of all collectible art, this implies that the aggregate value of Art as a store of value is $11 to $17 Trillion. http://www.privateartinvestor.com/art-business/art-collecting-as-a-means-to-store-value/ https://www2.deloitte.com/lu/en/pages/art-finance/articles/art-finance-report.html Figure: Estimated Family Office allocation to Art From Deloitte Art Report 2017
  • 36. 3.0% -20% 0% 20% 20-yr CAGR Slide 36 Art has appreciated at 3% gross 20-year CAGR… 0 1 4 16 64 256 1,024 4,096 16,384 1875 1879 1883 1887 1891 1895 1899 1903 1907 1911 1915 1919 1923 1927 1931 1935 1939 1943 1947 1951 1955 1959 1963 1967 1971 1975 1979 1983 1987 1991 1995 1999 2003 2007 2011 2015 2019 2023 2027 2031 2035 2039 Mei Moses/ Artprice.comFigure: Art Price performance since 1875 1875 to 2002 is Mei Moses. From 2002 to now is Artprice.com. 100=1875 Source: Fundstrat, Bloomberg Art has essentially been flat past 20-years… Flat Flat We have shown the price performance of art from 1875 to today, concatenating the Mei Moses art index (acquired by Sotheby’s) with a more modern series developed by artprice.com. • While there was a period of tremendous appreciation from 1950 to 1987, Art since then, has performed a lot less spectacularly—in fact, in the past 20 years, the CAGR was 3%. Art storage has high maintenance cost (see prior page) and there is also survivorship bias (does not track destroyed art)—hence, future durability of Art as a store of value to outperform the last 20-years is not clear.
  • 37. Slide 37 Figure: Key variables in valuing Bitcoin and other cryptocurrencies $ trillions, except bitcoin value Framework for bitcoin: ~$125,000 per unit by 2022 We have created a framework for valuing bitcoin, based on the assumptions outlined below: • In short, we looked at the projected growth of money supply (M0) and a forecast for the ratio of the alternative currencies to M0 (gold historically is the bulk of this value). And then allocated a share to bitcoin. Under this forecast, we see bitcoin rising to $125,000 by 2022. Source: Fundstrat, Bloomberg M0, or cash assets, including currency and is called narrow money Money supply growth Ratio of alternatives, including gold to M0. Ratio alternative currency to M0 Bitcoin share of alternative currency. 5- year projection Bitcoin share of alternative 1. 2. 3.x x = Based on 21mm maximum units (fully diluted) Bitcoin value Value $1.55TCurrent: 487% ~3.5% ~$15,000 $2.2T2022E: 600% ~20.0% ~$125,000 1921-2017 Average: 7.0% 554%
  • 38. Slide 38 Figure: Alt-coins surged since December Based on the liquid universe of alt-coins. 57 in 2014. 250 in 2015. 400 in 2016. >700 in 2017. 2017 was an exceptionally good year for alt-tokens and 2018 so far… Below we have calculated the percentage of alt-tokens that have risen by at least 200% in the past 90-days—and since 2014, this has been a surprisingly cyclical series. • In 2015 and 2016, the peak of the alt-coin rallies was 28% of tokens rising 200% in a rolling 3M period. In 2017, this figure peaked at 81% in mid-2017 and in early-2018, this is hovering at 78% and approaching the 2017 highs. • Not surprisingly, when alt-coins are selling off, this is bullish for bitcoin/ETH. Source: Fundstrat, Bloomberg 28.0% 29.6% 80.6% 77.6% 0% 10% 20% 30% 40% 50% 60% 70% 80% 90% %Coins(liquiduniverse) % of coin with over 200% 90-day trailing return Alt-coin rotation peak Alt-coin rotation peak Alt-coin rotation peak
  • 39. Figure: Correlation Matrix (%) Based on the daily return of last 90 days Source: Coinmarketcap.com, Bloomberg, other sources and Fundstrat. Cross Token Correlation Matrix Slide 39 Bitcoin Ethereum Ripple Litecoin Dash IOTA Monero NEO EthereumClassic Zcash NEM BitConnect Lisk Waves Stratis Steem Ark Bytecoin BasicAttenti... Augur MaidSafeCoin Golem StellarLumens BitShares Komodo Decred Ardor PIVX Factom Veritaseum GameCredits Siacoin Gnosis Iconomi ByteballBytes DigiByte Dogecoin MCAP Status Bancor Verge Syscoin Nxt Edgeless Ubiq NAVCoin Rise Vertcoin FirstBlood Triggers Bitcoin 100 38 22 55 1 25 37 21 28 24 32 92 24 47 41 55 12 59 24 24 28 30 21 30 47 22 44 16 16 33 26 24 24 23 29 29 51 37 28 35 39 26 54 7 13 33 21 10 17 2 Ethereum 100 59 71 35 33 57 52 66 64 75 43 63 59 60 40 48 49 45 72 67 57 29 51 53 55 46 52 68 35 53 53 67 68 45 60 52 20 45 93 41 40 37 26 45 38 42 34 48 23 Ripple 100 60 14 38 49 36 59 50 56 23 44 42 45 19 28 31 43 48 52 42 32 42 36 22 40 48 52 24 36 37 37 42 24 46 45 12 47 53 20 35 20 20 46 12 19 20 34 11 Litecoin 100 27 37 54 41 63 56 69 57 60 50 50 34 41 54 56 60 60 51 30 50 50 37 54 50 59 32 53 51 46 48 44 56 63 25 55 65 30 56 40 27 50 39 29 26 45 22 Dash 100 12 35 21 4 48 26 (5) 25 9 14 9 1 4 9 29 32 20 1 17 9 21 8 10 20 10 18 11 4 25 14 6 10 1 14 25 (2) 21 7 13 19 9 10 9 8 7 IOTA 100 62 28 50 42 54 18 55 50 57 32 42 40 45 44 51 47 44 54 41 19 41 43 48 38 33 50 34 41 31 59 46 34 42 39 30 30 26 30 57 38 37 13 46 14 Monero 100 39 59 57 65 33 52 59 56 40 41 51 47 56 70 49 42 45 39 33 44 41 63 42 34 41 42 53 33 43 57 14 42 55 25 46 37 23 56 46 30 29 38 10 NEO 100 37 48 51 26 50 49 51 32 44 32 38 49 53 45 28 47 47 42 49 39 48 27 56 49 38 36 47 55 41 12 33 53 43 39 27 39 49 36 38 25 51 15 Ethereum Classic 100 50 61 29 48 46 58 32 40 37 38 56 51 50 37 49 40 36 38 52 65 27 41 43 49 54 27 55 47 7 53 61 32 32 30 20 46 26 28 20 47 16 Zcash 100 57 26 51 47 46 26 36 32 39 62 51 53 34 49 35 35 40 41 57 19 41 39 52 54 43 49 45 23 42 56 25 30 23 23 51 30 22 18 44 14 NEM 100 36 75 67 64 35 57 52 63 73 77 67 47 53 58 45 52 65 73 45 62 65 59 60 47 73 57 18 59 73 43 59 37 33 70 52 38 49 62 24 BitConnect 100 33 48 40 56 20 61 34 31 31 33 20 30 51 27 46 18 22 34 30 26 32 28 37 34 48 34 31 44 39 31 47 16 15 36 24 15 24 4 Lisk 100 62 57 29 60 41 57 57 69 60 34 47 52 39 43 57 67 46 68 51 51 52 46 58 45 28 49 66 43 52 24 38 62 55 40 41 65 33 Waves 100 65 44 53 48 49 49 59 49 48 44 55 38 50 46 56 41 53 49 46 57 51 64 51 24 45 60 50 48 47 27 52 54 29 40 49 23 Stratis 100 61 41 53 40 59 67 60 42 49 65 56 47 55 59 35 58 59 47 52 48 65 53 27 53 60 47 50 49 37 54 44 33 28 54 34 Steem 100 25 59 24 39 38 34 16 29 63 38 49 27 32 41 29 44 26 32 27 33 39 19 25 43 46 28 62 29 24 30 19 21 29 6 Ark 100 42 47 52 49 41 28 37 44 42 49 54 62 38 38 49 43 43 44 57 32 13 32 52 42 44 28 42 48 42 39 28 50 30 Bytecoin 100 39 52 55 45 32 46 55 40 51 35 47 48 41 56 38 39 49 50 70 31 44 59 38 36 49 31 38 42 43 26 46 17 Basic Attenti... 100 49 57 58 41 37 54 42 52 48 46 50 49 49 46 41 41 57 48 18 38 49 38 59 24 53 66 49 37 33 51 25 Augur 100 69 62 30 46 48 52 55 61 68 30 51 66 64 65 52 63 56 24 46 72 38 44 41 40 55 36 47 32 58 22 MaidSafeCoin 100 67 42 55 52 48 47 61 60 42 59 55 51 49 48 61 52 22 56 69 44 56 33 40 68 50 55 42 58 18 Golem 100 40 48 56 51 52 48 49 34 52 60 53 48 64 62 48 27 59 56 38 50 35 39 72 42 48 35 61 22 Stellar Lumens 100 45 23 20 29 31 37 21 26 37 37 28 25 50 39 17 36 30 20 37 26 14 39 20 13 33 33 7 BitShares 100 41 23 44 27 49 19 39 54 36 37 45 62 52 15 56 52 43 25 38 17 50 28 54 17 53 27 Komodo 100 52 60 45 51 42 55 53 36 37 47 54 50 37 44 55 55 44 49 42 52 54 35 23 55 22 Decred 100 35 39 51 28 43 43 44 47 46 47 38 24 25 59 42 38 24 53 44 38 34 32 39 41 Ardor 100 48 38 33 39 56 37 33 47 50 47 24 45 44 39 48 62 33 53 38 36 25 42 16 PIVX 100 54 37 50 49 41 46 30 46 40 13 49 51 36 47 32 38 55 38 28 42 48 24 Factom 100 32 57 60 51 69 40 65 55 17 46 70 41 44 24 35 58 46 36 35 54 29 Veritaseum 100 29 23 37 28 21 29 27 22 18 40 28 30 25 28 37 39 27 28 36 12 GameCredits 100 53 38 43 36 55 57 25 50 57 45 47 25 33 51 41 36 29 57 33 Siacoin 100 40 50 48 73 63 24 51 54 43 40 44 43 49 29 44 23 60 22 Gnosis 100 55 38 57 37 21 35 70 28 27 29 30 48 40 29 31 44 11 Iconomi 100 38 54 50 15 42 67 35 37 21 29 43 32 32 27 42 21 Byteball Bytes 100 59 45 17 34 50 29 36 19 36 50 41 40 21 52 21 DigiByte 100 58 26 53 63 52 46 36 43 57 43 48 32 65 25 Dogecoin 100 23 47 53 33 41 35 28 45 30 36 16 45 15 MCAP 100 23 20 19 6 23 22 18 18 18 5 15 10 Status 100 46 36 33 38 21 58 32 42 34 52 25 Bancor 100 46 39 31 33 48 44 51 38 52 24 Verge 100 23 38 29 40 43 55 33 42 29 Syscoin 100 30 39 49 42 23 43 42 24 Nxt 100 21 26 27 18 18 27 13 Edgeless 100 40 42 37 19 48 40 Ubiq 100 53 39 41 55 28 NAV Coin 100 27 39 45 34 Rise 100 18 45 29 Vertcoin 100 32 15 FirstBlood 100 49 Triggers 100
  • 40. How to read this: the “Highest/Lowest Win Ratio” based on past 90-day daily return. High Win Ratio means the cryptocurrency more positive return days How to read this: Upside less Downside vol is calculated by using the volatility of daily returns on up days minus the volatility of daily returns on down days over the past 90 days. Source: Coinmarketcap.com, Bloomberg, other sources and Fundstrat. FS CryptoFX 10 and 40 members ranked by Win Ratio and Upside less Downside Vol Rank Win Ratio 90 Day % Rank Win Ratio 90 Day % 1 Bitcoin 61 254 26 Ethereum Classic 49 73 2 BitConnect 57 194 27 Veritaseum 48 49 3 FirstBlood 57 (2) 28 Monero 48 116 4 Dogecoin 57 54 29 Nxt 48 596 5 Ardor 56 274 30 Siacoin 48 32 6 Litecoin 56 50 31 Decred 47 53 7 IOTA 53 638 32 Bancor 47 7 8 Komodo 53 0 33 PIVX 47 26 9 Stratis 53 43 34 Dash 47 122 10 Zcash 52 49 35 NEO 47 46 11 Ripple 52 16 36 GameCredits 47 (3) 12 Bytecoin 52 39 37 Steem 47 23 13 Vertcoin 52 864 38 Basic Attenti... 47 (16) 14 Rise 52 10 39 Ubiq 47 (12) 15 Ethereum 51 53 40 Gnosis 47 (26) 16 Augur 51 18 41 Factom 47 (21) 17 Ark 51 49 42 Byteball Bytes 46 (27) 18 Status 51 75 43 MaidSafeCoin 46 (24) 19 Stellar Lumens 51 657 44 Edgeless 46 73 20 BitShares 51 56 45 MCAP 46 (39) 21 Waves 50 75 46 NEM 44 (13) 22 Verge 50 17 47 Golem 44 (22) 23 DigiByte 50 (15) 48 Syscoin 44 24 24 NAV Coin 50 18 49 Iconomi 43 (28) 25 Lisk 49 17 50 Triggers 43 (23) Rank UV less DV 90 Day % Rank UV less DV 90 Day % 1 Triggers 219 (23) 26 Ark 21 49 2 Stellar Lumens 170 657 27 Stratis 20 43 3 MCAP 145 (39) 28 Byteball Bytes 18 (27) 4 IOTA 138 638 29 MaidSafeCoin 17 (24) 5 Nxt 137 596 30 Zcash 17 49 6 NAV Coin 117 18 31 BitConnect 17 194 7 Gnosis 115 (26) 32 GameCredits 17 (3) 8 Syscoin 106 24 33 DigiByte 14 (15) 9 Steem 96 23 34 Bitcoin 14 254 10 Dash 93 122 35 Lisk 13 17 11 Veritaseum 87 49 36 Factom 13 (21) 12 Rise 85 10 37 NEM 10 (13) 13 Vertcoin 76 864 38 Basic Attenti... 10 (16) 14 NEO 75 46 39 BitShares 10 56 15 Decred 70 53 40 FirstBlood 9 (2) 16 Edgeless 58 73 41 Augur 9 18 17 Status 52 75 42 Ethereum 8 53 18 Siacoin 51 32 43 Dogecoin 5 54 19 PIVX 45 26 44 Golem 4 (22) 20 Iconomi 43 (28) 45 Ubiq 3 (12) 21 Ardor 42 274 46 Bancor 1 7 22 Waves 33 75 47 Ripple (2) 16 23 Monero 31 116 48 Bytecoin (7) 39 24 Verge 25 17 49 Komodo (13) 0 25 Ethereum Classic 24 73 50 Litecoin (15) 50 Slide 40 Top 25 Win Ratio UV less DV 90 Day % Bottom 25 Win Ratio UV less DV 90 Day % 1 IOTA 53 138 638 1 Golem 44 4 (22) 2 Stellar Lumens 51 170 657 2 Ubiq 47 3 (12) 3 Rise 52 85 10 3 NEM 44 10 (13) 4 Vertcoin 52 76 864 4 Bancor 47 1 7 5 Ardor 56 42 274 5 Factom 47 13 (21) 6 NAV Coin 50 117 18 6 Basic Attenti... 47 10 (16) 7 BitConnect 57 17 194 7 MaidSafeCoin 46 17 (24) 8 Nxt 48 137 596 8 Byteball Bytes 46 18 (27) 9 Status 51 52 75 9 Iconomi 43 43 (28) 10 Bitcoin 61 14 254 10 GameCredits 47 17 (3) 11 Stratis 53 20 43 11 Bytecoin 52 (7) 39 12 Veritaseum 48 87 49 12 Lisk 49 13 17 13 Zcash 52 17 49 13 Edgeless 46 58 73 14 FirstBlood 57 9 (2) 14 BitShares 51 10 56 15 Waves 50 33 75 15 Ripple 52 (2) 16 16 Ark 51 21 49 16 Ethereum 51 8 53 17 Dash 47 93 122 17 Augur 51 9 18 18 Verge 50 25 17 18 Komodo 53 (13) 0 19 Steem 47 96 23 19 Litecoin 56 (15) 50 20 Decred 47 70 53 20 DigiByte 50 14 (15) 21 Dogecoin 57 5 54 21 Syscoin 44 106 24 22 Gnosis 47 115 (26) 22 PIVX 47 45 26 23 MCAP 46 145 (39) 23 Monero 48 31 116 24 Siacoin 48 51 32 24 Ethereum Classic 49 24 73 25 NEO 47 75 46 25 Triggers 43 219 (23) How to read this: The Leadership Ratio ranks the cryptocurrencies on the combined Win Ratio and Upside less Downside Volatility spread Win Ratio — 90 days Sorted high to low Upside Vol less downside Vol — 90 days Sorted high to low A B Leadership Ratio (avg of A + B) Sorted high to low Rank of A + B
  • 41. Slide 41 Overview Digital Trust Millennials driving change Crypto is an asset class Why Wall Street will care
  • 42. Slide 42 Figure: Comparative Profitability Estimates for Coinbase Profits to be made: Coinbase profitability may exceed ICE in 2018 Source: Fundstrat, Bloomberg Coinbase Intercontinental Exchange (ICE) Est. sales 2017 >$1 billion $4.6 billion Est. profit margin 60% 35% Net profit $600mm $1.6 billion
  • 43. Slide 43 Figure: Market Cap of Country Stock Markets $ Cryptoassets are larger than most country equity markets… Source: Fundstrat, Bloomberg Market Cap Crypto assets $550,000,000,000 Rank Country Name Market Cap 1 United States $27,352,200,720,000 2 China $7,320,738,379,789 3 Euro area $6,217,813,253,466 4 Japan $4,955,299,652,289 5 Hong Kong SAR, China $3,193,235,542,860 6 France $2,156,832,792,355 7 Canada $1,993,522,735,730 8 Germany $1,716,041,505,061 9 South Asia $1,585,359,261,547 10 India $1,566,680,487,701 11 Switzerland $1,403,355,611,193 12 Australia $1,268,493,506,774 13 Korea, Rep. $1,254,541,184,535 14 South Africa $951,320,328,604 15 Netherlands $854,349,119,294 16 Brazil $758,558,918,035 17 Spain $704,551,326,648 18 Singapore $640,427,546,857 19 Russian Federation $622,051,532,645 20 Saudi Arabia $448,831,069,542 21 Thailand $432,956,179,451 22 Indonesia $425,767,769,936 23 Belgium $377,756,548,791 24 Malaysia $359,788,303,781 25 Mexico $350,809,553,624 Ranks 26-100 $2,817,299,785,779 Total $71,728,582,616,286 Crypto assets $550,000,000,000 Almost same size as: Brazil Spain Singapore Russia Larger than: Ireland Spain Israel Greece Turkey Thailand Vietnam
  • 44. Slide 44 Crypto-currencies are simply not correlated to equities, bonds, gold, HF. Bitcoin FS CryptoFX 10 FS CryptoFX 40 FS CryptoFX 250 FS CryptoFX 300 FS CryptoFX Aggregate S&P 500 The US Dollar Index MSCI All World Index Bloomberg Barclays US Agg Bond Index Salient Risk Parity Index Bloomberg Comdty Total Return Index Bloomberg Barclays US Treasury Index Gold Oil Bitcoin 100 91 31 37 88 88 13 14 1 8 2 (17) 9 (9) (11) FS CryptoFX 10 100 54 55 100 100 11 4 5 10 1 (15) 11 (5) (7) FS CryptoFX 40 100 79 62 62 13 (3) 10 9 3 (0) 9 11 5 FS CryptoFX 250 100 62 62 5 (14) 10 16 1 (5) 16 17 (8) FS CryptoFX 300 100 100 12 3 7 11 1 (14) 11 (4) (7) FS CryptoFX Aggregate 100 12 3 7 11 1 (14) 11 (4) (7) S&P 500 100 23 69 (20) 16 (12) (22) (6) 3 The US Dollar Index 100 11 (17) (3) (26) (19) (45) (7) MSCI All World Index 100 (16) 28 (6) (18) 7 11 Bloomberg Barclays US Agg Bond Index 100 65 35 99 50 27 Salient Risk Parity Index 100 71 64 59 53 Bloomberg Comdty Total Return Index 100 35 63 67 Bloomberg Barclays US Treasury Index 100 50 26 Gold 100 27 Oil 100 Figure: FS Crypto FX Indices Correlation Matrix against Major Asset Classes (%) Based on the daily return of last 90 days Take a look at the correlation matrix below. What really stands out is that correlations to other asset classes is low. • Interesting to see the negative correlation to other commodities and perhaps this explains why CTAs and commodity funds seem to be earlier in looking at crypto.
  • 45. 12.4% 6.4% (11.5%) 2.0% (20%) (10%) 0% 10% 20% 30% 90Dcorrelation 6.1% 10.2% 6.4% 8.3% (9.0%) (7.6%) 18.2% 0.7% -20% -15% -10% -5% 0% 5% 10% 15% 20% 25% 30% 90Dcorrelation Slide 45 Crypto correlation to other asset classes is low and falling… Source: Coinmarketcap.com, Bloomberg, other sources and Fundstrat. Figure: 90D Rolling Correlation - Bitcoin & FS CryptoFX 10 Correlation against Major Asset Classes Over last 100 days Bitcoin FS CryptoFX 10 S&P 500 BBG US Agg Bond Idx Gold Salient Risk Parity Idx Bitcoin correlation to other asset classes is declining and continues to be negatively correlated to Gold—not surprising and evidence of cannibalization of demand for gold. Even looking at the top 10 tokens (which includes bitcoin), the correlation to other asset classes is quite low. When looking at rolling correlations of Bitcoin to other asset classes, the correlation is still low.
  • 46. Source: Fundstrat, Bloomberg, Updta $120.68 $128.54 $141.01 $168.89 $90 $180 10/2/2014 11/2/2014 12/2/2014 1/2/2015 2/2/2015 3/2/2015 4/2/2015 5/2/2015 6/2/2015 7/2/2015 8/2/2015 9/2/2015 10/2/2015 11/2/2015 12/2/2015 1/2/2016 2/2/2016 3/2/2016 4/2/2016 5/2/2016 6/2/2016 7/2/2016 8/2/2016 9/2/2016 10/2/2016 11/2/2016 12/2/2016 1/2/2017 2/2/2017 3/2/2017 4/2/2017 5/2/2017 6/2/2017 7/2/2017 8/2/2017 9/2/2017 Typical Conservative Moderate Bitcoin-plus Crypto 10 Figure: Performance metrics of various asset allocation portfolios with modest crypto-currency exposure Each portfolios rebalanced every 3-months. ENHANCED PORTFOLIO RETURN: Crypto adds return, boosts Sharpe-ratio Slide 46 To illustrate the positive effects from adding Crypto currencies to a portfolio, consider the performance of various portfolios below. • By adding even 2% to the portfolio (funded by reducing equities by 200bp), 3-yr annualized gains rise 226bp. Pushing this to 5% increases total return by 547bp, nearly doubling the return of a typical stock/bond blend. Ratio 3-yr Portfolio Performance Metrics Stocks / Bonds / Bitcoin / Crypto 10 Return CAGR Annualized Volatility Sharpe Ratio Maximum Drawdown Typical 60% / 40% / 0% / 0% 6.47% 7.38% 59% (7.9% ) Conservative 58% / 40% / 2% / 0% 8.73% 7.32% 91% (7.2% ) Moderate 55% / 40% / 5% / 0% 12.14% 7.86% 128% (7.4% ) Bitcoin-plus Crypto 10 50% / 40% / 5% / 5% 19.22% 9.54% 180% (8.0% )
  • 47. Disclosures This research is for the clients of Fundstrat Global Advisors only. For important disclosures and rating histories regarding sectors or companies that are the subject of this report, please contact your sales representative or Fundstrat Global Advisors at 150 East 52nd Street, New York, NY, 10022 USA. Analyst Certification (Reg AC) Thomas J. Lee, the research analyst denoted by an “AC” on the cover of this report, hereby certifies that all of the views expressed in this report accurately reflect his personal views, which have not been influenced by considerations of the firm’s business or client relationships. Neither I, nor a member of my household is an officer, director, or advisory board member of the issuer(s) or has another significant affiliation with the issuer(s) that is/are the subject of this research report. There is a possibility that we will from time to time have long or short positions in, and buy or sell, the securities or derivatives, if any, referred to in this research Conflicts of Interest This research contains the views, opinions and recommendations of Fundstrat. As of the time of writing and publication of this presentation, Fundstrat does not know of, or have reason to know of any material conflicts of interest at the time of the publication of this presentation. The Company has no contractual relationship, nor have we received any compensation from any of the companies listed in this research report. Analyst Industry/Sector Views Positive (+): The analyst expects the performance of his industry/sector coverage universe over the next 6-18 months to be attractive vs. the relevant broad market benchmark, being the S&P 500 for North America. Neutral (N): The analyst expects the performance of his or her industry/sector coverage universe over the next 6-18 months to be in line with the relevant broad market benchmark, being the S&P 500 for North America. Negative (-): The analyst expects his or her industry coverage universe over the next 6-18 months to underperform vs. the relevant broad market benchmark, being the S&P 500 for North America. General Disclosures Fundstrat Global Advisors is an independent research company and is not a registered investment advisor and is not acting as a broker dealer under any federal or state securities laws. Fundstrat Global Advisors is a member of IRC Securities’ Research Prime Services Platform. IRC Securities is a FINRA registered broker-dealer that is focused on supporting the independent research industry. Certain personnel of Fundstrat (i.e. Research Analysts) are registered representatives of IRC Securities, a FINRA member firm registered as a broker-dealer with the Securities and Exchange Commission and certain state securities regulators. As registered representatives and independent contractors of IRC Securities, such personnel may receive commissions paid to or shared with IRC Securities for transactions placed by Fundstrat clients directly with IRC Securities or with securities firms that may share commissions with IRC Securities in accordance with applicable SEC and FINRA requirements. IRC Securities does not distribute the research of Fundstrat, which is available to select institutional clients that have engaged Fundstrat. As registered representatives of IRC Securities our analysts must follow IRC Securities’ Written Supervisory Procedures. Notable compliance policies include (1) prohibition of insider trading or the facilitation thereof, (2) maintaining client confidentiality, (3) archival of electronic communications, and (4) appropriate use of electronic communications, amongst other compliance related policies. Fundstrat does not have the same conflicts that traditional sell-side research organizations have because Fundstrat (1) does not conduct any investment banking activities, (2) does not manage any investment funds, and (3) our clients are only institutional investors. This research is for the clients of Fundstrat Global Advisors only. Additional information is available upon request. Information has been obtained from sources believed to be reliable but Fundstrat Global Advisors does not warrant its completeness or accuracy except with respect to any disclosures relative to Fundstrat and the analyst's involvement (if any) with any of the subject companies of the research. All pricing is as of the market close for the securities discussed, unless otherwise stated. Opinions and estimates constitute our judgment as of the date of this material and are subject to change without notice. Past performance is not indicative of future results. This material is not intended as an offer or solicitation for the purchase or sale of any financial instrument. The opinions and recommendations herein do not take into account individual client circumstances, risk tolerance, objectives, or needs and are not intended as recommendations of particular securities, financial instruments or strategies. The recipient of this report must make its own independent decision regarding any securities or financial instruments mentioned herein. Except in circumstances where Fundstrat expressly agrees otherwise in writing, Fundstrat is not acting as a municipal advisor and the opinions or views contained herein are not intended to be, and do not constitute, advice, including within the meaning of Section 15B of the Securities Exchange Act of 1934. All research reports are disseminated and available to all clients simultaneously through electronic publication to our internal client website, fundstrat.com. Not all research content is redistributed to our clients or made available to third-party aggregators or the media. Please contact your sales representative if you would like to receive any of our research publications. Copyright 2017 Fundstrat Global Advisors LLC. All rights reserved. No part of this material may be reprinted, sold or redistributed without the prior written consent of Fundstrat Global Advisors LLC. Slide 47Version: 6/26/17