SlideShare a Scribd company logo
1 of 25
Visualizing Data: Infographic
Assignments across the Social
Work Curriculum
Text
Images
Data
Nathalie Jones, PhD, Tarleton State University
Melanie Sage, PhD, U of North Dakota
Laurel Hitchcock, PhD, UA at Birmingham
Learning Objectives
By the end of this presentation we’ll teach you these things….
Recognize how
infographic tools
can be
incorporated into
assignments for
social work
courses.
Understand how the
use of social media as a
teaching tool in
undergraduate courses
can be used to develop
and assess social work
competencies.
Appreciate the role of
collaboration to
support the
development and
implementation of
technology-based
assignments in social
work education.
Why use infographics in the
Social Work classroom?
Develop
key digital
literacy
skills
Effective way to
communicate
Increasingly
popular
What is an infographic?
Visual images and writing put together to explain/tell a story
Considerations for Digital Storytelling
Hardware Software Techniques Outputs Ethics
Smartphone Phone apps Record in quiet
space
Health messages Informed
consent
Video camera Storify Test sound
quality
Infographics Institutional
review
Audio Recorder Piktochart Use text to
caption video
Video shorts Professionalism
Laptop/Desktop Powerpoint for
slideshows
Train participants
to use
technology
Audio stories Confidentiality
Microphone audacity Attention span
3-5 minutes
Photo exhibits Student privacy
Tools for infographics
Piktochart
Venngage
Easel.ly
Canva
PowerPoint
Infographic Assignment
The Basics
Infographic Assignment
First Step
Prepare for the
Assignment.
Second Step
Learn the
Technology
Third Step
Make your
Infographic.
Fourth Step
Share your
Infographic
Fifth Step
Reflection
Learning Outcomes:
• Create an infographic that provides awareness and/or describes preventative measures related to a social problem
• Conduct research to identify statistics, resources and other data relevant to a social problem
• Demonstrate communication and advocacy skills by sharing and promoting one’s infographic via social media
Step 1: Prep for the assignment
Instructor introduces infographics and purpose of their use. Offers some quality measures.
Students review some infographics. Choose a good one about a social-work-related topic to share (on a blog? In class? Blackboard? brief reflection on
what you like/don’t?)
Rate it against the class rubric
Choose your topic. (We will have specific topics related to our courses, ie policy, mental health, etc)
Find a research article (for practice topics) or legislative policy related to the topic.
Carefully select some main points that you want to share visually.
• Identify stakeholders for this topic, and choose an audience. It could be consumers, parents, practitioners, policy makers, social
workers, students, etc.
• Main points should highlight data, milestones, thesis statements, major findings, or key indicators that help offer the specific audience
key information in a way that is accessible and important to them.
• What images will help you visually represent these ideas? Imagine what picture or graphic will help you tell your story
Step 2: Learn the technology
Instructor will share YouTube videos of the use of Piktochart and VennGage, free infographic creators. Students will make time to seek extra help if
necessary
Step 3: Make your infographic and get feedback
First draft infographic should first be rated by a peer using the class rubric (post at blackboard)
Next step: email a stakeholder (author of article cited, policy maker, or other expert related to your chosen topic) and ask for feedback about clarity,
accuracy, and usefulness of your infographic
Step 4: Share your infographic
Choose at least one Twitter hashtag relevant to your topic, and share your infographic via Twitter using this hashtag
Consider sharing several times over several days, tag people in the infographic who tweet on this topic
Consider what other strategies you would use if this were a public awareness campaign for an agency you represent
Step 5: Reflection
Which class infographic got the most shares and why? Which was viewed by the biggest audience and why? What is the value of social networks to social
workers who have advocacy roles? Reflect on your learning related to (each practice behavior….. ) What else did you learn? Which of these skills do
you expect to use in the future?
Bonus: (Prize/extra credit for class-selected best? Most shared?) Extra credit for survey?
Assignment Specific
Blurbs from our Syllabi
Peer rating rubric
SOCW 3320: Service Learning at TSU
Nathalie’s Assignment
• The purpose of this infographic assignment is
to help students practice advocacy & brokering
skills as it relates to a human service issue
and/or topic identified by the team/group.
• Students are expected to create an infographic
that provides statistics and/or facts on a
chosen social problem as it relates to a
particular population.
• Additional details provided & discussed during
class.
SW 422: Social Work Practice II at UAB
Laurel’s Assignment
• Infographics topics:
• Non-profit Agency
• Community Assets
• Peer-reviews
• Sharing on Twitter & Service
Learning Partners
SWK 317: Social Work Research at UND
Melanie’s Assignment
• Infographics topic:
• Find a research paper to turn in to
an infographic
• Include the research question,
population, main data points,
outcome, implications
• Include APA citation
• Peer-reviews to assure purpose,
visualization, reference, and writing
goals are achieved
Our Research Collaboration
INPUT
Independently
working on
infographic
assignments
Connected through
Twitter
Collaborative
development
research questions
PROCESS
Created a master infographic
assignment
Designed our SOTL study
Student Survey
#VisualSW
OUTPUT
Students from
three different
institutions
creating
infographics on
different topics
Data on student
learning across
demographics
Our Research Questions
Can the use of infographics contribute to
student learning about technology and
about social work? If so, How?
What factors have a positive and/or
negative effect on the implementation of an
infographic assignment?
What differences do students perceive
between an infographic assignment and a
writing assignment?
Survey
Approved by IRB at UND
In non-technical language describe the purpose of the study and state the
rationale for this research.
This study will investigate the experience of undergraduate students in completing infographic
assignments in social work courses across the curriculum and in multiple program across the US.
The assignment involves students creating a visual product with text and images about a topic
relevant to a social work course. A copy of this assignment is attached. We will assess both the
process and the outcome of the assignment, gathering data that are informative for faculty and
others who are engaging in similar instructive activities as well as the impact of the project on the
student participants. Findings will include student-identified outcomes; successes and challenges of
the implementation of the assignment; and empirically-supported suggestions for pedagogical best
practices. The overall research question for this project is:
Can the use of infographics contribute to student learning about technology and about social work?
In non-technical language, please describe the study.
Students will complete the assignment as part of a course requirement as well as a required post-
assignment assessment survey (see attached). Our research involves analyzing the anonymous
results of the required survey. No student names will be used during analysis and identifiers will
not be recorded on a master list. Students may not opt out of the assignment or post-survey, but
the decision to let researchers analyze their data is voluntary. Students will receive information
about the study along with the survey and may opt out of the study by checking a box at top of the
survey instruments.
Quantitative Results
Student Demographics (N = 59)
UND (n = 15) UAB (n =20) TSU (n=24) Total (N= 59)
Average Age
24.5 years 25 years 33 years 28 years
Female
13 (86%) 18 (90%) 18 (75%) 53 (90%)
Non-
Traditional
Student 4 (27%) 5 (25%) 18 (75%) 27 (36%)
UND = University of North Dakota
UAB = University of Alabama at Birmingham
TSU = Tarleton State University
Quantitative Results
How comfortable are you with technology? (n = 59)
Question
How comfortable
are you with
technology?
How comfortable were
you with creating
infographics prior to this
assignment?
Extremely comfortable 22 (37.3%) 2 (3.3%)
Moderately comfortable 26 (44.1%) 7 (11.8%)
Slightly comfortable 8(13.6%) 9 (15.3%)
Neither comfortable nor
uncomfortable 2 (3.4%) 14 (23.7%)
Slightly uncomfortable 1 (1.7%) 10 (17.0%)
Moderately uncomfortable 0 (0.0%) 7 (11.8%)
Extremely uncomfortable 0 (0.0%) 10 (17.0%)
Quantitative Results
How valuable was this assignment to your learning
about…. (n= 56)?
How valuable was this
assignment in teaching….
Very
valuable
mostly
valuable
moderately
valuable
only a little
bit valuable
Not very
valuable
...how to interpret and
communicate about a social
work topic? 30 (54%) 18 (32%) 5 (9%) 1 (2%) 2 (5%)
...presenting statistics,
resources and other data? 31 (55%) 14 (25%) 8 (14%) 0 (0%) 3 (5%)
...communication and advocacy
skills ? 34 (61%) 13 (23%) 6 (11%) 1 (2%) 2 (5%)
Qualitative
Results
THEME #1
Technology
Use
Pro
Very easy to use!
Pro
“I found it easy to complete, the professor did a
great job at giving resources for the project.”
Con
“Some app-related issues; switched to a different
site instead.”
Con
“Was a slow website to use on my tablet and glitches a
lot so I went to a campus computer lab to finish it.”
Qualitative
Results
THEME #2
Assignment
Style
Pro
“I loved this assignment. I would much rather
create an infographic rather than writing a
paper”
Pro
“I would have rather done the infographic than
write a paper. I feel like, with the infographic you
have to research a topic and write what you think
is most relevant to share with others.”
Con
“It did not have an impact of learning in this
assignment in comparison to other assignments in
the class.”
Con
“This assignment was kind of difficult to me
because I am not majoring in social work.”
Qualitative
Results
THEME #3
Pro
“Having something tangible that uses the skills
and advocates for the cause you are supporting
couldn't be matched in a paper or a PowerPoint.”
Pro
“An infographic grabs the reader's attention
faster than viewing a written paper or taking the
time to view a PowerPoint presentation.
Infographics are compact and the data is clearly
stated.”
Con
“To be honest, I would have written a paper
instead, because of how time consuming it was. I
am glad that I know how to create one though.”
Con
“It was more time consuming because you spend
most of your time formatting and making it look
pretty then actually doing the research.”
Learning
Outcomes
Discussion/Lessons Learned
Nathalie
• Provide additional tech
support during class.
• Additional class discussion on
steps.
• Combine steps that seem to
be somewhat simple.
• Explain each step prior to the
due date to ensure clarity.
Melanie
• Start early- this
assignment has lots of
pieces.
• Provide in-class time for
practice, group work, in-
person trouble-shooting.
• Shorten videos/use
videos outside of class.
Laurel
• Connect assignment
with digital literacy
• Review an infographic
before creating one
• Connect assignment to
real-world experiences
• Model
Questions?
Nathalie P. Jones, PhD, MSW
Assistant Professor
Tarleton State University
njones@Tarleton.edu
@DrNJonesTSU
Laurel Iverson Hitchcock, PhD, MPH, LICSW, PIP
Assistant Professor
University of Alabama at Birmingham (UAB)
lihitch@uab.edu
@laurelhitchcock
Melanie Sage, PhD, LICSW
Assistant Professor
University of North Dakota
Melanie.Sage@und.edu
@melaniesage
Access slides and other info from this presentation:
http://www.laureliversonhitchcock.org/2017/02/24/bp
dnola17infographics/
References
Centers for Disease Control & Prevention. (n.d.). Infographics. Retrieved May 21, 2016, from
http://www.cdc.gov/socialmedia/tools/infographics.html
Council on Social Work Education. (2015). Educational Policy and Accreditation
Standards. Washington, DC: Author.
Dyjur, P., & Li, L. (2015). Learning 21st Century Skills by Engaging in an Infographics Assessment. In Proceedings of
the IDEAS: Designing Responsive Pedagogy (pp. 62–71). University of Calgary. Retrieved from
http://dspace.ucalgary.ca/bitstream/1880/50860/1/7%20Learning%2021st%20-%20Dyjur%20%26%20Li.pdf
Joosten, T. (2012). Social media for educators: strategies and best practices. San Francisco: Jossey-Bass.
Kos, B. A., & Sims, E. (2014). Infographics: The New 5-Paragraph Essay. In 2014 Rocky Mountain Celebration of
Women in Computing. Laramie, WY, USA. Retrieved from
http://scholar.colorado.edu/cgi/viewcontent.cgi?article=1001&context=atlas_gradpapers
Martix, S., & Hodson, J. (2014). Teaching with infographics: practicing new digital competencies and visual
literacies. Journal of pedagogic development, 4 (2). Retrieved from: http://www.beds.ac.uk/jpd/volume-4-issue-
2/teaching-with-infographics

More Related Content

What's hot

Julia Parra Research for VSS 2009
Julia Parra Research for VSS 2009Julia Parra Research for VSS 2009
Julia Parra Research for VSS 2009Julia Parra
 
Social network analysis of large online gamified courses
Social network analysis of large online gamified coursesSocial network analysis of large online gamified courses
Social network analysis of large online gamified coursesLuis de-Marcos Ortega
 
Using SNA to Provide Feedback on Course Discussion (AERA 2015 Presentation)
Using SNA to Provide Feedback on Course Discussion (AERA 2015 Presentation)Using SNA to Provide Feedback on Course Discussion (AERA 2015 Presentation)
Using SNA to Provide Feedback on Course Discussion (AERA 2015 Presentation)Vanessa Dennen
 
Self directed learning in future learn courses using the Bouchard framework
Self directed learning in future learn courses using the Bouchard frameworkSelf directed learning in future learn courses using the Bouchard framework
Self directed learning in future learn courses using the Bouchard frameworkInge de Waard
 
Design based for lisbon 2011
Design based for lisbon 2011Design based for lisbon 2011
Design based for lisbon 2011Terry Anderson
 
Self directed learning in trial future learn courses
Self directed learning in trial future learn coursesSelf directed learning in trial future learn courses
Self directed learning in trial future learn coursesInge de Waard
 
JOURNAL/ARTICLE CRITIC
JOURNAL/ARTICLE CRITICJOURNAL/ARTICLE CRITIC
JOURNAL/ARTICLE CRITICRohaida Muslim
 
Marrying Marzano W Instructional Technology
Marrying Marzano W Instructional TechnologyMarrying Marzano W Instructional Technology
Marrying Marzano W Instructional TechnologyMelanie Lewis
 
Ed Tech Efficacy Symposium Working Group on Higher Education Results
Ed Tech Efficacy Symposium Working Group on Higher Education ResultsEd Tech Efficacy Symposium Working Group on Higher Education Results
Ed Tech Efficacy Symposium Working Group on Higher Education ResultsDr. Kristin Palmer
 
UbiTeach: Methods for Augumented Teaching
UbiTeach: Methods for Augumented TeachingUbiTeach: Methods for Augumented Teaching
UbiTeach: Methods for Augumented TeachingRoberto Medico
 
Week 6 effectsoftechnology-roshana
Week 6 effectsoftechnology-roshanaWeek 6 effectsoftechnology-roshana
Week 6 effectsoftechnology-roshanaGulali Agha
 
080117 Peeking Over The Horizon
080117 Peeking Over The Horizon080117 Peeking Over The Horizon
080117 Peeking Over The Horizondatahoss
 
Choosing Collaborative Systems Ingram Parker
Choosing Collaborative Systems Ingram ParkerChoosing Collaborative Systems Ingram Parker
Choosing Collaborative Systems Ingram Parkeraingram
 
EDUC5102G Session 1 Presentation
EDUC5102G Session 1 PresentationEDUC5102G Session 1 Presentation
EDUC5102G Session 1 PresentationRobert Power
 
The Future Looks Digital - TCCTA
The Future Looks Digital - TCCTAThe Future Looks Digital - TCCTA
The Future Looks Digital - TCCTAdrpmcgee
 

What's hot (19)

Julia Parra Research for VSS 2009
Julia Parra Research for VSS 2009Julia Parra Research for VSS 2009
Julia Parra Research for VSS 2009
 
Social network analysis of large online gamified courses
Social network analysis of large online gamified coursesSocial network analysis of large online gamified courses
Social network analysis of large online gamified courses
 
Co-Design for learning analytics projects
Co-Design for learning analytics projectsCo-Design for learning analytics projects
Co-Design for learning analytics projects
 
Eli11 utk
Eli11 utkEli11 utk
Eli11 utk
 
Using SNA to Provide Feedback on Course Discussion (AERA 2015 Presentation)
Using SNA to Provide Feedback on Course Discussion (AERA 2015 Presentation)Using SNA to Provide Feedback on Course Discussion (AERA 2015 Presentation)
Using SNA to Provide Feedback on Course Discussion (AERA 2015 Presentation)
 
Self directed learning in future learn courses using the Bouchard framework
Self directed learning in future learn courses using the Bouchard frameworkSelf directed learning in future learn courses using the Bouchard framework
Self directed learning in future learn courses using the Bouchard framework
 
Design based for lisbon 2011
Design based for lisbon 2011Design based for lisbon 2011
Design based for lisbon 2011
 
Self directed learning in trial future learn courses
Self directed learning in trial future learn coursesSelf directed learning in trial future learn courses
Self directed learning in trial future learn courses
 
JOURNAL/ARTICLE CRITIC
JOURNAL/ARTICLE CRITICJOURNAL/ARTICLE CRITIC
JOURNAL/ARTICLE CRITIC
 
Marrying Marzano W Instructional Technology
Marrying Marzano W Instructional TechnologyMarrying Marzano W Instructional Technology
Marrying Marzano W Instructional Technology
 
Ed Tech Efficacy Symposium Working Group on Higher Education Results
Ed Tech Efficacy Symposium Working Group on Higher Education ResultsEd Tech Efficacy Symposium Working Group on Higher Education Results
Ed Tech Efficacy Symposium Working Group on Higher Education Results
 
Robyn 520 3
Robyn 520 3Robyn 520 3
Robyn 520 3
 
UbiTeach: Methods for Augumented Teaching
UbiTeach: Methods for Augumented TeachingUbiTeach: Methods for Augumented Teaching
UbiTeach: Methods for Augumented Teaching
 
Week 6 effectsoftechnology-roshana
Week 6 effectsoftechnology-roshanaWeek 6 effectsoftechnology-roshana
Week 6 effectsoftechnology-roshana
 
TMA01 Part 2 H818
TMA01 Part 2 H818TMA01 Part 2 H818
TMA01 Part 2 H818
 
080117 Peeking Over The Horizon
080117 Peeking Over The Horizon080117 Peeking Over The Horizon
080117 Peeking Over The Horizon
 
Choosing Collaborative Systems Ingram Parker
Choosing Collaborative Systems Ingram ParkerChoosing Collaborative Systems Ingram Parker
Choosing Collaborative Systems Ingram Parker
 
EDUC5102G Session 1 Presentation
EDUC5102G Session 1 PresentationEDUC5102G Session 1 Presentation
EDUC5102G Session 1 Presentation
 
The Future Looks Digital - TCCTA
The Future Looks Digital - TCCTAThe Future Looks Digital - TCCTA
The Future Looks Digital - TCCTA
 

Viewers also liked

How to Create an Infographic with these 5 Delicious Elements
How to Create an Infographic with these 5 Delicious ElementsHow to Create an Infographic with these 5 Delicious Elements
How to Create an Infographic with these 5 Delicious ElementsKatai Robert
 
24 Awesome Infographic Ideas to Inspire Your Next Beautiful Creation
24 Awesome Infographic Ideas to Inspire Your Next Beautiful Creation24 Awesome Infographic Ideas to Inspire Your Next Beautiful Creation
24 Awesome Infographic Ideas to Inspire Your Next Beautiful CreationPiktochart
 
Infographic Marketing: Better Creation, Better Promotion
Infographic Marketing: Better Creation, Better PromotionInfographic Marketing: Better Creation, Better Promotion
Infographic Marketing: Better Creation, Better PromotionScott Cowley
 
How to design an infographic in 9 simple steps
How to design an infographic in 9 simple stepsHow to design an infographic in 9 simple steps
How to design an infographic in 9 simple stepsKatai Robert
 
Infographic Optimization Hacks
Infographic Optimization HacksInfographic Optimization Hacks
Infographic Optimization HacksGhergich & Co.
 
Exaltus infographic design services
Exaltus infographic design servicesExaltus infographic design services
Exaltus infographic design servicesCarole Alalouf
 
The Power of Infographics
The Power of InfographicsThe Power of Infographics
The Power of InfographicsMark Smiciklas
 
4 Key Elements of Great Infographic Design
4 Key Elements of Great Infographic Design4 Key Elements of Great Infographic Design
4 Key Elements of Great Infographic DesignAndrea Fryrear
 
Its all about Infographics
Its all about InfographicsIts all about Infographics
Its all about InfographicsAditya Krishna
 
Infographics Key Data KPI presentation slides
Infographics Key Data KPI presentation slidesInfographics Key Data KPI presentation slides
Infographics Key Data KPI presentation slidesPeter Zvirinsky
 
What is an Infographic?
What is an Infographic?What is an Infographic?
What is an Infographic?Bernard Marr
 
Market Research Infographic
Market Research Infographic Market Research Infographic
Market Research Infographic Peng Lai
 
Infographic Thinking Workshop - Data communicator
Infographic Thinking Workshop - Data communicatorInfographic Thinking Workshop - Data communicator
Infographic Thinking Workshop - Data communicatorPerus Saranurak
 
Infographics with B2B - research
Infographics with B2B - researchInfographics with B2B - research
Infographics with B2B - researchRamya Karunanithi
 
How to Make Infographics for Research
How to Make Infographics for Research How to Make Infographics for Research
How to Make Infographics for Research Evert Van den Broeck
 
Digital humanities project: visual analytic tool for human rights remembrance...
Digital humanities project: visual analytic tool for human rights remembrance...Digital humanities project: visual analytic tool for human rights remembrance...
Digital humanities project: visual analytic tool for human rights remembrance...Lu Xiao
 
Basic of Social Network for Business 20-10-2015
Basic of Social Network for Business 20-10-2015Basic of Social Network for Business 20-10-2015
Basic of Social Network for Business 20-10-2015Perus Saranurak
 
[INFOGRAPHIC] Major religious groups
[INFOGRAPHIC] Major religious groups[INFOGRAPHIC] Major religious groups
[INFOGRAPHIC] Major religious groupsMats Forss
 
Time to talk TRUMP Impeachment
Time to talk TRUMP ImpeachmentTime to talk TRUMP Impeachment
Time to talk TRUMP ImpeachmentSusana Gallardo
 

Viewers also liked (20)

How to Create an Infographic with these 5 Delicious Elements
How to Create an Infographic with these 5 Delicious ElementsHow to Create an Infographic with these 5 Delicious Elements
How to Create an Infographic with these 5 Delicious Elements
 
24 Awesome Infographic Ideas to Inspire Your Next Beautiful Creation
24 Awesome Infographic Ideas to Inspire Your Next Beautiful Creation24 Awesome Infographic Ideas to Inspire Your Next Beautiful Creation
24 Awesome Infographic Ideas to Inspire Your Next Beautiful Creation
 
Infographic Marketing: Better Creation, Better Promotion
Infographic Marketing: Better Creation, Better PromotionInfographic Marketing: Better Creation, Better Promotion
Infographic Marketing: Better Creation, Better Promotion
 
How to design an infographic in 9 simple steps
How to design an infographic in 9 simple stepsHow to design an infographic in 9 simple steps
How to design an infographic in 9 simple steps
 
Infographic Optimization Hacks
Infographic Optimization HacksInfographic Optimization Hacks
Infographic Optimization Hacks
 
Exaltus infographic design services
Exaltus infographic design servicesExaltus infographic design services
Exaltus infographic design services
 
The Power of Infographics
The Power of InfographicsThe Power of Infographics
The Power of Infographics
 
4 Key Elements of Great Infographic Design
4 Key Elements of Great Infographic Design4 Key Elements of Great Infographic Design
4 Key Elements of Great Infographic Design
 
Its all about Infographics
Its all about InfographicsIts all about Infographics
Its all about Infographics
 
Infographics Key Data KPI presentation slides
Infographics Key Data KPI presentation slidesInfographics Key Data KPI presentation slides
Infographics Key Data KPI presentation slides
 
What is an Infographic?
What is an Infographic?What is an Infographic?
What is an Infographic?
 
Market Research Infographic
Market Research Infographic Market Research Infographic
Market Research Infographic
 
Infographic Thinking Workshop - Data communicator
Infographic Thinking Workshop - Data communicatorInfographic Thinking Workshop - Data communicator
Infographic Thinking Workshop - Data communicator
 
Infographics with B2B - research
Infographics with B2B - researchInfographics with B2B - research
Infographics with B2B - research
 
How to Make Infographics for Research
How to Make Infographics for Research How to Make Infographics for Research
How to Make Infographics for Research
 
Digital humanities project: visual analytic tool for human rights remembrance...
Digital humanities project: visual analytic tool for human rights remembrance...Digital humanities project: visual analytic tool for human rights remembrance...
Digital humanities project: visual analytic tool for human rights remembrance...
 
Basic of Social Network for Business 20-10-2015
Basic of Social Network for Business 20-10-2015Basic of Social Network for Business 20-10-2015
Basic of Social Network for Business 20-10-2015
 
Infographic
InfographicInfographic
Infographic
 
[INFOGRAPHIC] Major religious groups
[INFOGRAPHIC] Major religious groups[INFOGRAPHIC] Major religious groups
[INFOGRAPHIC] Major religious groups
 
Time to talk TRUMP Impeachment
Time to talk TRUMP ImpeachmentTime to talk TRUMP Impeachment
Time to talk TRUMP Impeachment
 

Similar to Visualizing Data: Infographic Assignments across the Social Work Curriculum

RStrachanOct23.pptx
RStrachanOct23.pptxRStrachanOct23.pptx
RStrachanOct23.pptxJisc
 
Higher Education Student Handbooks & Social media
Higher Education Student Handbooks & Social mediaHigher Education Student Handbooks & Social media
Higher Education Student Handbooks & Social mediaLaura Pasquini
 
Design and sketching
Design and sketchingDesign and sketching
Design and sketchingHCS
 
Assistive Technology and Associated Training
Assistive Technology and Associated TrainingAssistive Technology and Associated Training
Assistive Technology and Associated TrainingE.A. Draffan
 
Id Project 1 Final Doc Word Version
Id Project 1 Final Doc Word VersionId Project 1 Final Doc Word Version
Id Project 1 Final Doc Word Versionloraevanouski
 
Technology Usage Survey poster
Technology Usage Survey posterTechnology Usage Survey poster
Technology Usage Survey posterCathy Yang
 
Teta spotlight
Teta spotlightTeta spotlight
Teta spotlightJan Coley
 
Digital final pres
Digital final presDigital final pres
Digital final prescheriser
 
Digital final pres
Digital final presDigital final pres
Digital final prescheriser
 
Digital literacy and learning gain
Digital literacy and learning gainDigital literacy and learning gain
Digital literacy and learning gainRhona Sharpe
 
Ipt guide
Ipt guideIpt guide
Ipt guidehccit
 
Perceptions and experiences of 1st year UJ Humanities students about the use ...
Perceptions and experiences of 1st year UJ Humanities students about the use ...Perceptions and experiences of 1st year UJ Humanities students about the use ...
Perceptions and experiences of 1st year UJ Humanities students about the use ...Carina van Rooyen
 
#Edu14 Seminar on the State of Social Media in Higher Ed
#Edu14 Seminar on the State of Social Media in Higher Ed#Edu14 Seminar on the State of Social Media in Higher Ed
#Edu14 Seminar on the State of Social Media in Higher EdLaura Pasquini
 
Analysing students' digital experience: personas and key drivers
Analysing students' digital experience: personas and key driversAnalysing students' digital experience: personas and key drivers
Analysing students' digital experience: personas and key driversJisc
 
Spring 2012 faculty & student technology surveys report
Spring 2012 faculty & student technology surveys reportSpring 2012 faculty & student technology surveys report
Spring 2012 faculty & student technology surveys reportCathy Yang
 
Findings from the 2020 digital experience insights teaching staff surveys for...
Findings from the 2020 digital experience insights teaching staff surveys for...Findings from the 2020 digital experience insights teaching staff surveys for...
Findings from the 2020 digital experience insights teaching staff surveys for...Jisc
 
The Generative AI System Shock, and some thoughts on Collective Intelligence ...
The Generative AI System Shock, and some thoughts on Collective Intelligence ...The Generative AI System Shock, and some thoughts on Collective Intelligence ...
The Generative AI System Shock, and some thoughts on Collective Intelligence ...Simon Buckingham Shum
 
Snr ipt 10_guide
Snr ipt 10_guideSnr ipt 10_guide
Snr ipt 10_guidehccit
 

Similar to Visualizing Data: Infographic Assignments across the Social Work Curriculum (20)

RStrachanOct23.pptx
RStrachanOct23.pptxRStrachanOct23.pptx
RStrachanOct23.pptx
 
Higher Education Student Handbooks & Social media
Higher Education Student Handbooks & Social mediaHigher Education Student Handbooks & Social media
Higher Education Student Handbooks & Social media
 
Design and sketching
Design and sketchingDesign and sketching
Design and sketching
 
Assistive Technology and Associated Training
Assistive Technology and Associated TrainingAssistive Technology and Associated Training
Assistive Technology and Associated Training
 
ID Project 1
ID Project 1 ID Project 1
ID Project 1
 
Id Project 1 Final Doc Word Version
Id Project 1 Final Doc Word VersionId Project 1 Final Doc Word Version
Id Project 1 Final Doc Word Version
 
Technology Usage Survey poster
Technology Usage Survey posterTechnology Usage Survey poster
Technology Usage Survey poster
 
Teta spotlight
Teta spotlightTeta spotlight
Teta spotlight
 
Oc tel mooc week 2
Oc tel mooc week 2Oc tel mooc week 2
Oc tel mooc week 2
 
Digital final pres
Digital final presDigital final pres
Digital final pres
 
Digital final pres
Digital final presDigital final pres
Digital final pres
 
Digital literacy and learning gain
Digital literacy and learning gainDigital literacy and learning gain
Digital literacy and learning gain
 
Ipt guide
Ipt guideIpt guide
Ipt guide
 
Perceptions and experiences of 1st year UJ Humanities students about the use ...
Perceptions and experiences of 1st year UJ Humanities students about the use ...Perceptions and experiences of 1st year UJ Humanities students about the use ...
Perceptions and experiences of 1st year UJ Humanities students about the use ...
 
#Edu14 Seminar on the State of Social Media in Higher Ed
#Edu14 Seminar on the State of Social Media in Higher Ed#Edu14 Seminar on the State of Social Media in Higher Ed
#Edu14 Seminar on the State of Social Media in Higher Ed
 
Analysing students' digital experience: personas and key drivers
Analysing students' digital experience: personas and key driversAnalysing students' digital experience: personas and key drivers
Analysing students' digital experience: personas and key drivers
 
Spring 2012 faculty & student technology surveys report
Spring 2012 faculty & student technology surveys reportSpring 2012 faculty & student technology surveys report
Spring 2012 faculty & student technology surveys report
 
Findings from the 2020 digital experience insights teaching staff surveys for...
Findings from the 2020 digital experience insights teaching staff surveys for...Findings from the 2020 digital experience insights teaching staff surveys for...
Findings from the 2020 digital experience insights teaching staff surveys for...
 
The Generative AI System Shock, and some thoughts on Collective Intelligence ...
The Generative AI System Shock, and some thoughts on Collective Intelligence ...The Generative AI System Shock, and some thoughts on Collective Intelligence ...
The Generative AI System Shock, and some thoughts on Collective Intelligence ...
 
Snr ipt 10_guide
Snr ipt 10_guideSnr ipt 10_guide
Snr ipt 10_guide
 

More from Laurel Hitchcock

Evolving the Signature Pedagogy with the Social Media Toolkit for Field Educa...
Evolving the Signature Pedagogy with the Social Media Toolkit for Field Educa...Evolving the Signature Pedagogy with the Social Media Toolkit for Field Educa...
Evolving the Signature Pedagogy with the Social Media Toolkit for Field Educa...Laurel Hitchcock
 
Changing Teaching Practices for Technology: Using the SAMR Model for Technolo...
Changing Teaching Practices for Technology: Using the SAMR Model for Technolo...Changing Teaching Practices for Technology: Using the SAMR Model for Technolo...
Changing Teaching Practices for Technology: Using the SAMR Model for Technolo...Laurel Hitchcock
 
Developing a Professional & Ethical Online Presence for Social Work Practice
Developing a Professional & Ethical Online Presence for Social Work PracticeDeveloping a Professional & Ethical Online Presence for Social Work Practice
Developing a Professional & Ethical Online Presence for Social Work PracticeLaurel Hitchcock
 
Imagining Social Work Education into the Future: Skills for Social Justice in...
Imagining Social Work Education into the Future: Skills for Social Justice in...Imagining Social Work Education into the Future: Skills for Social Justice in...
Imagining Social Work Education into the Future: Skills for Social Justice in...Laurel Hitchcock
 
What role will social worker choose in shaping the digital future?
What role will social worker choose in shaping the digital future? What role will social worker choose in shaping the digital future?
What role will social worker choose in shaping the digital future? Laurel Hitchcock
 
#SWDE2019 - Incorporating Technology into Social Justice Assignments for Soci...
#SWDE2019 - Incorporating Technology into Social Justice Assignments for Soci...#SWDE2019 - Incorporating Technology into Social Justice Assignments for Soci...
#SWDE2019 - Incorporating Technology into Social Justice Assignments for Soci...Laurel Hitchcock
 
Helping Social Work Students develop a Professional Online Presence for Inter...
Helping Social Work Students develop a Professional Online Presence for Inter...Helping Social Work Students develop a Professional Online Presence for Inter...
Helping Social Work Students develop a Professional Online Presence for Inter...Laurel Hitchcock
 
Harnessing Technology for one’s own Good: Professional Learning Networks in S...
Harnessing Technology for one’s own Good: Professional Learning Networks in S...Harnessing Technology for one’s own Good: Professional Learning Networks in S...
Harnessing Technology for one’s own Good: Professional Learning Networks in S...Laurel Hitchcock
 
Professional Learning Networks for Social Work
Professional Learning Networks for Social Work Professional Learning Networks for Social Work
Professional Learning Networks for Social Work Laurel Hitchcock
 
Harnessing Technology for Social Work Scholarship
Harnessing Technology for Social Work ScholarshipHarnessing Technology for Social Work Scholarship
Harnessing Technology for Social Work ScholarshipLaurel Hitchcock
 
Social Media for Social Good
Social Media for Social GoodSocial Media for Social Good
Social Media for Social GoodLaurel Hitchcock
 
Integrating Technology-rich Assignments in the Curriculum
Integrating Technology-rich Assignments in the CurriculumIntegrating Technology-rich Assignments in the Curriculum
Integrating Technology-rich Assignments in the CurriculumLaurel Hitchcock
 
Professional Learning Networks for Social Work
Professional Learning Networks for Social Work Professional Learning Networks for Social Work
Professional Learning Networks for Social Work Laurel Hitchcock
 
#BPDNOLA17 - Road Map for Success: Incorporating Social Media in the Social W...
#BPDNOLA17 - Road Map for Success: Incorporating Social Media in the Social W...#BPDNOLA17 - Road Map for Success: Incorporating Social Media in the Social W...
#BPDNOLA17 - Road Map for Success: Incorporating Social Media in the Social W...Laurel Hitchcock
 
#BPDNOLA17 – The Social Media Toolkit goes on the road
#BPDNOLA17 – The Social Media Toolkit goes on the road#BPDNOLA17 – The Social Media Toolkit goes on the road
#BPDNOLA17 – The Social Media Toolkit goes on the roadLaurel Hitchcock
 
#APM16 Incorporating Digital & Social Technologies into Social Work Education
#APM16 Incorporating Digital & Social Technologies into Social Work Education#APM16 Incorporating Digital & Social Technologies into Social Work Education
#APM16 Incorporating Digital & Social Technologies into Social Work EducationLaurel Hitchcock
 
#APM16 - A Toolkit for Social and Digital Media Policies in Field Education
#APM16 - A Toolkit for Social and Digital Media Policies in Field Education#APM16 - A Toolkit for Social and Digital Media Policies in Field Education
#APM16 - A Toolkit for Social and Digital Media Policies in Field EducationLaurel Hitchcock
 
Fellows in Engaged Scholarship Program: Supporting Faculty in Service Learning
Fellows in Engaged Scholarship Program: Supporting Faculty in Service LearningFellows in Engaged Scholarship Program: Supporting Faculty in Service Learning
Fellows in Engaged Scholarship Program: Supporting Faculty in Service LearningLaurel Hitchcock
 
Incorporating digital and social technologies into social work education
Incorporating digital and social technologies into social work educationIncorporating digital and social technologies into social work education
Incorporating digital and social technologies into social work educationLaurel Hitchcock
 

More from Laurel Hitchcock (20)

Evolving the Signature Pedagogy with the Social Media Toolkit for Field Educa...
Evolving the Signature Pedagogy with the Social Media Toolkit for Field Educa...Evolving the Signature Pedagogy with the Social Media Toolkit for Field Educa...
Evolving the Signature Pedagogy with the Social Media Toolkit for Field Educa...
 
Changing Teaching Practices for Technology: Using the SAMR Model for Technolo...
Changing Teaching Practices for Technology: Using the SAMR Model for Technolo...Changing Teaching Practices for Technology: Using the SAMR Model for Technolo...
Changing Teaching Practices for Technology: Using the SAMR Model for Technolo...
 
Developing a Professional & Ethical Online Presence for Social Work Practice
Developing a Professional & Ethical Online Presence for Social Work PracticeDeveloping a Professional & Ethical Online Presence for Social Work Practice
Developing a Professional & Ethical Online Presence for Social Work Practice
 
Imagining Social Work Education into the Future: Skills for Social Justice in...
Imagining Social Work Education into the Future: Skills for Social Justice in...Imagining Social Work Education into the Future: Skills for Social Justice in...
Imagining Social Work Education into the Future: Skills for Social Justice in...
 
What role will social worker choose in shaping the digital future?
What role will social worker choose in shaping the digital future? What role will social worker choose in shaping the digital future?
What role will social worker choose in shaping the digital future?
 
#SWDE2019 - Incorporating Technology into Social Justice Assignments for Soci...
#SWDE2019 - Incorporating Technology into Social Justice Assignments for Soci...#SWDE2019 - Incorporating Technology into Social Justice Assignments for Soci...
#SWDE2019 - Incorporating Technology into Social Justice Assignments for Soci...
 
Teaching with Technology
Teaching with TechnologyTeaching with Technology
Teaching with Technology
 
Helping Social Work Students develop a Professional Online Presence for Inter...
Helping Social Work Students develop a Professional Online Presence for Inter...Helping Social Work Students develop a Professional Online Presence for Inter...
Helping Social Work Students develop a Professional Online Presence for Inter...
 
Harnessing Technology for one’s own Good: Professional Learning Networks in S...
Harnessing Technology for one’s own Good: Professional Learning Networks in S...Harnessing Technology for one’s own Good: Professional Learning Networks in S...
Harnessing Technology for one’s own Good: Professional Learning Networks in S...
 
Professional Learning Networks for Social Work
Professional Learning Networks for Social Work Professional Learning Networks for Social Work
Professional Learning Networks for Social Work
 
Harnessing Technology for Social Work Scholarship
Harnessing Technology for Social Work ScholarshipHarnessing Technology for Social Work Scholarship
Harnessing Technology for Social Work Scholarship
 
Social Media for Social Good
Social Media for Social GoodSocial Media for Social Good
Social Media for Social Good
 
Integrating Technology-rich Assignments in the Curriculum
Integrating Technology-rich Assignments in the CurriculumIntegrating Technology-rich Assignments in the Curriculum
Integrating Technology-rich Assignments in the Curriculum
 
Professional Learning Networks for Social Work
Professional Learning Networks for Social Work Professional Learning Networks for Social Work
Professional Learning Networks for Social Work
 
#BPDNOLA17 - Road Map for Success: Incorporating Social Media in the Social W...
#BPDNOLA17 - Road Map for Success: Incorporating Social Media in the Social W...#BPDNOLA17 - Road Map for Success: Incorporating Social Media in the Social W...
#BPDNOLA17 - Road Map for Success: Incorporating Social Media in the Social W...
 
#BPDNOLA17 – The Social Media Toolkit goes on the road
#BPDNOLA17 – The Social Media Toolkit goes on the road#BPDNOLA17 – The Social Media Toolkit goes on the road
#BPDNOLA17 – The Social Media Toolkit goes on the road
 
#APM16 Incorporating Digital & Social Technologies into Social Work Education
#APM16 Incorporating Digital & Social Technologies into Social Work Education#APM16 Incorporating Digital & Social Technologies into Social Work Education
#APM16 Incorporating Digital & Social Technologies into Social Work Education
 
#APM16 - A Toolkit for Social and Digital Media Policies in Field Education
#APM16 - A Toolkit for Social and Digital Media Policies in Field Education#APM16 - A Toolkit for Social and Digital Media Policies in Field Education
#APM16 - A Toolkit for Social and Digital Media Policies in Field Education
 
Fellows in Engaged Scholarship Program: Supporting Faculty in Service Learning
Fellows in Engaged Scholarship Program: Supporting Faculty in Service LearningFellows in Engaged Scholarship Program: Supporting Faculty in Service Learning
Fellows in Engaged Scholarship Program: Supporting Faculty in Service Learning
 
Incorporating digital and social technologies into social work education
Incorporating digital and social technologies into social work educationIncorporating digital and social technologies into social work education
Incorporating digital and social technologies into social work education
 

Recently uploaded

Difference Between Search & Browse Methods in Odoo 17
Difference Between Search & Browse Methods in Odoo 17Difference Between Search & Browse Methods in Odoo 17
Difference Between Search & Browse Methods in Odoo 17Celine George
 
Music 9 - 4th quarter - Vocal Music of the Romantic Period.pptx
Music 9 - 4th quarter - Vocal Music of the Romantic Period.pptxMusic 9 - 4th quarter - Vocal Music of the Romantic Period.pptx
Music 9 - 4th quarter - Vocal Music of the Romantic Period.pptxleah joy valeriano
 
4.18.24 Movement Legacies, Reflection, and Review.pptx
4.18.24 Movement Legacies, Reflection, and Review.pptx4.18.24 Movement Legacies, Reflection, and Review.pptx
4.18.24 Movement Legacies, Reflection, and Review.pptxmary850239
 
Full Stack Web Development Course for Beginners
Full Stack Web Development Course  for BeginnersFull Stack Web Development Course  for Beginners
Full Stack Web Development Course for BeginnersSabitha Banu
 
Keynote by Prof. Wurzer at Nordex about IP-design
Keynote by Prof. Wurzer at Nordex about IP-designKeynote by Prof. Wurzer at Nordex about IP-design
Keynote by Prof. Wurzer at Nordex about IP-designMIPLM
 
4.16.24 21st Century Movements for Black Lives.pptx
4.16.24 21st Century Movements for Black Lives.pptx4.16.24 21st Century Movements for Black Lives.pptx
4.16.24 21st Century Movements for Black Lives.pptxmary850239
 
Daily Lesson Plan in Mathematics Quarter 4
Daily Lesson Plan in Mathematics Quarter 4Daily Lesson Plan in Mathematics Quarter 4
Daily Lesson Plan in Mathematics Quarter 4JOYLYNSAMANIEGO
 
ANG SEKTOR NG agrikultura.pptx QUARTER 4
ANG SEKTOR NG agrikultura.pptx QUARTER 4ANG SEKTOR NG agrikultura.pptx QUARTER 4
ANG SEKTOR NG agrikultura.pptx QUARTER 4MiaBumagat1
 
Active Learning Strategies (in short ALS).pdf
Active Learning Strategies (in short ALS).pdfActive Learning Strategies (in short ALS).pdf
Active Learning Strategies (in short ALS).pdfPatidar M
 
GRADE 4 - SUMMATIVE TEST QUARTER 4 ALL SUBJECTS
GRADE 4 - SUMMATIVE TEST QUARTER 4 ALL SUBJECTSGRADE 4 - SUMMATIVE TEST QUARTER 4 ALL SUBJECTS
GRADE 4 - SUMMATIVE TEST QUARTER 4 ALL SUBJECTSJoshuaGantuangco2
 
Influencing policy (training slides from Fast Track Impact)
Influencing policy (training slides from Fast Track Impact)Influencing policy (training slides from Fast Track Impact)
Influencing policy (training slides from Fast Track Impact)Mark Reed
 
INTRODUCTION TO CATHOLIC CHRISTOLOGY.pptx
INTRODUCTION TO CATHOLIC CHRISTOLOGY.pptxINTRODUCTION TO CATHOLIC CHRISTOLOGY.pptx
INTRODUCTION TO CATHOLIC CHRISTOLOGY.pptxHumphrey A Beña
 
ROLES IN A STAGE PRODUCTION in arts.pptx
ROLES IN A STAGE PRODUCTION in arts.pptxROLES IN A STAGE PRODUCTION in arts.pptx
ROLES IN A STAGE PRODUCTION in arts.pptxVanesaIglesias10
 
Virtual-Orientation-on-the-Administration-of-NATG12-NATG6-and-ELLNA.pdf
Virtual-Orientation-on-the-Administration-of-NATG12-NATG6-and-ELLNA.pdfVirtual-Orientation-on-the-Administration-of-NATG12-NATG6-and-ELLNA.pdf
Virtual-Orientation-on-the-Administration-of-NATG12-NATG6-and-ELLNA.pdfErwinPantujan2
 
Choosing the Right CBSE School A Comprehensive Guide for Parents
Choosing the Right CBSE School A Comprehensive Guide for ParentsChoosing the Right CBSE School A Comprehensive Guide for Parents
Choosing the Right CBSE School A Comprehensive Guide for Parentsnavabharathschool99
 
ECONOMIC CONTEXT - PAPER 1 Q3: NEWSPAPERS.pptx
ECONOMIC CONTEXT - PAPER 1 Q3: NEWSPAPERS.pptxECONOMIC CONTEXT - PAPER 1 Q3: NEWSPAPERS.pptx
ECONOMIC CONTEXT - PAPER 1 Q3: NEWSPAPERS.pptxiammrhaywood
 
How to Add Barcode on PDF Report in Odoo 17
How to Add Barcode on PDF Report in Odoo 17How to Add Barcode on PDF Report in Odoo 17
How to Add Barcode on PDF Report in Odoo 17Celine George
 
What is Model Inheritance in Odoo 17 ERP
What is Model Inheritance in Odoo 17 ERPWhat is Model Inheritance in Odoo 17 ERP
What is Model Inheritance in Odoo 17 ERPCeline George
 

Recently uploaded (20)

Difference Between Search & Browse Methods in Odoo 17
Difference Between Search & Browse Methods in Odoo 17Difference Between Search & Browse Methods in Odoo 17
Difference Between Search & Browse Methods in Odoo 17
 
Music 9 - 4th quarter - Vocal Music of the Romantic Period.pptx
Music 9 - 4th quarter - Vocal Music of the Romantic Period.pptxMusic 9 - 4th quarter - Vocal Music of the Romantic Period.pptx
Music 9 - 4th quarter - Vocal Music of the Romantic Period.pptx
 
4.18.24 Movement Legacies, Reflection, and Review.pptx
4.18.24 Movement Legacies, Reflection, and Review.pptx4.18.24 Movement Legacies, Reflection, and Review.pptx
4.18.24 Movement Legacies, Reflection, and Review.pptx
 
Full Stack Web Development Course for Beginners
Full Stack Web Development Course  for BeginnersFull Stack Web Development Course  for Beginners
Full Stack Web Development Course for Beginners
 
Keynote by Prof. Wurzer at Nordex about IP-design
Keynote by Prof. Wurzer at Nordex about IP-designKeynote by Prof. Wurzer at Nordex about IP-design
Keynote by Prof. Wurzer at Nordex about IP-design
 
4.16.24 21st Century Movements for Black Lives.pptx
4.16.24 21st Century Movements for Black Lives.pptx4.16.24 21st Century Movements for Black Lives.pptx
4.16.24 21st Century Movements for Black Lives.pptx
 
Daily Lesson Plan in Mathematics Quarter 4
Daily Lesson Plan in Mathematics Quarter 4Daily Lesson Plan in Mathematics Quarter 4
Daily Lesson Plan in Mathematics Quarter 4
 
ANG SEKTOR NG agrikultura.pptx QUARTER 4
ANG SEKTOR NG agrikultura.pptx QUARTER 4ANG SEKTOR NG agrikultura.pptx QUARTER 4
ANG SEKTOR NG agrikultura.pptx QUARTER 4
 
Active Learning Strategies (in short ALS).pdf
Active Learning Strategies (in short ALS).pdfActive Learning Strategies (in short ALS).pdf
Active Learning Strategies (in short ALS).pdf
 
GRADE 4 - SUMMATIVE TEST QUARTER 4 ALL SUBJECTS
GRADE 4 - SUMMATIVE TEST QUARTER 4 ALL SUBJECTSGRADE 4 - SUMMATIVE TEST QUARTER 4 ALL SUBJECTS
GRADE 4 - SUMMATIVE TEST QUARTER 4 ALL SUBJECTS
 
YOUVE GOT EMAIL_FINALS_EL_DORADO_2024.pptx
YOUVE GOT EMAIL_FINALS_EL_DORADO_2024.pptxYOUVE GOT EMAIL_FINALS_EL_DORADO_2024.pptx
YOUVE GOT EMAIL_FINALS_EL_DORADO_2024.pptx
 
Influencing policy (training slides from Fast Track Impact)
Influencing policy (training slides from Fast Track Impact)Influencing policy (training slides from Fast Track Impact)
Influencing policy (training slides from Fast Track Impact)
 
INTRODUCTION TO CATHOLIC CHRISTOLOGY.pptx
INTRODUCTION TO CATHOLIC CHRISTOLOGY.pptxINTRODUCTION TO CATHOLIC CHRISTOLOGY.pptx
INTRODUCTION TO CATHOLIC CHRISTOLOGY.pptx
 
ROLES IN A STAGE PRODUCTION in arts.pptx
ROLES IN A STAGE PRODUCTION in arts.pptxROLES IN A STAGE PRODUCTION in arts.pptx
ROLES IN A STAGE PRODUCTION in arts.pptx
 
Virtual-Orientation-on-the-Administration-of-NATG12-NATG6-and-ELLNA.pdf
Virtual-Orientation-on-the-Administration-of-NATG12-NATG6-and-ELLNA.pdfVirtual-Orientation-on-the-Administration-of-NATG12-NATG6-and-ELLNA.pdf
Virtual-Orientation-on-the-Administration-of-NATG12-NATG6-and-ELLNA.pdf
 
Choosing the Right CBSE School A Comprehensive Guide for Parents
Choosing the Right CBSE School A Comprehensive Guide for ParentsChoosing the Right CBSE School A Comprehensive Guide for Parents
Choosing the Right CBSE School A Comprehensive Guide for Parents
 
ECONOMIC CONTEXT - PAPER 1 Q3: NEWSPAPERS.pptx
ECONOMIC CONTEXT - PAPER 1 Q3: NEWSPAPERS.pptxECONOMIC CONTEXT - PAPER 1 Q3: NEWSPAPERS.pptx
ECONOMIC CONTEXT - PAPER 1 Q3: NEWSPAPERS.pptx
 
How to Add Barcode on PDF Report in Odoo 17
How to Add Barcode on PDF Report in Odoo 17How to Add Barcode on PDF Report in Odoo 17
How to Add Barcode on PDF Report in Odoo 17
 
What is Model Inheritance in Odoo 17 ERP
What is Model Inheritance in Odoo 17 ERPWhat is Model Inheritance in Odoo 17 ERP
What is Model Inheritance in Odoo 17 ERP
 
YOUVE_GOT_EMAIL_PRELIMS_EL_DORADO_2024.pptx
YOUVE_GOT_EMAIL_PRELIMS_EL_DORADO_2024.pptxYOUVE_GOT_EMAIL_PRELIMS_EL_DORADO_2024.pptx
YOUVE_GOT_EMAIL_PRELIMS_EL_DORADO_2024.pptx
 

Visualizing Data: Infographic Assignments across the Social Work Curriculum

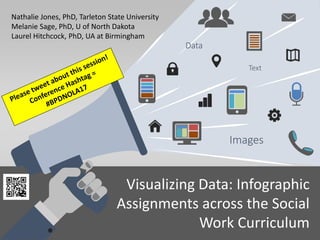
  • 1. Visualizing Data: Infographic Assignments across the Social Work Curriculum Text Images Data Nathalie Jones, PhD, Tarleton State University Melanie Sage, PhD, U of North Dakota Laurel Hitchcock, PhD, UA at Birmingham
  • 2. Learning Objectives By the end of this presentation we’ll teach you these things…. Recognize how infographic tools can be incorporated into assignments for social work courses. Understand how the use of social media as a teaching tool in undergraduate courses can be used to develop and assess social work competencies. Appreciate the role of collaboration to support the development and implementation of technology-based assignments in social work education.
  • 3. Why use infographics in the Social Work classroom? Develop key digital literacy skills Effective way to communicate Increasingly popular
  • 4. What is an infographic? Visual images and writing put together to explain/tell a story
  • 5.
  • 6. Considerations for Digital Storytelling Hardware Software Techniques Outputs Ethics Smartphone Phone apps Record in quiet space Health messages Informed consent Video camera Storify Test sound quality Infographics Institutional review Audio Recorder Piktochart Use text to caption video Video shorts Professionalism Laptop/Desktop Powerpoint for slideshows Train participants to use technology Audio stories Confidentiality Microphone audacity Attention span 3-5 minutes Photo exhibits Student privacy
  • 8. Infographic Assignment The Basics Infographic Assignment First Step Prepare for the Assignment. Second Step Learn the Technology Third Step Make your Infographic. Fourth Step Share your Infographic Fifth Step Reflection
  • 9. Learning Outcomes: • Create an infographic that provides awareness and/or describes preventative measures related to a social problem • Conduct research to identify statistics, resources and other data relevant to a social problem • Conduct research to identify statistics, resources and other data relevant to a social problem • Demonstrate communication and advocacy skills by sharing and promoting one’s infographic via social media Step 1: Prep for the assignment Instructor introduces infographics and purpose of their use. Offers some quality measures. Students review some infographics. Choose a good one about a social-work-related topic to share (on a blog? In class? Blackboard? brief reflection on what you like/don’t?) Rate it against the class rubric Choose your topic. (We will have specific topics related to our courses, ie policy, mental health, etc) Find a research article (for practice topics) or legislative policy related to the topic. Carefully select some main points that you want to share visually. • Identify stakeholders for this topic, and choose an audience. It could be consumers, parents, practitioners, policy makers, social workers, students, etc. • Main points should highlight data, milestones, thesis statements, major findings, or key indicators that help offer the specific audience key information in a way that is accessible and important to them. • What images will help you visually represent these ideas? Imagine what picture or graphic will help you tell your story Step 2: Learn the technology Instructor will share YouTube videos of the use of Piktochart and VennGage, free infographic creators. Students will make time to seek extra help if necessary Step 3: Make your infographic and get feedback First draft infographic should first be rated by a peer using the class rubric (post at blackboard) Next step: email a stakeholder (author of article cited, policy maker, or other expert related to your chosen topic) and ask for feedback about clarity, accuracy, and usefulness of your infographic Step 4: Share your infographic Choose at least one Twitter hashtag relevant to your topic, and share your infographic via Twitter using this hashtag Consider sharing several times over several days, tag people in the infographic who tweet on this topic Consider what other strategies you would use if this were a public awareness campaign for an agency you represent Step 5: Reflection Which class infographic got the most shares and why? Which was viewed by the biggest audience and why? What is the value of social networks to social workers who have advocacy roles? Reflect on your learning related to (each practice behavior….. ) What else did you learn? Which of these skills do you expect to use in the future? Bonus: (Prize/extra credit for class-selected best? Most shared?) Extra credit for survey?
  • 10. Assignment Specific Blurbs from our Syllabi Peer rating rubric
  • 11. SOCW 3320: Service Learning at TSU Nathalie’s Assignment • The purpose of this infographic assignment is to help students practice advocacy & brokering skills as it relates to a human service issue and/or topic identified by the team/group. • Students are expected to create an infographic that provides statistics and/or facts on a chosen social problem as it relates to a particular population. • Additional details provided & discussed during class.
  • 12. SW 422: Social Work Practice II at UAB Laurel’s Assignment • Infographics topics: • Non-profit Agency • Community Assets • Peer-reviews • Sharing on Twitter & Service Learning Partners
  • 13. SWK 317: Social Work Research at UND Melanie’s Assignment • Infographics topic: • Find a research paper to turn in to an infographic • Include the research question, population, main data points, outcome, implications • Include APA citation • Peer-reviews to assure purpose, visualization, reference, and writing goals are achieved
  • 14. Our Research Collaboration INPUT Independently working on infographic assignments Connected through Twitter Collaborative development research questions PROCESS Created a master infographic assignment Designed our SOTL study Student Survey #VisualSW OUTPUT Students from three different institutions creating infographics on different topics Data on student learning across demographics
  • 15. Our Research Questions Can the use of infographics contribute to student learning about technology and about social work? If so, How? What factors have a positive and/or negative effect on the implementation of an infographic assignment? What differences do students perceive between an infographic assignment and a writing assignment?
  • 16. Survey Approved by IRB at UND In non-technical language describe the purpose of the study and state the rationale for this research. This study will investigate the experience of undergraduate students in completing infographic assignments in social work courses across the curriculum and in multiple program across the US. The assignment involves students creating a visual product with text and images about a topic relevant to a social work course. A copy of this assignment is attached. We will assess both the process and the outcome of the assignment, gathering data that are informative for faculty and others who are engaging in similar instructive activities as well as the impact of the project on the student participants. Findings will include student-identified outcomes; successes and challenges of the implementation of the assignment; and empirically-supported suggestions for pedagogical best practices. The overall research question for this project is: Can the use of infographics contribute to student learning about technology and about social work? In non-technical language, please describe the study. Students will complete the assignment as part of a course requirement as well as a required post- assignment assessment survey (see attached). Our research involves analyzing the anonymous results of the required survey. No student names will be used during analysis and identifiers will not be recorded on a master list. Students may not opt out of the assignment or post-survey, but the decision to let researchers analyze their data is voluntary. Students will receive information about the study along with the survey and may opt out of the study by checking a box at top of the survey instruments.
  • 17. Quantitative Results Student Demographics (N = 59) UND (n = 15) UAB (n =20) TSU (n=24) Total (N= 59) Average Age 24.5 years 25 years 33 years 28 years Female 13 (86%) 18 (90%) 18 (75%) 53 (90%) Non- Traditional Student 4 (27%) 5 (25%) 18 (75%) 27 (36%) UND = University of North Dakota UAB = University of Alabama at Birmingham TSU = Tarleton State University
  • 18. Quantitative Results How comfortable are you with technology? (n = 59) Question How comfortable are you with technology? How comfortable were you with creating infographics prior to this assignment? Extremely comfortable 22 (37.3%) 2 (3.3%) Moderately comfortable 26 (44.1%) 7 (11.8%) Slightly comfortable 8(13.6%) 9 (15.3%) Neither comfortable nor uncomfortable 2 (3.4%) 14 (23.7%) Slightly uncomfortable 1 (1.7%) 10 (17.0%) Moderately uncomfortable 0 (0.0%) 7 (11.8%) Extremely uncomfortable 0 (0.0%) 10 (17.0%)
  • 19. Quantitative Results How valuable was this assignment to your learning about…. (n= 56)? How valuable was this assignment in teaching…. Very valuable mostly valuable moderately valuable only a little bit valuable Not very valuable ...how to interpret and communicate about a social work topic? 30 (54%) 18 (32%) 5 (9%) 1 (2%) 2 (5%) ...presenting statistics, resources and other data? 31 (55%) 14 (25%) 8 (14%) 0 (0%) 3 (5%) ...communication and advocacy skills ? 34 (61%) 13 (23%) 6 (11%) 1 (2%) 2 (5%)
  • 20. Qualitative Results THEME #1 Technology Use Pro Very easy to use! Pro “I found it easy to complete, the professor did a great job at giving resources for the project.” Con “Some app-related issues; switched to a different site instead.” Con “Was a slow website to use on my tablet and glitches a lot so I went to a campus computer lab to finish it.”
  • 21. Qualitative Results THEME #2 Assignment Style Pro “I loved this assignment. I would much rather create an infographic rather than writing a paper” Pro “I would have rather done the infographic than write a paper. I feel like, with the infographic you have to research a topic and write what you think is most relevant to share with others.” Con “It did not have an impact of learning in this assignment in comparison to other assignments in the class.” Con “This assignment was kind of difficult to me because I am not majoring in social work.”
  • 22. Qualitative Results THEME #3 Pro “Having something tangible that uses the skills and advocates for the cause you are supporting couldn't be matched in a paper or a PowerPoint.” Pro “An infographic grabs the reader's attention faster than viewing a written paper or taking the time to view a PowerPoint presentation. Infographics are compact and the data is clearly stated.” Con “To be honest, I would have written a paper instead, because of how time consuming it was. I am glad that I know how to create one though.” Con “It was more time consuming because you spend most of your time formatting and making it look pretty then actually doing the research.” Learning Outcomes
  • 23. Discussion/Lessons Learned Nathalie • Provide additional tech support during class. • Additional class discussion on steps. • Combine steps that seem to be somewhat simple. • Explain each step prior to the due date to ensure clarity. Melanie • Start early- this assignment has lots of pieces. • Provide in-class time for practice, group work, in- person trouble-shooting. • Shorten videos/use videos outside of class. Laurel • Connect assignment with digital literacy • Review an infographic before creating one • Connect assignment to real-world experiences • Model
  • 24. Questions? Nathalie P. Jones, PhD, MSW Assistant Professor Tarleton State University njones@Tarleton.edu @DrNJonesTSU Laurel Iverson Hitchcock, PhD, MPH, LICSW, PIP Assistant Professor University of Alabama at Birmingham (UAB) lihitch@uab.edu @laurelhitchcock Melanie Sage, PhD, LICSW Assistant Professor University of North Dakota Melanie.Sage@und.edu @melaniesage Access slides and other info from this presentation: http://www.laureliversonhitchcock.org/2017/02/24/bp dnola17infographics/
  • 25. References Centers for Disease Control & Prevention. (n.d.). Infographics. Retrieved May 21, 2016, from http://www.cdc.gov/socialmedia/tools/infographics.html Council on Social Work Education. (2015). Educational Policy and Accreditation Standards. Washington, DC: Author. Dyjur, P., & Li, L. (2015). Learning 21st Century Skills by Engaging in an Infographics Assessment. In Proceedings of the IDEAS: Designing Responsive Pedagogy (pp. 62–71). University of Calgary. Retrieved from http://dspace.ucalgary.ca/bitstream/1880/50860/1/7%20Learning%2021st%20-%20Dyjur%20%26%20Li.pdf Joosten, T. (2012). Social media for educators: strategies and best practices. San Francisco: Jossey-Bass. Kos, B. A., & Sims, E. (2014). Infographics: The New 5-Paragraph Essay. In 2014 Rocky Mountain Celebration of Women in Computing. Laramie, WY, USA. Retrieved from http://scholar.colorado.edu/cgi/viewcontent.cgi?article=1001&context=atlas_gradpapers Martix, S., & Hodson, J. (2014). Teaching with infographics: practicing new digital competencies and visual literacies. Journal of pedagogic development, 4 (2). Retrieved from: http://www.beds.ac.uk/jpd/volume-4-issue- 2/teaching-with-infographics

Editor's Notes

  1. Nathalie
  2. Laurel
  3. Melanie
  4. Melanie
  5. Melanie
  6. Melanie
  7. Nathalie
  8. I know I put the whole thing in here and its too much for a slide, but maybe good reference point for the blog- we can move through this quickly
  9. Nathalie (I wanted to show the rubric used for them to rate one another) *This was my favorite step, please help if this looks tacky.
  10. Nathalie
  11. Laurel Mission statement, goals and/or objectives of the organization Client population served by the organization Services and programs provided by organization One interesting fact or piece of information that is unique to the organization Contact information for the agency
  12. Laurel include the research questions or add
  13. Can the use of infographics contribute to student learning about technology and about social work? If so, How? What factors have a positive and/or negative effect on the implementation of an infographic assignment? What differences do students perceive between an infographic assignment and a writing assignment?
  14. Laurel
  15. Laurel Only three students had created an infographic prior to the assignment 11 students or 19% sought help with the assignment - What were their skills before the assignment? Who was more comfortable and the value – compare older vs. younger: Myth Busting
  16. Laurel How valuable was this assignment for your learning
  17. Nathalie – Technology challenges; three pro and con or two pros and two cons – note that the feedback is overwhelming positive
  18. Nathalie – How is this assignment differ from more traditional assignments?
  19. Nathalie – Learning Outcomes
  20. Challenges Tips Laurel: 1) The why before the what
  21. Bitmojis Laurel Iverson Hitchcock, PhD, MPH, LICSW, PIP Assistant Professor University of Alabama at Birmingham (UAB) lihitch@uab.edu @laurelhitchcock Nathalie P. Jones, PhD, MSW Assistant Professor Tarleton State University njones@Tarleton.edu @DrNJonesTSU
  22. Do we have references?