Linear Trend Analysis of Grades Over Time
•Als DOCX, PDF herunterladen•
0 gefällt mir•108 views

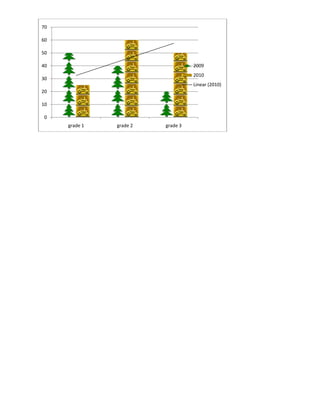
This graph shows test scores for two years, 2009 and 2010, across three grade levels. Scores increased from 2009 to 2010 for all three grades. A linear trend line indicates that if the trend continues scores will continue increasing each year for every grade level.

Empfohlen
Weitere ähnliche Inhalte
Andere mochten auch
Andere mochten auch (12)
Linear Trend Analysis of Grades Over Time
- 1. 70 60 50 40 2009 2010 30 Linear (2010) 20 10 0 grade 1 grade 2 grade 3