
Empfohlen
Empfohlen
Weitere ähnliche Inhalte
Ähnlich wie Developing Marketing Strategy for the Bhutan Telecom Limited by Applying Net Promoter Score NPS
Ähnlich wie Developing Marketing Strategy for the Bhutan Telecom Limited by Applying Net Promoter Score NPS (20)
Mehr von ijtsrd
Mehr von ijtsrd (20)
Kürzlich hochgeladen
Kürzlich hochgeladen (20)
Developing Marketing Strategy for the Bhutan Telecom Limited by Applying Net Promoter Score NPS
- 1. International Journal of Trend in Scientific Research and Development (IJTSRD) Volume 7 Issue 4, July-August 2023 Available Online: www.ijtsrd.com e-ISSN: 2456 – 6470 @ IJTSRD | Unique Paper ID – IJTSRD59713 | Volume – 7 | Issue – 4 | Jul-Aug 2023 Page 472 Developing Marketing Strategy for the Bhutan Telecom Limited by Applying Net Promoter Score (NPS) Dr. Tshering Phuntsho Senior Lecturer, Norbuling Rigter College, Paro, Bhutan ABSTRACT The study of Bhutan Telecommunication Limited has been carried out as part of my research work in order to develop a ‘Marketing strategy’ and also to find the risk pertaining the marketing and product department. The Company has been doing fairly with 72% market share being captured after twenty years of establishment in the year 2003. The company is more ambitious in not just retaining an existing market share but acquiring new customers to broaden its market horizon. But it is not without problems as the company is having difficulty in retaining the customers as desired. The customer’s dissatisfaction rate is high with both customer care services and data (internet) services which is an alarming issue. my work addresses the outlying issues and proposes a plan aligning with the strategic vision of the company. Therefore, satisfaction has been a strong field of interest to both organization and researcher. Customers always remain important stakeholders and their satisfaction is an utmost priority of an organization. The ‘quality of service’ becomes guiding fact and it is important to measure customer satisfaction by quantifying the variables. The methodology has been adopted using two statistical tools; Net Promoter Score (NPS) and Likert Scale. An effort has been made by the researcher to understand the problem as well make the findings and recommendations most appropriate for the marketing and development researcher. How to cite this paper: Dr. Tshering Phuntsho "Developing Marketing Strategy for the Bhutan Telecom Limited by Applying Net Promoter Score (NPS)" Published in International Journal of Trend in Scientific Research and Development (ijtsrd), ISSN: 2456-6470, Volume-7 | Issue-4, August 2023, pp.472-484, URL: www.ijtsrd.com/papers/ijtsrd59713.pdf Copyright © 2023 by author (s) and International Journal of Trend in Scientific Research and Development Journal. This is an Open Access article distributed under the terms of the Creative Commons Attribution License (CC BY 4.0) (http://creativecommons.org/licenses/by/4.0) KEYWORDS: BTL, TC, BICMA, MoIC 1. INTRODUCTION 1.1. Bhutan Telecommunication Limited (BTL) The Bhutan Telecom Limited is one of the oldest Telecommunication Company in Bhutan which provides B-Mobile services, Internet Services and Fixed Line Services. The establishment of DHIunder the Royal Charter in November, 2007 saw DHI hold and manage SOE and make new investments on behalf of RGoB, prioritizing its focus and continuous improvement in customer services in its subsidiary, one of them being Bhutan Telecom Corporation Limited (Telecom). Bhutan Telecom Ltd introduced the internet services on June 2, 1999 and voice services on November 11, 2003. Today, cellular mobile services are provided by both Bhutan Telecom Limited and Tashi Cell, with the exception of Bhutan Telecom, all other internet service providers (ISPs) are private sector ventures. The Bhutan InfoComm for Media Authority (BICMA) and Ministry of Information and Communications (MoIC) regulates the telecom industry. The regulators are looking into the possibility of introducing a third player by 2021, which would only intensify the competitiveness among telecom service operators in the telecommunication industry. 1.2. Importance of Developing Marketing Strategy The Bhutan Telecom Limited is one of the oldest Telecommunication Company in Bhutan, which offers a wide range of services catering the needs of present and potential customers irrespective of their age, gender, creed and covering largest geographical area of mobile and data network in Bhutan that allowed it to capture approximately 72% plus market share of telecommunication sector of Bhutan. Telecommunication in Bhutan has witnessed upheaval growth in cellular; Internet Services and Fixed Line Services, internet and communications over the last decade. Perhaps the drivers of change as witnessed have been economic structure, competition IJTSRD59713
- 2. International Journal of Trend in Scientific Research and Development @ www.ijtsrd.com eISSN: 2456-6470 @ IJTSRD | Unique Paper ID – IJTSRD59713 | Volume – 7 | Issue – 4 | Jul-Aug 2023 Page 473 and technology. In the era of globalization, the entry of private players as competitor intense the competition in the current telecommunication market of Bhutan, that led Bhutan Telecom Limited to face challenges in offering and meeting the new upcoming needs and wants of the present and prospective customer. 1.3. Marketing strategies used by Bhutan Telecom Limited Bhutan Telecom Limited has been investing huge on advertising its product or services and mobile phone services. Broadcast Telecom, radio and print media are other areas where the company is putting relentless efforts to advertise and create awareness about its product or services. 1.4. Bhutan Telecom Limited’s Functional Strategies BTL’s strategies to promote its product or services at the functional level include: Special data plans: daily & weekly Talk more at Reducing call rates GSM Phone Sales Campaigns Creation of Business centers around the college areas Distributor awards Sponsors of Druk Super star, sports, Film fare awards, cleaning campaigns Speed of data is the key factor for the company’s success Leveraging the brand value and creating innovation. National Event Offers and Dzongkhag Event Offers 1.5. Problem Statement In the era of globalization and Technological advancements, customers’ expectations and aspiration are continuously on the rise which demands Bhutan Telecom Limited for not only product improvisation and competitive pricing but also demands an innovative marketing strategy along with CRM that can ensure Bhutan Telecom Limited to remain at the driver’s seat and keep growing with paradigm shift in its approach towards marketing unique products and services such as 4G Data Services, E-load, Paper Voucher, B-Wallet, etc. require the exhaustive study of the market of Bhutan Telecom Limited. 1.6. Research Objectives 1.6.1. Performance of service marketing mix and its consistency to the marketing strategy of Bhutan Telecom Limited in the globalized market scenario. 1.6.2. Can a better marketing strategy be designed and is executable under the existing globalized market scenario? 1.7. Significance The purpose of this study is to develop a Marketing Strategy to meet the present and potential challenges along with its current performances in terms of the service marketing mix of Bhutan Telecom Limited. This study further identifies the risk and opportunities pertaining to marketing of telecommunication and data services to meet the marketing objectives of the Bhutan Telecom impacting customer satisfaction and benchmarking performance. 1.8. Scope of the study Following is detail proposed project scope and significance: 1.8.1. The researcher shall dedicate best services by developing marketing strategy to meet the present and potential challenges considering the current performances in terms of the service marketing mix and marketing plan. 1.8.2. To identify risk pertaining to marketing of telecommunication and data services in short and long term along with recommendations to meet the marketing objectives of the Bhutan Telecom. 1.8.3. The researcher shall focus on developing a logical framework with the help of 7Ps and NPS for consumer acquisition, retention and complain management through CRM or E- CRM. 2. Literature Review 2.1. Service Marketing Mix (7P’s) Product or services are the business core offerings to the perspective customers onto which many businesses dwell in providing standardized and quality product or services to enjoy economies of scale or market shares. In the telecom industry, the effort should be to satisfy customers since they are bound with more benefits and values from the product or services. Bhutan Telecom Limited has end number of products offered to customers such as 3G Data Services, E-load, Paper Voucher, B-Wallet, etc. Be it tangible or intangible, product should not just remain as product, and it has to be supported by good service and the marketed with attentions of the customers (Kotler P. &., 2013). Price of a product or service is in many ways that marketers directly communicate. The customers are very sensitive about the prices of products which they are offered. How the products are priced and charged to the customers determine the satisfaction level of customers (Levesque, 1996).
- 3. International Journal of Trend in Scientific Research and Development @ www.ijtsrd.com eISSN: 2456-6470 @ IJTSRD | Unique Paper ID – IJTSRD59713 | Volume – 7 | Issue – 4 | Jul-Aug 2023 Page 474 A study on customer perceptions of price (value) of a product or service in the service industries showed that the customer’s satisfaction is directly affected by the price of the products. So, price (value) of a product has to be attractive and reasonable enough to please the customers. The product or service of telecom operator, in essence the Bhutan Telecom Ltd, has to be appealing and affordable by the customers (Varki, 2001). Promotion alone cannot give customers satisfaction about a product or service. It needs to involve strong promotional messages that would also enlighten and educate the customers. In fact, sales promotion of telecommunication sector, particularly Bhutan Telecom Limited, should include giving incentives such discounts and tariffs to customers (Bena, 143- 150). People factor in delivery of product or service plays a vital role. Customer’s satisfaction is linked with the interpersonal behavior, discretion in rendering the service and trainings of people or service providers. In sectors like telecommunication where offering better services is the only key to company success and increase sales, the level of training of an employee, attitudes, behavior and his or her appearances matter a lot. The key driver of satisfaction to customers is service employee’s service orientation (Thorsten, 2004). The service producer and their employee’s interactions have important bearing on the customer satisfaction and customer’s perception of service quality. Besides, the satisfaction of customer and their loyalties in telecommunication sector and other service sectors is further driven by empathy (interaction of employees with customers) from the employees or service provider (McDoughall, 1994). Process is another important attribute which involves procedures to reach product or service to the customers. In a service sector where the rendering of service procedure is not technology driven, the need for employee by customers is very important. It could be from the service center, retail outlet where it is accessible to customers. On the other side, where Bhutan Telecom Limited have made its product or service accessible through websites of organization and online recharging. Therefore, these websites need to be user friendly and efficient for customers to use (Harington, 2009). The major setback faced by the telecommunication sector in delivering their product or service is because of the unsynchronized processes and therefore, they need to create good service process to keep customers satisfied and target new potential customers. The service provider needs to establish the conducive relationship between the process and the customer satisfaction (Jamal, 2002). For service sectors like Bhutan Telecom Limited, physical facilities in the regions, customers care center at various retail outlets should be flexed, free to have exposure and explore to beyond their behavior, buying choices and draw satisfaction level. Because the physical facilities have an impact on the perceived quality of services offered (Gan, 2011). 2.2. Service Quality Providing quality services in the service sectors have become increasingly important. Service quality is the comparison between customer’s expectation and performance. It allows assessing how well the services offered to customers are able to meet their expectations. The telecom service providers need to assess the service quality they are offering in order to improve their services, and also identifythe problems associated with their services to provide better customer satisfactions (Agarwal, Deepak Singh, & K S Thakur, 2013). Two very important concepts that telecom service providers must understand to remain competitive and keep on growing is service quality and customer satisfaction. For sustainable competitive advantage, it is very important to deliver high quality services for customer satisfaction has direct and positive effect on the profitability of an organization. It is the satisfied customers who form the foundation of any successful business since the customers who are satisfied leads to not only repeat purchase but are brand loyalty and also positive word of mouth (Angelova & Jusuf Zekiri, 2011). Service quality is one of important aspects to the measure customer’s satisfaction level. It is not easy to measure like quality of products which can be objectively measured that indicates like number of defects and durability. But service quality has three features like intangibility, heterogeneity, inseparability of production as well as consumption. So, in absence of objective measures, service quality of a firm is assessed through the measure of consumers’ perceptions of quality (Parasuraman, Zeithaml, & Berry, 1985). According to Brown and Swartz (1989), the companies that provide high service quality are more preferred and valued by customers. The quality in products and services has become a drive concern for all the telecom service providers since customer’s judge service quality relative to what they want by way of comparing their perceptions of service
- 4. International Journal of Trend in Scientific Research and Development @ www.ijtsrd.com eISSN: 2456-6470 @ IJTSRD | Unique Paper ID – IJTSRD59713 | Volume – 7 | Issue – 4 | Jul-Aug 2023 Page 475 experience with their expectations (Brown, Swartz, & Cronin, 1989). The service quality essentially gives an organization a competitive advantage in a long term and therefore, a company should not allow its rivals outperform in the market. Similarly, Bhutan Telecom Limited should measure its service quality performance using a set of standards against its rivals to know whether it is doing well and meeting the stiff competition or it is outperformed by the rivals (T.J.Brown, 1997). A massive change has undergone over the years in the telecommunication industry due to the advancement of latest technology but there is more emphasis to be given on service quality, especially in the telecom sector. To retain existing customers, mobile companies and telecom sectors need to focus on service quality and add more value to its product or services (Aydin, 2005). It is important to place more emphasis for service providers to focus on retaining and offering better services to the existing customers. The telecom service providers across the world face challenges to provide better services and retaining existing customers due to mature markets and stiff competitions (Braff Adam, 2003). For Bhutan Telecom Ltd, the existing customers are expected to be the ones from whom a telecom service provider would maintain consistency in generating Average Revenue per User (ARPU), with new customers likely to have a feeling of migrated from other service providers (T.V.Ramchandran, 2005). Since customers are price sensitive and the type of services offered especially the speed of the data services, the Telecom Industry, in essence Bhutan Telecom, need to analyze its performance on volume base rather than margins. Because the socio- demographic factors increase GDP growth, rising level of income, the fast-growing urbanization and booming knowledge sector, are the main contributing factors for the growth of the Telecom Industry. Since most consumer segments for Bhutan Telecom Ltd are youth segment and business segments, the service providers should look for new initiatives in offering services to customers such as coming up with new schemes under data plan, loyalty rewards, and business solutions and talk time schemes (Mukesh Chaturvedi, 2005). Bhutan Telecommunication Industry at present has only two players competing on the same product or services and it is already witnessing a stiff competition in various telecom services like mobile, internet data, B-Wallet and other services. And with a new player entering the market a decade back, the competition can only become stiffer, which will result in telecom service providers to go with lower tariffs and focus on offering better quality services. Therefore, it needs to focus more on its existing subscribers to provide them better services (Infrastructure, 2005). In a competitive Telecom market, it’s important to use differentiator program such as customer loyalty program because this effort plays important role for a Telecom service provider like Bhutan Telecom who already enjoy greater market share to attract the new customers and retain the current ones. Another reason for customer loyalties is that with increasing consumers’ choices and as it expands, it’s important for service provider to focus on maintaining sound customer relationship strategy for achieving its success (Kazman, 2008). A study conducted by on “Drivers of Customer Satisfaction in Indian Cellular Services Market” indicated that every cellular user’s satisfaction is impacted by the service quality offered to them by the service provider. Therefore, adding new features into existing 3G data services for Bhutan Telecom Ltd is important to keep the customers alive (Ganguli, 2008). The mobile phones user and choices are common among the youth, age ranging from 16-20, and further females were found to be more addictive users which are common among females. The study has shown that male users were more technology enthusiasm and trend consciousness. The above study attributes that in the telecom service choice, gender has become more alike and it is easier to identify the consumption patterns of an individual by (Wilska, 2001). In the article about telecom service brands, it was found out that self-knowledge in consumers would influence in choosing a particular telecom service brand. Most customers look for attributes like service features, access cost, connection fee, call rate, and free calls, cell to cell phone rates, related to mobile. In fact, the smart people in choosing a particular product are those who already have prior experience of using the mobile services (Requelme, 2001). The quality of products and service has become a multi-dimensional phenomenon in the corporate world today. Under this process, three service qualities include output technical quality, organisation’s mental picture and service performance quality (Gronroos, 2000), (Parasuraman, Zeithaml, & Berry, 1985). Providing quality services in the service sectors have become increasingly important. Service quality is the
- 5. International Journal of Trend in Scientific Research and Development @ www.ijtsrd.com eISSN: 2456-6470 @ IJTSRD | Unique Paper ID – IJTSRD59713 | Volume – 7 | Issue – 4 | Jul-Aug 2023 Page 476 comparison between customer’s expectation and performance. It allows assessing how well the services offered to customers are able to meet their expectations. The telecom service providers need to assess the service quality they are offering in order to improve their services, and also identifythe problems associated with their services to provide better customer satisfactions (Agarwal, Deepak Singh, & K S Thakur, 2013), (Angelova & Jusuf Zekiri, 2011). According to Brown and Swartz (1989), the companies that provide high service quality are more preferred and valued by customers. The quality in products and services has become a drive concern for all the telecom service providers for customer’s judge service quality relative to what they want by way of comparing their perceptions of service experience with their expectations (Brown, Swartz, & Cronin, 1989). 3. Research Methodology 3.1. Sampling Design Since the population is well defined as the end mobile service users, for the purpose of study prima facie, the convenience sampling technique with sampling size determination of 365 for consumers and focus groups for channel partners sound appropriate and used for collecting information. Besides, based on the homogeneity and identified population size as an approximately 6 lakh end users etc. and considering 95% confidence interval with ± Ngultrum hundred as accepted error, the sample size has been determined. 3.2. Data Collection Method The both Primary and secondary data have been used for obtaining the statistical inferences and the data so obtained had the suitable consideration of the diverse demographic profile of Bhutan. To study the Bhutan Telecom Limited-service users and problems associated with the Bhutan Telecom Limited products, the researcher has chosen selected regions with targeted populations (demographic profile) for conducting survey through self-administered questionnaire/ schedule or structured personal interviews as per the requirement. Further, the secondary data so received from your good organization, and others obtained from sources such as the audited report of Bhutan Telecom Limited, the published report on telecommunication in Bhutan or alike print media and reports etc. have been used for the analysis and interpretations there upon. 3.3. Instrumentation 3.3.1. Net Promoter Score Net Promoter Score (NPS) seemed more logical for ease of understanding for the customer and accuracy of the results. It was developed by Fred Reichheld in the year 2003. It has an index, which ranges from -100 to 100 for measuring the willingness of customers where company’s product or services can be recommended by the customers. NPS was used as a proxy for gauging the overall satisfaction of customers with a company product or service. It further helped to study the loyalties of customers towards the company’s product or service brand. Under this, customers were asked to answer the simple question using an 11-point scale (0 to 10). A rating used by customer to recommend a company’s product or service to a friend or colleague using a 0-10 scale: Detractors Passives Promoters 0 1 2 3 4 5 6 7 8 9 10 After the respondents have given their rating depending on the questions and parameters, it was grouped under any of the three classes and calculated accordingly. 3.3.2. Likert Scale It is a method to convert the quantitative value to qualitative value to make it amenable to statistical analysis. A numerical value is assigned to each potential choice and a mean figure for all the responses is would be computed at the end of the evaluation or consultancy survey. There are five potential choices in the Likert scale (strongly agree, agree, neutral, disagree and strongly disagree). And the final average score represents an overall level of accomplishment or the customer’s attitude toward the subject matter concerned. 4. Empirical Findings and Analysis The data were collected from both primary and secondary sources; the primary data were collected through structured questionnaires. The secondary data have been collected from Bhutan Telecom Limited company, BMobile websites, MoIC and TashiCell websites. The questions were developed using NPS and Likert Scale method. With the help of questionnaires, researcher conducted survey in Gedu for both local people and students by ourselves. Similarly, researcher conducted surveys in Thimphu and Phuentsholing at corporate offices, private houses and to local as well as business people by closely monitoring the respondents in answering the
- 6. International Journal of Trend in Scientific Research and Development @ www.ijtsrd.com eISSN: 2456-6470 @ IJTSRD | Unique Paper ID – IJTSRD59713 | Volume – 7 | Issue – 4 | Jul-Aug 2023 Page 477 questions. Study also seek help from our friends working in different sectors to conduct the survey, and few our relatives. 4.1. Demographic profile of the respondents The views, opinions and feedback on the customer’s perception of BMobile services, data has been collected from the market segment, i.e., civil servant, corporate employees, private employees, students (youth) and farmers. Table 4.1.1: Demographic Profile of Respondents Measure Range Frequency Percentage Postpaid Prepaid Age 15-20 Years 7 28 9.6 21-25 Years 14 138 41.6 26-30 Years 23 73 26.3 31-35 Years 6 39 12.3 36-40 Years 7 9 4.4 41-45 Years 0 7 1.9 46 Years and above 3 11 3.8 Gender Male 184 50.4 Female 181 49.6 Qualification Illiterate 14 3.8 Below class X 22 6 Below Class XII 81 22.2 Below Degree 208 57 Below Masters 37 10.1 Below Doctorate 1 0.3 Occupation Government 55 15.1 Corporate 51 14 Private 93 25.5 Farmer 3 0.8 Unemployed 163 44.7 Income Tax- Payer 181 49.6 Non-Tax-Payer 184 50.4 Location Urban 295 80.8 Semi-Urban 69 18.9 Rural 1 0.3 The study was able to find out from the survey that highest users of BMobile service are aged between 21-25 years. However, most customers fall between the age 21-35 years, both post-paid and pre-paid. Occupation-wise, those unemployed either youth pursuing their studies or not employed make up highest subscribers of BMobile with 163 out of 365 respondents. Subscribers from private sector form second largest number with 93 users, 55 subscribers are civil servants and farmers make the least number of BMobile’s subscribers with just 3. Location-wise, BMobile still rules the urban market with 295 subscribers out of 365 respondents. Semi-urban cities make up 18.90% users, followed by 1 in the rural areas. BMobile has poor penetration in the rural part of Bhutan. The company needs to put continued effort to grab customer from rural areas.
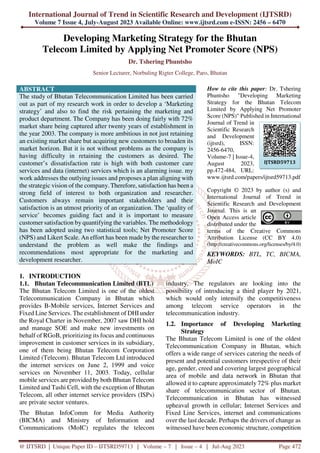
- 7. International Journal of Trend in Scientific Research and Development @ www.ijtsrd.com eISSN: 2456-6470 @ IJTSRD | Unique Paper ID – IJTSRD59713 | Volume – 7 | Issue – 4 | Jul-Aug 2023 Page 478 It is evident from the study that most Bhutan Telecom service users are either those pursuing their graduation or those qualifications with degrees making up 57.30% of the total 365 respondents. Subscribers with qualification of class twelve or those graduating from class twelve are BMobile second highest users with 22.31% out of 100%. Respondents with doctorate or equivalent studies make up the least number. 4.2. Net Promoter Score and Customer Satisfaction It is evident from the table 4.1.2 that out of 365 respondents, 200 customers recommended for services offered by BMobile, followed by 93 respondents recommending TCell services. The NPS Score for BMobile comes at 29.32% which is positive. This signifies that BMobile has more customer base and enjoys comparatively more market shares. BMobile Customer Satisfaction Level on different Internet Service (4G) Parameters NPS Risk - Score Card Parameters NPS Ratings Network Signal (Data) -54.25 1 Call Drops -53.15 2 Speed of Data (Internet) -49.04 3 Overall Quality of Data (Internet) -41.64 4 Price of Voice (Calling) -40.82 5 Network Signal (Call) -38.63 6 Price of Data (Internet) -31.78 7 Overall Quality of Voice (Calling) -21.92 8 Clarity of Voice (Calling) 1.64 9
- 8. International Journal of Trend in Scientific Research and Development @ www.ijtsrd.com eISSN: 2456-6470 @ IJTSRD | Unique Paper ID – IJTSRD59713 | Volume – 7 | Issue – 4 | Jul-Aug 2023 Page 479 Table: 4.1.2. NET PROMOTER SCORE Telecom Service Recommended by Customers BMobile 200 Tashi Cell 93 Both 51 None 21 Total 365 NPS Score for BTL Service Recommended 29.32 From the survey study, researcher was able to conclude that despite 200 out of 365 respondents recommending for BMobile services and happy with the overall service quality, many customers have problem with the internet services of BMobile. The internet service (4G Data) problems have been screened down into different parameters. To this, the customers are least satisfied with 4G Network Signal (Data) with -54.25% NPS score. The customers also face frequent problems with call drops which raises more customer dissatisfactions. The NPS score is -53.15%. This is followed by problems with speed of data (Internet) which customers face frequently which is the highest risks for company since future is on internet services. The NPS score for Speed of Data (Internet) is negative (-49.04%). Likewise, the customer satisfaction level on different BMobile services along with 4G (Data Internet Service) has been measured as given in the graph above. The NPS score shows that satisfaction level of customers. However, customers are very happy and satisfied (NPS score is + 1.64%) with the clarity of voice while calling which is a good sign for company. 4.2.1. NPS Risk Ranking and Prioritization for BMobile Internet Service Parameters
- 9. International Journal of Trend in Scientific Research and Development @ www.ijtsrd.com eISSN: 2456-6470 @ IJTSRD | Unique Paper ID – IJTSRD59713 | Volume – 7 | Issue – 4 | Jul-Aug 2023 Page 480 The graph above 4.3.2 shows that BMobile customers are more satisfied with the clarity of voice (calling) with a NPS score 1.64%. which is ranked 9 indicating that there is less risk involved. The company can give least priority to look into improve this service. On the contrary, the NPS score shown in red color in above graph indicates that the customers are least satisfied where NPS scores are given orderly (Ranking-wise) on different parameters. And the NPS scores (Red colored) which are in negative are all risk factors for company. Therefore, depending on the degree of risk on different services including 4G internet services where customers are not satisfied and happy, the company has to give priorities to work on to improve these services. This is important for giving more customer satisfactions and retention. 4.2.2. Satisfaction Level Customer Care Services of BMobile Customer Researcher could conclude from the above graph that out of 365 respondents, 190 customers are not happy with the customer care services offered by BMobile. 117 are passive customers who are availing BMobile services. These customers are loyal but will not promote a new customer for BMobile. 58 customers are prompters who would help BMobile to promote new customers to increase the scriber base that has direct impact on the revenue growth. The company should aim to retain and promote new customers in the long run. The company should work to convert customers from detractors to promoters to increase NPS Score from negative to positive. 5. Conclusion and Recommendations The researcher was to study the current marketing plan and develop a new marketing strategy for the corporate office to be used for all the commercial departments of Bhutan Telecom in Thimphu. As per the requirements and the objectives; researcher developed a model which has a relationship between ‘service quality and delivery’ and ‘customer satisfaction’ with respect to ‘service quality dimensions’ and ‘customer satisfaction’ and service quality with ‘performance of the company.’ Bhutan Telecom Limited is being a service sector business, we have infused a concept called 7 P’s marketing mix (Product, Place, Price, Promotion, People, Process and Physical Evidence) as the main attributes in service qualities. Researcher has developed a model to streamline the process of our working for better understanding of the company, and the readers of this project report. The statistical tools have been used for data analysis like NPS and Average Revenue and Median Score. It also explains the risk pertaining to the company. NPS was used to study the customer satisfaction, drawing marketing plan and for forecasting purposes.
- 10. International Journal of Trend in Scientific Research and Development @ www.ijtsrd.com eISSN: 2456-6470 @ IJTSRD | Unique Paper ID – IJTSRD59713 | Volume – 7 | Issue – 4 | Jul-Aug 2023 Page 481 5.1. Customer Acquisition and Retention Framework
- 11. International Journal of Trend in Scientific Research and Development @ www.ijtsrd.com eISSN: 2456-6470 @ IJTSRD | Unique Paper ID – IJTSRD59713 | Volume – 7 | Issue – 4 | Jul-Aug 2023 Page 482 Sources: developed by Dr. Tshering Phuntsho 5.2. Recommendations from the Researcher on service marketing-mix strategies The recommendations have been placed particularly focusing on the service marketing mix (7 P’s) for Bhutan Telecom Ltd. being a service sector business. 5.2.1. Product strategies: a. Focus on data services specifically addressing the issues related with – Network Signal, Speed of Data (Internet), Price of Voice (Calling), Overall Quality of Data (Internet), Price of Data (Internet) Overall Quality of Voice (Calling), Network Signal (Call), Call Drops Bulk SMS packages Focus on Bundle packages (Internet data package) Power recharges targeting more prepaid customers Bonus Introduce a plan to offer latest news, zakar, banking information, health, etc. 5.2.2. Place Strategies Expansion in distribution points in accessible location 5.2.3. Price Strategies Flexi Pricing Bundled Pricing (Data Packages) 5.2.4. Promotional Strategies Promote products and services through social sites – Web based recharge facilities Emphasize in building the company brands through promotional strategy Create platform for plan awareness through advertising or bulk SMS Consolidation on the aspects of GNH and CSR 5.2.5. People Strategies Good and efficient customer care services through various modes like call center, web based, SMS based feedback system. Initiate policies that would offer incentives and motivate them
- 12. International Journal of Trend in Scientific Research and Development @ www.ijtsrd.com eISSN: 2456-6470 @ IJTSRD | Unique Paper ID – IJTSRD59713 | Volume – 7 | Issue – 4 | Jul-Aug 2023 Page 483 Most importantly, CRM and related professional trainings must be provided to meet the challenges of competitive market. 5.2.6. Process Strategies a. Distribution Strategy: E-Distribution / address the issue of purchase experience the company should offer ease purchase process Interactive website: “Help with honour” Automatic activation or help SMS (sim installation) Address complaints specifically-call drop Infuse rule of branding must be followed to match international standards in-terms of logo. References [1] Agarwal, S., Deepak Singh, & K S Thakur. (2013). Impact of Service Quality Dimensions Towards Customer Satisfaction In Indian Call Centers. Pacific Business Review Internal 6(1), 1-14. [2] Agbor, J. M. (2011). The Relationship between Customer Satisfaction and Service Quality: a study of three Service sectors in Umeå. Sweden: Umeå School of Business . [3] Anderson, R. a. (2003). E-Satisfaction and E- Loyalty: A Contingency Framework. Psychology and Marketing, 20(2), 122–138. [4] Angelova, B., & Jusuf Zekiri. (2011). Measuring Customer Satisfaction with Service Quality Using American Customer Satisfaction Model. International Journal of Academic Research in Business and Social Sciences 1 (3), 1-27. [5] Aydin, S. a. (2005). The Analysis of Antecedents of Customer Loyalty in the Turkish Mobile Telecommunication Market. European Journal of Marketing, Vol. 39, No. 7/8, 910-925. [6] Bena, I. (143-150). Evaluating Customer Satisfaction in Banking Services. Management and Marketing, 5(2), 2010. [7] Bitner, M. J. (1990, April). Evaluating service encounters: the effects of physical surroundings and employee responses. Journal of Marketing, 54, 69-82. [8] Braff Adam, P. W. (2003). Going the distance with telecom customers. The Mckinsey Quarterly,No.4, 83. [9] Brown, Swartz, & Cronin. (1989). A Gap Analysis of Professional Service Quality. Journal of Marketing 53(2), 92-8. [10] Gan, C. C. (2011). An empirical analysis of New Zealand bank customers’ satisfaction. Banks and Bank Systems, 6(3), 63-77. [11] Ganguli, S. (2008, 04). changing face of relationship marketing. Evaluation of CRM to EMM “, Effective executive, 54. [12] George K. Amoako, Emmanuel Arthur, Christiana Bandoh, & Rachel Kafui Katah. (2012). The impact of effective customer relationship management (CRM) on repurchase: A case study of (GOLDEN TULIP) hotel (ACCRA-GHANA). African Journal of Marketing Management Vol. 4(1), 1-13. [13] Gronroos, C. (2000). Service management and marketing. John Wiley & sons Ltd. [14] Hansemark, O. a. (2004). Customer satisfaction and retention: the experience of individual employees. Managing Service Quality. [15] Harington, C. &. (2009). E-retailing by banks: e-service quality and its importance to customer satisfaction. European Journal of Marketing, 43(9), 1220-1231. [16] Hilal Halaoui, D. S. (2013). IT and network integra¬tion in telecom companies. Creating efficiency and customer satisfaction,” Strategy. [17] Infrastructure, I. (2005). Indian Infrastructure. Indian Infrastructure, 26. [18] J, B., & Nash L. (2003). Customer satisfaction: Applying concepts to industry- wide measures. Cornell Hotel Restaur Adm. Vol. 44(4), 173- 183. [19] Jamal, A. &. (2002). Customer Satisfaction and retail banking: an assessment of some of the key antecedents of customer satisfaction in retail banking. International Journal of Bank Marketing, 20(4), 146-160. [20] Kazman, R. (2008). The Affective and Cognitive Impacts of Perceived Touch on Online Customers. Intention to Return in the Web-based eCRM environment,. [21] Kotler, P. &. (2013). Principles of Marketing. Edinburgh Gate Harlow Essex, England. Pearson Education, 14th edition. [22] Kotler, P. (1976). Marketing Management. prentice-Hall, Englewood Cliffs,Nj,p, 60. [23] Kotler, P. (1982). Marketing for Non-profit Organisations, Prentice-Hall, Englewood Cliffs, NJ. British Journal of Marketing Studies Vol.3, No.3, 71-88.
- 13. International Journal of Trend in Scientific Research and Development @ www.ijtsrd.com eISSN: 2456-6470 @ IJTSRD | Unique Paper ID – IJTSRD59713 | Volume – 7 | Issue – 4 | Jul-Aug 2023 Page 484 [24] Kotler, P. a. (2009). Marketing management (13th end), . New Jersey. [25] Levesque, T. &. (1996). Determinants of customer satisfaction in retail banking. International Journal of Bank Marketing, 14(7), 12-20. [26] Mamoun, N. A. (2012). An empirical model of marketing strategy and shareholder value: A value-based marketing perspective. An International Business Journal incorporating Journal of Global Competitiveness, 22(1), 48- 89. [27] McDoughall, H. G. (1994). A Revised View of Service Quality Dimensions: An Empirical Investigation. Journal of Professional Service Marketing. 11(1), 189-209 . [28] Mohammad, A. H. (n.d.). Investing the impact of marketing mix elements on tourist satisfaction: An empirical study on East Lake. European journal of Business and Management, 4(7), 273-282. [29] Mukesh Chaturvedi, A. C. (2005). Customer Relationship Managemen. An India Perspective, Excel Books. [30] Mylonakis, J. (2009). Bank satisfaction factors and loyalty: a survey of the Greek bank customer. Innovative Marketing, 5(1), 16-25. [31] Parasuraman, Zeithaml, & Berry. (1985). A Conceptual Model of Service Quality and It's Implications for Future Research. Journal of Marketing 49(1) , 41-50. [32] Rajeshwari, & Ravilochanan. (2014). Churn Analytics on Indian Prepaid Mobile Services. Asian Social Sciences 10(13), 1-15. [33] report, W. t. (2002). World telecommunication development report. [34] Rootman. (2006). The influence of Customer Relationship management on the service quality of Banks. Unpublished Master‟s Dissertation. Port Elizabeth: Nelson Mandela Metropolitan University. [35] Siddiqi, K. O. (2011, 3). Interrelations between Service Quality Attributes, Customer Satisfaction and Customer Loyalty in the Retail Banking Sector in Bangladesh. International Journal of Business and Management 6(3), 1- 25. [36] Strategic Managemnt and business Policy2013Person Education [37] T.J.Brown. (1997). Using Norms to Improve the Interpretation of Service Quality Measures. Journal of Services Marketing, Vol. II, No. I, 66-80. [38] T.V.Ramchandran. (2005, 05 15). Cellular operators association of india. Trends and Development. [39] Varki, S. &. (2001). The role of price perceptions in an integrated model of behavioral intentions. Journal of Service Research, 3(2), 232-40. [40] Vodafone2013,2012,2101,2010Annual ReportsVodafone [41] Wikipedia. (2016, 04 21). Customer Relationship Management. Retrieved 04 21, 2016, from www.en.wikipedia.org: https://en.wikipedia.org/wiki/Customer_relatio nship_management [42] Wilska. (2001). New technology and young people‟s consumer identities. Acomparative study between Finland and Brazil” – Seniar researcher in economic sociology at the Turku School of economics, Finland. [43] Yadav, R., & Nishant Dabhade. (2013). Impact of Service Quality on Customer Satisfaction of Mobile Users - A Case Study of Airtel. International Journal of INNOVATIVE RESEARCH & STUDIES 2(5), 1-25. [44] Zineldin, M. (2000). Total Relationship Management, Lund. Studentlitteratur. [45] www.genroe.comNet promoter score success stories and case studies [46] Report on Ministry of Information and Communication 2015 [47] Bhutan Telecom Limited Sales/Revenue Report 2015 [48] Bhutan Telecom Limited Annual Report 2014 [49] Bhutan Telecom Limited Annual Report 2013 [50] Bhutan Telecom Limited Annual Report 2012 [51] Bhutan Telecom Limited Annual Report 2011