Altmetrics for Showing Research Impact
•Als PPTX, PDF herunterladen•
2 gefällt mir•2,171 views

This document discusses altmetrics, which are alternative metrics for measuring research impact beyond citations. It provides examples of researcher and article level altmetrics for individuals like Heather Piwowar and a 2013 article by Marshall. Altmetrics capture mentions and interactions on social media, news sites and reference managers. The document also defines various metrics like the h-index, citations and altmetric scores that can be integrated into research impact reports.

Empfohlen
Empfohlen
Weitere ähnliche Inhalte
Was ist angesagt?
Was ist angesagt? (20)
Andere mochten auch
Andere mochten auch (10)
Ähnlich wie Altmetrics for Showing Research Impact
Ähnlich wie Altmetrics for Showing Research Impact (20)
Mehr von Robin Featherstone
Mehr von Robin Featherstone (16)
Kürzlich hochgeladen
Kürzlich hochgeladen (20)
Altmetrics for Showing Research Impact
- 1. Altmetrics for Showing Research Impact Robin Featherstone, MLIS Research Librarian, Alberta Research Centre for Health Evidence, Department of Pediatrics, University of Alberta @rmfeatherstone http://www.slideshare.net/featherr http://www.ualberta.ca/ARCHE/ @arche4evidence 21 Nov 2014
- 2. Conflict of interest disclosure • I have had free access to the Altmetric.com Explorer since September 2013
- 3. Altmetrics (AKA Social Media Metrics, Alternative Assessment Metrics) … […] capture ways in which articles are disseminated throughout the expanding scholarly ecosystem, and reach beyond the scope of traditional trackers and filters. […] measure research impact by including references outside of traditional scholarly publishing. 1. Public Library of Science (PLOS). Altmetrics. [29 April 2014]. Available from http://article-level-metrics.plos.org/alt-metrics/ 2. Baynes G. Scientometrics, bibliometrics, altmetrics: Some introductory advice for the lost and bemused. Insights. 2012;25(3):311-5. doi: 10.1629/2048-7754.25.3.311.
- 4. Altmetric tools measure data collected from: • Tweets • Blog mentions • Facebook posts • Presentations • News articles • Shared citations (e.g., Mendeley, CiteULike) • Data uploads • Etc.
- 5. BIG DATA
- 6. Relevant for Research Evaluation? • Datasets • Conference posters • Theses & dissertations • Lectures, online classes • Software • “Nanopublications”
- 7. What’s your impact1? 1. Emerald Group Publishing. Impact of Research [11 April 2014]. Available from: http://www.emeraldgrouppublishing.com/authors/impact/index.htm http://blogs.lse.ac.uk/impactofsocialsciences/2011/07/14/publishers-measuring-impact/
- 8. Agenda • Researcher-level altmetrics • Article-level altmetrics • Integration into impact reports
- 9. Researcher case study – Heather Piwowar • h-index: 8 – 23 articles cited 258 times http://www.scopus.com/authid/detail.url?authorId=25122628200
- 10. Researcher Case Study – Heather Piwowar • Slideshare followers: 85 http://www.slideshare.net/hpiwowar • ImpactStory research products: 117 http://impactstory.org/HeatherPiwowar • Figshare views: 1384 http://figshare.com/authors/Heather_Piwowar/96399 • GitHub contributions: 1410 https://github.com/hpiwowar • Google Scholar h-index: 13 (51 publications cited 678 times) http://scholar.google.ca/citations?user=1YLq0XMAAAAJ&hl=en • ResearchGate score: 14.33 • Research Gate Impact Points: 50.29 https://www.researchgate.net/profile/Heather_Piwowar2
- 13. Article Case Study – Marshall 2013 • Web of Science times cited: 1 • Google Scholar times cited: 21 • Scopus times cited: 6
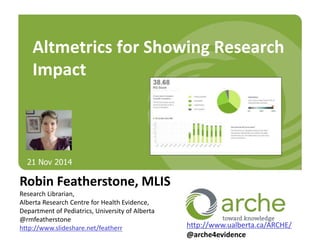
- 14. Article Case Study – Marshall 2013 • Altmetric score: 76
- 18. Integration into Research Report DEFINITIONS RESEARCH IMPACT SUMMARY Total career publications 193 Publication years 1990-2013 h-index 30 Average citations per paper 21.54 Journal actual/expected citations (Incites) 1.03 Category actual/expected citations (Incites) .99 Total citations 4232 Highest number of citations 548 RG Score 20.75 Highest Altmetric Score 642 h-index The h-index is based on a list of publications ranked in descending order by the times cited. The value of h is equal to the number of papers (N) in the list that have N or more citations. For example, an h-index of 12 indicates that in the dataset, 12 papers were cited at least 12 times each. Average citations per paper Sum of the Times Cited divided by the number of results found. Journal actual/expected citations. An aggregate ratio: the denominator (expected citations) is the sum of the expected citations of all journals that the documents were published in. The numerator (actual citations) is the sum of the citation counts of the documents themselves. Division of the sums yields the number shown. A ratio greater than 1 indicates that the authors citation count is better than average. Category actual/expected citations An aggregate ratio: the denominator (expected citations) is the sum of the expected citations of all categories of journals that the documents were published in. The numerator (actual citations) is the sum of the citation counts of the documents. Division of these sums yields the number shown. Highest number of citations. This is for a particular article and is the number of times that article has been cited since publication. ResearchGate Score. RG score is calculated based on contributions to ReearchGate, the interactions and comments of peer researchers. Highest Altmetric Score. Altmetric score is based on the amount of online attention an article has received. For more information contact: Researcher level altmetric score Article level altmetric score Definitions of altmetrics scores
- 19. Robin Featherstone, MLIS @rmfeatherstone feathers@ualberta.ca Slides available: http://www.slideshare.net/featherr The Alberta Research Centre for Health Evidence Edmonton, Alberta, Canada
Hinweis der Redaktion
- Speaker Bio: Robin Featherstone is an embedded librarian for the Alberta Research Centre for Health Evidence (ARCHE) in the Department of Pediatrics at the University of Alberta. Robin was an academic health sciences librarian at McGill and Western Universities, and a hospital librarian for the McGill University Health Centre. Robin's interest in alternative metrics developed through her work promoting and assessing the impact of her research centre's publications. Because it is relevant to this presentation, I’ll point out my two Twitter handles: one for my research centre (@arche4evidence), and one for myself as a researcher (@rmfeatherstone). It is somewhat fitting that I’m including both handles on this introductory slide. I’ll be speaking today about altmetrics as both a researcher who is working to establish my own impact within a community of information scientists, and as an embedded health research librarian who is responsible for the social media presence of my employer and assessing our centre’s social media communication strategies.
- Altmetrics measure research impact by including references outside of traditional scholarly publishing (4). These social web metrics were first proposed in 2010 as a response to scholars moving their work online. There are limits to what IF and h-index figures (traditional research metrics) can tell us. A junior faculty member may have created and shared hundreds of captivating lectures online but only published a few articles. That teaching is not reflected in their h-index. They may author a widely-followed blog in which they engage with an audience of academic peers, but there is no IF for the blog. As numbers of Twitter followers or Facebook friends quantify social media activity, altmetrics measure and rank researcher output, impact and influence from the social web. In these definitions of altmetrics, there is an emphasis on getting “beyond” or “outside” the traditional ways of measuring research impact.
- Altmetrics synthesize data collected from tweets, blogs, presentations, news articles, comments, or any social commentary about a diverse group of scholarly activities that are captured on the web. The obvious caveat about altmetrics is that they are only valid and valuable for the most recent publications. Social media mentions are rare for articles published prior to 2011, and altmetric products often exclude older datasets in their analysis.
- The fast pace of social media -- the exponential output -- makes it difficult to collect data sets from information telecommunications networks. The numbers are enormous and part of a Big Data challenge. Academic computer gives us better data collection measures and big storage solutions make it possible to analyze. But how else do we measure information that facilitates change? Surveys. Resources permitting, we should always ask human beings. Altmetrics are most cost-effective, and administrators and accountants value these numbers they can readily pull from the web.
- Key point: what is relevant for research evaluation depends on the discipline. Nanopublication: an assertion about anything that can be uniquely identified and attributed to its author.
- I first heard about the concept of impact zones from Lisa Given, an information scientists an expert on qualitative methodology who studies research impact. Impact zones have also been discussed on the London School of Economics Impact Blog. The model was developed by Emerald Publishing Group and describes 6 zones where your research can have impact. Traditional citation metrics really only tell us about one zone: knowledge. One of the reasons that I’m excited about alternative metrics is that I believe they can help us measure impact in some of the other 5 zones.
- Heather, who is a computer scientist and one of the developers of the altmetric tool ImpactStory, was generous in giving me permission to use her researcher profiles for this case example. Heather’s h-index, one of the recognized impact measurement tools, is an eight. That number tells us about the 23 selectively-indexed academic journal articles that she’s published and the number of times they’ve been cited (in selectively-indexed academic journals). But it’s not a complete picture of her academic output.
- Heather also posts her conference presentations to SlideShare and has 85 followers. She has an impressive number of “research products” that incorporates publications from both inside and outside of traditional academic journals. Her uploads to Figshare have been viewed over 1000 times, and her contributions to data repositories as measured by GitHub are equally impressive. Heather has a Google Scholar profile that showcases citations and publications that are not calculated as part of her h-index. She is part of an online academic community through ResearchGate and has been evaluated highly by her peers. These different altmetric measurements create a very different picture of Heather than her h-index
- The evolution from Facebook to LinkedIn to ImpactStory makes logical sense. User-contributed profiles became online resumes and then dynamic curricula vitae with embedded metrics for research products. For researcher-focused altmetric tools, older publications, presentations and products can be manually added. These products that tell us about researchers are more likely to include contributions prior to 2011, and for that reason are superior for analyzing research output over time than article-focused altmetric tools. ImpactStory.org is an open-source product that connects PMIDs, DOIs, GoogleScholar citations, ORCID identifiers (unique researcher identifiers) and SlideShare profiles to count “Research Products.” ImpactStory.org creates a free public profile for the individual researcher that includes their Wikis and blogs, and praises their Open Access publications with a medal ranking. ImpactStory helps scholars create and disseminate online resumes, in a similar way to LinkedIn.
- ResearchGate.net also claims to measure impact in a new way, and ranks “scientific reputation” through their RG Score. ResearchGate hosts an open platform for researchers to share and discuss their work. Products from researcher profiles contribute to RG Scores, as do evaluations of those products by ResearchGate peers. Aggregated RG Scores are also presented for institutions based on member contributions.
- We can see a similar disconnect between traditional and alternative metrics for this article by Joanne Marshall and her colleagues. In the world of health librarianship, this was a highly anticipated publication. It was discussed in my journal club as soon as it was available. But the citation counts don’t reflect that high-level of interest. These citation counts need time to grow before they can tell us anything meaningful about this article or how it compares to other publications within health librarianship.
- The Altmetric.com ranking for the Marshall paper tells a different story. Since the article was published in 2013, 4 people have blogged about it and 63 tweets have mentioned it. Clearly people are discussing and sharing this article. Just a reminder that these are dynamic rankings – the scores for the Marshall paper may be higher today than when I prepared these slides. As you can probably tell from these two case studies of a researcher and a publication, different altmetric tools tell different stories. Since we’re looking at some Altmetric.com data, I’ll start by talking about them. And then move to some of the other major players. Altmetric.com scores articles with embeddable, donut-shaped badges. Subscription costs vary and the company has been generous to librarians (like myself) in offering free accounts during their start-up phase. Their application programming interface (API) is available for free to any web developer who wants to embed Altmetric.com badges on their site. The company has published extensively on the subject of altmetrics and their data sets are contributing to bibliometric/sociometric/webometric research. Altmetric.com collects and analyzes mentions on social media sites, particularly Twitter and Facebook. The Altmetric.com Explorer searches datasets by keywords and subject headings, but works best with PubMed Identifiers (PMIDs), International Standard Serial Numbers (ISSNs), or Digital Object Identifiers (DOIs).
- In the case of this article about confidence intervals, analysis of the altmetric data shows us high interest from Great Britain and to identify communities of researchers around the world who are discussing our research. Based on profile information, we can learn what percentages of our audience for a particular topic are members of the public, scientists, practitioners, or science communicators (i.e., journalists). We can look at the individual tweets of blog articles or Facebook mentions and learn more about how research is received by these audiences.
- From researcher and institution-specific metrics, the altmetric product landscape includes producers of article-level metrics. One of these article-level altmetrics providers is Altmetric.com that I already described. But another worth mentioning is from the publisher PLOS. PLOS Article-Level Metrics examines the overall “performance and reach” of articles, and is available for every article published by PLOS (Public Library of Science). PLOS Article-Level Metrics aggregate usage data (i.e., downloads), citations, ratings, social networking mentions, blogs and media mentions. Like Altmetric.com, PLOS distributes a free API to share their article metrics on third-party websites.
- There are many products, some of which existed (like F1000) before the term “altmetrics” was coined. Currently, the landscape is full of start-ups positioning themselves as investment-worthy knowledge providers. Some altmetric tools tell us about individual articles, and others tell us about researchers, and some tell us about institutions. Researcher-focused products, like ImpactStory and ResearchGate, resemble familiar social networking sites in that they rely on contributors creating and maintaining personal profiles.