SlideShare ist ein Scribd-Unternehmen logo
1 von 7
Features of Indian Economy
Per Capita Income
I came across India’s per capita income figures the other day, and it makes a very interesting
read. The per capita income for India for 2010 is Rs. 54,835 which grew from Rs. 46,492 the
year before.

The first thing that strikes you about this number is how low this number is – by aggregate GDP
India stands number 9 or 10 in the world, but if you take the per capita GDP then India is a lowly
138 by IMF estimates, and 109 by World Bank estimates. CIA estimates rate it at an even lower
142.

In fact, if you look at the state with the lowest GDP – Bihar at Rs. 20,069 or about $456 – and
compare that with other countries then it would come as low as 170 or so.
Bihar is also only about a seventh of Delhi’s GDP and that reflects the disparity between the
various states.

Here is the chart which breaks down the per capita income by state for 2009 and 2010. Wherever
values are zero, it means that there was no data for that state in that period, and I had to make it
zero in order to create the chart.


                             India Per Capita Income by State 2010
In this chart – Goa is doing well, and I think this is closer to reality than the high unemployment
shown in the unemployment survey.

Apart from the low number, and disparity, the third thing that strikes me is the role of cities in
the high GDP. The tallest towers belong to cities, and to me, industrialization, building cities,
and moving the workforce out of agriculture into more industries, and services seems to be the
only way to grow the GDP numbers, and generally improving the standard of living in the
country.

A look at the countries with the highest per capita GDP confirms this because there aren’t any
countries there that aren’t industrialized.

I’m interested to see what the break up of the GDP for each of these states looks like also. At
present, I don’t know if that data is available somewhere but I’ll look for it. If you know about
such a document then please do leave a link.

Finally, here is the data for the above chart in a format that you should be able to copy in Excel
easily.
                      S.No. State                      2009 – 10 2010 – 11
                      1         Andhra Pradesh         51025       60458
                      2         Arunachal Pradesh      51405       0
                      3         Assam                  27197       30413
                      4         Bihar                  16715       20069
                      5         Jharkhand              27132       29786
                      6         Goa                    132719      0
                      7         Gujarat                63961       0
                      8         Haryana                78781       92327
                      9         Himachal Pradesh       50365       58493
                      10        Jammu & Kashmir        30582       33056
                      11        Karnataka              52097       59763
                      12        Kerala                 59179       0
                      13        Madhya Pradesh         27250       0
                      14        Chattisgarh            38059       44097
                      15        Maharashtra            74027       83471
                      16        Manipur                27332       29684
                      17        Meghalaya              43555       48383
                      18        Mizoram                45982       0
                      19        Nagaland               0           0
                      20        Odisha                 33226       36923
                      21        Punjab                 60746       67473
                      22        Rajasthan              34042       39967
                      23        Sikkim                 68731       81159
24       Tamil Nadu             63547        72993
                     25       Tripura                35799        38493
                     26       Uttar Pradesh          23395        26051
                     27       Uttarakhand            59584        68292
                     28       West Bengal            41219        0
                     29       A & N islands          74340        0
                     30       Chandigarh             118136       128634
                     31       Delhi                  116886       135814
                     32       Puducherry             88158        98719

Standard of Living
With one of the fastest growing economies in the world, clocked at a growth rate of 8.3% in
2010, India is fast on its way to becoming a large and globally important consumer. The
Indian middle class, estimated to be 50 million people, by McKinsey is fast becoming used
to Western culture. If current trends continue, Indian per capita purchasing power parity will
significantly increase from 4.7 to 6.1 percent of the world share by 2015.[3] In 2006, 22 percent
of Indians lived under the poverty line. India aims to eradicate poverty by 2020.
The standard of living in India shows large disparity. For example, rural areas of India exist with
very basic (or even non-existent) medical facilities, while cities boast of world class medical
establishments. Similarly, the very latest machinery may be used in some construction projects,
but many construction workers work without mechanization in most projects.
In 2010, the per capita PPP-adjusted GDP for India was US$3,608.

High Poverty
Poverty is widespread in India, with the nation estimated to have a third of the world's poor.
According to a 2005 World Bank estimate, 41.6% of the total Indian population falls below
the international poverty line of US$ 1.25 a day (PPP, in nominal terms 21.6 a day in urban
areas and 14.3 in rural areas). According to a new UN Millennium Development Goals Report,
as many as 320 million people in India and China are expected to come out of extreme poverty in
the next four years, while India's poverty rate is projected to drop to 22% in 2015. [2] The report
also indicates that in Southern Asia, however, only India, where the poverty rate is projected to
fall from 51% in 1990 to about 22% in 2015, is on track to cut poverty in half by the 2015 target
date.

The 2011 Global Hunger Index (GHI) Report ranked India 15th, amongst leading countries
with hunger situation. It also places India amongst the three countries where the GHI between
1996 and 2011 went up from 22.9 to 23.7, while 78 out of the 81 developing countries studied,
including Pakistan, Nepal, Bangladesh, Vietnam, Kenya, Nigeria, Myanmar, Uganda, Zimbabwe
and Malawi, succeeded in improving hunger condition.
The states are listed below in increasing order of poverty based on the Multi-
                          dimensional Poverty Index.
                            Population
                                                                                                           Number of
MPI                             (in                     Proportion     Average      Contribution to
              States                           MPI                                                          MPI poor
rank                         millions)                   of poor       intensity    overall poverty
                                                                                                          (in millions)
                              2007
       — India                   1,164.7        0.296          55.4%        53.5%                     -             645.0
        1 Kerala                    35.0        0.065          15.9%        40.9%               0.6%                      5.6
        2 Goa                            1.6    0.094          21.7%        43.4%               0.0%                      0.4
        3 Punjab                    27.1        0.120          26.2%        46.0%               1.0%                      7.1
            Himachal
        4                                6.7    0.131          31.0%        42.3%               0.3%                      2.1
            Pradesh
        5 Tamil Nadu                68.0        0.141          32.4%        43.6%               2.6%                 22.0
        6 Uttarakhand                    9.6    0.189          40.3%        46.9%               0.5%                      3.9
        7 Maharashtra              108.7        0.193          40.1%        48.1%               6.0%                 43.6
        8 Haryana                   24.1        0.199          41.6%        47.9%               1.3%                 10.0
        9 Gujarat                   57.3        0.205          41.5%        49.2%               3.4%                 23.8
            Jammu And
       10                           12.2        0.209          43.8%        47.7%               0.7%                      5.4
            Kashmir
            Andhra
       11                           83.9        0.211          44.7%        47.1%               5.1%                 37.5
            Pradesh
       12 Karnataka                 58.6        0.223          46.1%        48.3%               4.2%                 27.0
            Eastern
       13                           44.2        0.303          57.6%        52.5%               4.0%                 25.5
            Indian States
       14 West Bengal               89.5        0.317          58.3%        54.3%               8.5%                 52.2
       15 Orissa                    40.7        0.345          64.0%        54.0%               4.3%                 26.0
       16 Rajasthan                 65.4        0.351          64.2%        54.7%               7.0%                 41.9
       17 Uttar Pradesh            192.6        0.386          69.9%        55.2%              21.3%                134.7
       18 Chhattisgarh              23.9        0.387          71.9%        53.9%               2.9%                 17.2
            Madhya
       19                           70.0        0.389          69.5%        56.0%               8.5%                 48.6
            Pradesh
       20 Jharkhand                 30.5        0.463          77.0%        60.2%               4.2%                 23.5
       21 Bihar                     95.0        0.499          81.4%        61.3%              13.5%                 77.3
Unequal Income Distribution
Income distribution refers to the spread of a country's income percentage throughout its
population and yields a ratio between incomes of the richest in a country to the poorest. When
income is not proportionally distributed, it is called income inequality. While many would argue
it is a very much necessary part of natural economics, as in many other countries, India’s
increasing income inequality continues to pose a significant threat. In most cases, income
inequality plays a big role in the amount of crime a country has because "as the rich get richer
and the poor get poorer" it promotes unhappiness.

A great portion of India's population is a victim of rising monetary deficits, most of which has
crossed well under the poverty threshold. While the top 10% of India’s population enjoys 31.1%
of the country’s income, the lowest 10% suffers with merely 3.6%. The following data portrays
how India’s Inequality measures ratio compares to that of other countries:
    India                    8.6
    United Kingdom           13.8
    United States            15.9
    Sierra Leone             87.2
    Austria                  6.9
    Slovenia                 5.9

Dominance of Agriculture
India ranks second worldwide in farm output. Agriculture and allied sectors like forestry, logging
and fishing accounted for 15.7% of the GDP in 2009–10, employed 52.1% of the total
workforce, and despite a steady decline of its share in the GDP, is still the largest economic
sector and a significant piece of the overall socio-economic development of India. Yields per
unit area of all crops have grown since 1950, due to the special emphasis placed on agriculture in
the five-year plans and steady improvements in irrigation, technology, application of modern
agricultural practices and provision of agricultural credit and subsidies since the Green
Revolution in India. However, international comparisons reveal the average yield in India is
generally 30% to 50% of the highest average yield in the world. Indian states Uttar Pradesh,
Punjab, Haryana, Madhya Pradesh, Andhra Pradesh, Bihar, West Bengal and Maharashtra are
key agricultural contributing states of India.

India receives an average annual rainfall of 1,208 millimeters (47.6 in) and a total
annual precipitation of 4000 billion cubic meters, with the total utilizable water resources,
including surface and groundwater, amounting to 1123 billion cubic meters. 546,820 square
kilometers (211,130 sq mi) of the land area, or about 39% of the total cultivated area, is
irrigated. India's inland water resources including rivers, canals, ponds and lakes and marine
resources comprising the east and west coasts of the Indian ocean and other gulfs and bays
provide employment to nearly six million people in the fisheries sector. In 2008, India had the
world's third largest fishing industry.
India is the largest producer in the world of milk, jute and pulses, and also has the world's second
largest cattle population with 175 million animals in 2008. It is the second largest producer of
rice, wheat, sugarcane, cotton and groundnuts, as well as the second largest fruit and vegetable
producer, accounting for 10.9% and 8.6% of the world fruit and vegetable production
respectively. India is also the second largest producer and the largest consumer of silk in the
world, producing 77,000 million tons in 2005.

Existence of Rich Resources
The total cultivable area in India is 1,269,219 km² (56.78% of total land area), which is
decreasing due to constant pressure from an ever-growing population and increased urbanization.
India has a total water surface area of 314,40 km² and receives an average annual rainfall of
1,100 mm. Irrigation accounts for 92% of the water utilization, and comprised 380 km² in 1974,
and is expected to rise to 1,050 km² by 2025, with the balance accounted for by industrial and
domestic consumers. India's inland water resources comprising rivers, canals, ponds and lakes
and marine resources comprising the east and west coasts of the Indian ocean and
other gulfs and bays provide employment to nearly 6 million people in the fisheries sector. In
2008, India had the world's third largest fishing industry.

India's major mineral resources include Coal (fourth-largest reserves in the world), Iron ore,
Manganese, Mica, Bauxite, Titanium ore, Chromite, Natural gas, Diamonds, Petroleum,
Limestone and Thorium (world's largest along Kerala's shores). India's oil reserves, found
in Bombay High off the coast of Maharashtra, Gujarat, Rajasthan and in eastern Assam meet
25% of the country's demand.

Rising energy demand concomitant with economic growth has created a perpetual state of energy
crunch in India. India is poor in oil resources and is currently heavily dependent on coal and
foreign oil imports for its energy needs. Though India is rich in Thorium, but not in Uranium,
which it might get access to in light of the nuclear deal with US. India is rich in certain energy
resources which promise significant future potential - clean / renewable energy resources
like solar, wind, biofuels (jatropha, sugarcane).


Unemployment and Underemployment
Unemployment has been a major problem among young Indians. There are thousands of young
who do not have a job and lakhs of people are not in the right kind of job (underemployed), just
because there are no openings for jobs in which they specialize. There are lots of talented people
who are striving to find the right kind of jobs, but land up wasting their energy in inferior kind of
jobs. This leads in under utilization of labor (also called Underemployment).

The huge population explosion in a main reason for growing unemployment and
underemployment in India. The industrial sector is growing, no doubts about it. But the
growths of industries are not in par with the growth of Indian population. So, industries are not in
a position to create as much as jobs required by the society. It has brought a cut throat
competition especially in highly desired fields. Only those people who have the qualification
exceeding the requirement of the industries are able to get into the jobs.

The scarcity of jobs even has lead to the corruption in hiring the employees. In many cases, the
human resource officials are taking the undue advantage of the situation, by demanding the
bribes to offer the jobs. Candidates are helplessly bribing them, as they are desperately in need of
a job. Even the jobs being offered are not always quite secure. Government jobs are often prone
to bribes.

Industries and the government should work towards creating more and more jobs to kill
the problem growing unemployment and underemployment. At the same time, the proper
control has to be taken to control the explosion of population. The control of the population
can be done only by creating the awareness amongst the public. Society itself has to take the
responsibility of controlling the excess growth of population, which has been a cause for
unemployment and for many other problems.

Infrastructural Inadequacies
Infrastructure in India include transportation, agriculture, water management,
telecommunications, industrial and commercial development, power, petroleum and natural gas,
housing and other segments such as mining, disaster management services, technology-related
infrastructure.

Important sectors in Infrastructure in India:
Within the Infrastructure of India, the transportation sector is the most important, including the
aviation, ports, roads, rail system and logistics. The agriculture sector comprises infrastructure-
related storage facilities, construction relating to agro-processing projects and reservation and
storage of perishable goods. Among others essential sectors, real-estate development, including
industrial parks, special economic zones, tourism and entertainment centers, educational
institutions and hospitals and solid waste management systems, also play significant role in
Indian economy.

Under the Infrastructure in India the most essential field in which there should be development
is in the urban infrastructure. Except for a few large projects in a handful of cities, paucity
of urban infrastructure projects is a standing problem. Although city mass transport systems
and airports have found place in developmental plans, essential services such as roads, drinking
water, sewerage management, drainage, and primary health are still greatly under developed.

However, with the economy growing at more than at the rate of 8 per cent, the government is
aiming at an economic growth rate of 8 per cent during the Eleventh Plan (2008–12), for which
the government is taking necessary steps to develop the Infrastructure in India.

Weitere ähnliche Inhalte

Andere mochten auch

Features of indian economy.
Features of indian economy.Features of indian economy.
Features of indian economy.Sweetp999
 
Presentation on Indian economy
Presentation on Indian economyPresentation on Indian economy
Presentation on Indian economyJags Bhanderi
 
Salient features of Indian Economy
Salient features of Indian EconomySalient features of Indian Economy
Salient features of Indian EconomyAabhas Rastogi
 
Ppt on indian economy
Ppt on indian economyPpt on indian economy
Ppt on indian economyparthproy
 
Political system of india
Political system of indiaPolitical system of india
Political system of indiaAbad Agha
 
Indian political system
Indian political systemIndian political system
Indian political systemartipradhan
 
Liberalisation, privatisation and globalisation.
Liberalisation, privatisation and globalisation.Liberalisation, privatisation and globalisation.
Liberalisation, privatisation and globalisation.Sweetp999
 
Agriculture & indian economy
Agriculture & indian economyAgriculture & indian economy
Agriculture & indian economyAtul
 
Indian culture
Indian cultureIndian culture
Indian culturesowju1830
 

Andere mochten auch (17)

Indian Economy
Indian EconomyIndian Economy
Indian Economy
 
Features of indian economy.
Features of indian economy.Features of indian economy.
Features of indian economy.
 
Presentation on Indian economy
Presentation on Indian economyPresentation on Indian economy
Presentation on Indian economy
 
Indian economy
Indian economyIndian economy
Indian economy
 
Salient features of Indian Economy
Salient features of Indian EconomySalient features of Indian Economy
Salient features of Indian Economy
 
Indian Economy
Indian EconomyIndian Economy
Indian Economy
 
Ppt on indian economy
Ppt on indian economyPpt on indian economy
Ppt on indian economy
 
Political system of india
Political system of indiaPolitical system of india
Political system of india
 
Indian political system
Indian political systemIndian political system
Indian political system
 
Politics of India
Politics of IndiaPolitics of India
Politics of India
 
Cultures of india
Cultures of indiaCultures of india
Cultures of india
 
India
IndiaIndia
India
 
India PPT
India PPTIndia PPT
India PPT
 
Liberalisation, privatisation and globalisation.
Liberalisation, privatisation and globalisation.Liberalisation, privatisation and globalisation.
Liberalisation, privatisation and globalisation.
 
Agriculture & indian economy
Agriculture & indian economyAgriculture & indian economy
Agriculture & indian economy
 
Indian culture
Indian cultureIndian culture
Indian culture
 
Indian culture
Indian cultureIndian culture
Indian culture
 

Ähnlich wie Features of Indian Economy

Empowering women – means to a health society
Empowering women – means to a health societyEmpowering women – means to a health society
Empowering women – means to a health societyRahul Nimmagadda
 
Session 4 c motiram comments_iariw
Session 4 c motiram comments_iariwSession 4 c motiram comments_iariw
Session 4 c motiram comments_iariwIARIW 2014
 
35541086 regional-imbalance
35541086 regional-imbalance35541086 regional-imbalance
35541086 regional-imbalanceCarol Peters
 
Infrastructure Development and Its Relationship with SDP Growth
Infrastructure Development and Its Relationship  with SDP GrowthInfrastructure Development and Its Relationship  with SDP Growth
Infrastructure Development and Its Relationship with SDP Growthabhirup1985
 
Covid 19 stats in india update 8 22.09.20
Covid 19 stats in india update 8 22.09.20Covid 19 stats in india update 8 22.09.20
Covid 19 stats in india update 8 22.09.20Divyaroop Bhatnagar
 
Sustainable rural development group 7
Sustainable rural development group 7Sustainable rural development group 7
Sustainable rural development group 7Priyank Deshmukh
 
Indore city infrastructure
Indore city infrastructureIndore city infrastructure
Indore city infrastructurehome
 
State+bank+of+india
State+bank+of+indiaState+bank+of+india
State+bank+of+indiaAmit
 
Gujarat Leading In Project Investment
Gujarat Leading In Project InvestmentGujarat Leading In Project Investment
Gujarat Leading In Project Investmentwww.narendramodi.in
 
Poverty of bangladesh
Poverty of bangladeshPoverty of bangladesh
Poverty of bangladeshSad Gopal
 

Ähnlich wie Features of Indian Economy (11)

Empowering women – means to a health society
Empowering women – means to a health societyEmpowering women – means to a health society
Empowering women – means to a health society
 
Session 4 c motiram comments_iariw
Session 4 c motiram comments_iariwSession 4 c motiram comments_iariw
Session 4 c motiram comments_iariw
 
35541086 regional-imbalance
35541086 regional-imbalance35541086 regional-imbalance
35541086 regional-imbalance
 
Infrastructure Development and Its Relationship with SDP Growth
Infrastructure Development and Its Relationship  with SDP GrowthInfrastructure Development and Its Relationship  with SDP Growth
Infrastructure Development and Its Relationship with SDP Growth
 
Covid 19 stats in india update 8 22.09.20
Covid 19 stats in india update 8 22.09.20Covid 19 stats in india update 8 22.09.20
Covid 19 stats in india update 8 22.09.20
 
Sustainable rural development group 7
Sustainable rural development group 7Sustainable rural development group 7
Sustainable rural development group 7
 
Au570
Au570Au570
Au570
 
Indore city infrastructure
Indore city infrastructureIndore city infrastructure
Indore city infrastructure
 
State+bank+of+india
State+bank+of+indiaState+bank+of+india
State+bank+of+india
 
Gujarat Leading In Project Investment
Gujarat Leading In Project InvestmentGujarat Leading In Project Investment
Gujarat Leading In Project Investment
 
Poverty of bangladesh
Poverty of bangladeshPoverty of bangladesh
Poverty of bangladesh
 

Mehr von Deep Das

Union Budget 2014 e-book
Union Budget 2014 e-bookUnion Budget 2014 e-book
Union Budget 2014 e-bookDeep Das
 
Railway Budget Speech 2012-13
Railway Budget Speech 2012-13Railway Budget Speech 2012-13
Railway Budget Speech 2012-13Deep Das
 
Highlights of Railway Budget 2012-13
Highlights of Railway Budget 2012-13Highlights of Railway Budget 2012-13
Highlights of Railway Budget 2012-13Deep Das
 
BRICS Nations
BRICS NationsBRICS Nations
BRICS NationsDeep Das
 
Bharti Airtel
Bharti AirtelBharti Airtel
Bharti AirtelDeep Das
 
Motivation
MotivationMotivation
MotivationDeep Das
 
Reservation in Indian Society
Reservation in Indian SocietyReservation in Indian Society
Reservation in Indian SocietyDeep Das
 
Pantaloons
PantaloonsPantaloons
PantaloonsDeep Das
 
Indian Economy Globalisation
Indian Economy GlobalisationIndian Economy Globalisation
Indian Economy GlobalisationDeep Das
 
India an IT Superpower
India  an IT SuperpowerIndia  an IT Superpower
India an IT SuperpowerDeep Das
 
Impact of FDI in Retail Sector
Impact of FDI in Retail SectorImpact of FDI in Retail Sector
Impact of FDI in Retail SectorDeep Das
 
ICA & GSTP
ICA & GSTPICA & GSTP
ICA & GSTPDeep Das
 
Highlights@ Union Budget 2012 13
Highlights@ Union Budget 2012 13Highlights@ Union Budget 2012 13
Highlights@ Union Budget 2012 13Deep Das
 
Approach To The Twelfth Five Year Plan
Approach To The Twelfth Five Year PlanApproach To The Twelfth Five Year Plan
Approach To The Twelfth Five Year PlanDeep Das
 
Airtel vs Vodafone
Airtel vs VodafoneAirtel vs Vodafone
Airtel vs VodafoneDeep Das
 

Mehr von Deep Das (20)

Union Budget 2014 e-book
Union Budget 2014 e-bookUnion Budget 2014 e-book
Union Budget 2014 e-book
 
Railway Budget Speech 2012-13
Railway Budget Speech 2012-13Railway Budget Speech 2012-13
Railway Budget Speech 2012-13
 
Highlights of Railway Budget 2012-13
Highlights of Railway Budget 2012-13Highlights of Railway Budget 2012-13
Highlights of Railway Budget 2012-13
 
E Banking
E BankingE Banking
E Banking
 
BRICS Nations
BRICS NationsBRICS Nations
BRICS Nations
 
Bharti Airtel
Bharti AirtelBharti Airtel
Bharti Airtel
 
Motivation
MotivationMotivation
Motivation
 
Sx40
Sx40Sx40
Sx40
 
Reservation in Indian Society
Reservation in Indian SocietyReservation in Indian Society
Reservation in Indian Society
 
Pantaloons
PantaloonsPantaloons
Pantaloons
 
Indian Economy Globalisation
Indian Economy GlobalisationIndian Economy Globalisation
Indian Economy Globalisation
 
India an IT Superpower
India  an IT SuperpowerIndia  an IT Superpower
India an IT Superpower
 
Impact of FDI in Retail Sector
Impact of FDI in Retail SectorImpact of FDI in Retail Sector
Impact of FDI in Retail Sector
 
ICA & GSTP
ICA & GSTPICA & GSTP
ICA & GSTP
 
Highlights@ Union Budget 2012 13
Highlights@ Union Budget 2012 13Highlights@ Union Budget 2012 13
Highlights@ Union Budget 2012 13
 
IBM SWOT
IBM SWOTIBM SWOT
IBM SWOT
 
Approach To The Twelfth Five Year Plan
Approach To The Twelfth Five Year PlanApproach To The Twelfth Five Year Plan
Approach To The Twelfth Five Year Plan
 
BRS
BRSBRS
BRS
 
Airtel
AirtelAirtel
Airtel
 
Airtel vs Vodafone
Airtel vs VodafoneAirtel vs Vodafone
Airtel vs Vodafone
 

Kürzlich hochgeladen

Overview of Inkel Unlisted Shares Price.
Overview of Inkel Unlisted Shares Price.Overview of Inkel Unlisted Shares Price.
Overview of Inkel Unlisted Shares Price.Precize Formely Leadoff
 
BPPG response - Options for Defined Benefit schemes - 19Apr24.pdf
BPPG response - Options for Defined Benefit schemes - 19Apr24.pdfBPPG response - Options for Defined Benefit schemes - 19Apr24.pdf
BPPG response - Options for Defined Benefit schemes - 19Apr24.pdfHenry Tapper
 
Bladex 1Q24 Earning Results Presentation
Bladex 1Q24 Earning Results PresentationBladex 1Q24 Earning Results Presentation
Bladex 1Q24 Earning Results PresentationBladex
 
(办理学位证)加拿大萨省大学毕业证成绩单原版一比一
(办理学位证)加拿大萨省大学毕业证成绩单原版一比一(办理学位证)加拿大萨省大学毕业证成绩单原版一比一
(办理学位证)加拿大萨省大学毕业证成绩单原版一比一S SDS
 
government_intervention_in_business_ownership[1].pdf
government_intervention_in_business_ownership[1].pdfgovernment_intervention_in_business_ownership[1].pdf
government_intervention_in_business_ownership[1].pdfshaunmashale756
 
Stock Market Brief Deck FOR 4/17 video.pdf
Stock Market Brief Deck FOR 4/17 video.pdfStock Market Brief Deck FOR 4/17 video.pdf
Stock Market Brief Deck FOR 4/17 video.pdfMichael Silva
 
《加拿大本地办假证-寻找办理Dalhousie毕业证和达尔豪斯大学毕业证书的中介代理》
《加拿大本地办假证-寻找办理Dalhousie毕业证和达尔豪斯大学毕业证书的中介代理》《加拿大本地办假证-寻找办理Dalhousie毕业证和达尔豪斯大学毕业证书的中介代理》
《加拿大本地办假证-寻找办理Dalhousie毕业证和达尔豪斯大学毕业证书的中介代理》rnrncn29
 
Stock Market Brief Deck for "this does not happen often".pdf
Stock Market Brief Deck for "this does not happen often".pdfStock Market Brief Deck for "this does not happen often".pdf
Stock Market Brief Deck for "this does not happen often".pdfMichael Silva
 
letter-from-the-chair-to-the-fca-relating-to-british-steel-pensions-scheme-15...
letter-from-the-chair-to-the-fca-relating-to-british-steel-pensions-scheme-15...letter-from-the-chair-to-the-fca-relating-to-british-steel-pensions-scheme-15...
letter-from-the-chair-to-the-fca-relating-to-british-steel-pensions-scheme-15...Henry Tapper
 
Financial analysis on Risk and Return.ppt
Financial analysis on Risk and Return.pptFinancial analysis on Risk and Return.ppt
Financial analysis on Risk and Return.ppttadegebreyesus
 
Call Girls Near Me WhatsApp:+91-9833363713
Call Girls Near Me WhatsApp:+91-9833363713Call Girls Near Me WhatsApp:+91-9833363713
Call Girls Near Me WhatsApp:+91-9833363713Sonam Pathan
 
Economic Risk Factor Update: April 2024 [SlideShare]
Economic Risk Factor Update: April 2024 [SlideShare]Economic Risk Factor Update: April 2024 [SlideShare]
Economic Risk Factor Update: April 2024 [SlideShare]Commonwealth
 
The AES Investment Code - the go-to counsel for the most well-informed, wise...
The AES Investment Code -  the go-to counsel for the most well-informed, wise...The AES Investment Code -  the go-to counsel for the most well-informed, wise...
The AES Investment Code - the go-to counsel for the most well-informed, wise...AES International
 
Vp Girls near me Delhi Call Now or WhatsApp
Vp Girls near me Delhi Call Now or WhatsAppVp Girls near me Delhi Call Now or WhatsApp
Vp Girls near me Delhi Call Now or WhatsAppmiss dipika
 
project management information system lecture notes
project management information system lecture notesproject management information system lecture notes
project management information system lecture notesongomchris
 
Managing Finances in a Small Business (yes).pdf
Managing Finances  in a Small Business (yes).pdfManaging Finances  in a Small Business (yes).pdf
Managing Finances in a Small Business (yes).pdfmar yame
 
The Core Functions of the Bangko Sentral ng Pilipinas
The Core Functions of the Bangko Sentral ng PilipinasThe Core Functions of the Bangko Sentral ng Pilipinas
The Core Functions of the Bangko Sentral ng PilipinasCherylouCamus
 
NO1 Certified Black Magic Specialist Expert In Bahawalpur, Sargodha, Sialkot,...
NO1 Certified Black Magic Specialist Expert In Bahawalpur, Sargodha, Sialkot,...NO1 Certified Black Magic Specialist Expert In Bahawalpur, Sargodha, Sialkot,...
NO1 Certified Black Magic Specialist Expert In Bahawalpur, Sargodha, Sialkot,...Amil baba
 
PMFBY , Pradhan Mantri Fasal bima yojna
PMFBY , Pradhan Mantri  Fasal bima yojnaPMFBY , Pradhan Mantri  Fasal bima yojna
PMFBY , Pradhan Mantri Fasal bima yojnaDharmendra Kumar
 

Kürzlich hochgeladen (20)

Overview of Inkel Unlisted Shares Price.
Overview of Inkel Unlisted Shares Price.Overview of Inkel Unlisted Shares Price.
Overview of Inkel Unlisted Shares Price.
 
BPPG response - Options for Defined Benefit schemes - 19Apr24.pdf
BPPG response - Options for Defined Benefit schemes - 19Apr24.pdfBPPG response - Options for Defined Benefit schemes - 19Apr24.pdf
BPPG response - Options for Defined Benefit schemes - 19Apr24.pdf
 
Bladex 1Q24 Earning Results Presentation
Bladex 1Q24 Earning Results PresentationBladex 1Q24 Earning Results Presentation
Bladex 1Q24 Earning Results Presentation
 
(办理学位证)加拿大萨省大学毕业证成绩单原版一比一
(办理学位证)加拿大萨省大学毕业证成绩单原版一比一(办理学位证)加拿大萨省大学毕业证成绩单原版一比一
(办理学位证)加拿大萨省大学毕业证成绩单原版一比一
 
government_intervention_in_business_ownership[1].pdf
government_intervention_in_business_ownership[1].pdfgovernment_intervention_in_business_ownership[1].pdf
government_intervention_in_business_ownership[1].pdf
 
Stock Market Brief Deck FOR 4/17 video.pdf
Stock Market Brief Deck FOR 4/17 video.pdfStock Market Brief Deck FOR 4/17 video.pdf
Stock Market Brief Deck FOR 4/17 video.pdf
 
《加拿大本地办假证-寻找办理Dalhousie毕业证和达尔豪斯大学毕业证书的中介代理》
《加拿大本地办假证-寻找办理Dalhousie毕业证和达尔豪斯大学毕业证书的中介代理》《加拿大本地办假证-寻找办理Dalhousie毕业证和达尔豪斯大学毕业证书的中介代理》
《加拿大本地办假证-寻找办理Dalhousie毕业证和达尔豪斯大学毕业证书的中介代理》
 
Stock Market Brief Deck for "this does not happen often".pdf
Stock Market Brief Deck for "this does not happen often".pdfStock Market Brief Deck for "this does not happen often".pdf
Stock Market Brief Deck for "this does not happen often".pdf
 
letter-from-the-chair-to-the-fca-relating-to-british-steel-pensions-scheme-15...
letter-from-the-chair-to-the-fca-relating-to-british-steel-pensions-scheme-15...letter-from-the-chair-to-the-fca-relating-to-british-steel-pensions-scheme-15...
letter-from-the-chair-to-the-fca-relating-to-british-steel-pensions-scheme-15...
 
Financial analysis on Risk and Return.ppt
Financial analysis on Risk and Return.pptFinancial analysis on Risk and Return.ppt
Financial analysis on Risk and Return.ppt
 
Call Girls Near Me WhatsApp:+91-9833363713
Call Girls Near Me WhatsApp:+91-9833363713Call Girls Near Me WhatsApp:+91-9833363713
Call Girls Near Me WhatsApp:+91-9833363713
 
🔝+919953056974 🔝young Delhi Escort service Pusa Road
🔝+919953056974 🔝young Delhi Escort service Pusa Road🔝+919953056974 🔝young Delhi Escort service Pusa Road
🔝+919953056974 🔝young Delhi Escort service Pusa Road
 
Economic Risk Factor Update: April 2024 [SlideShare]
Economic Risk Factor Update: April 2024 [SlideShare]Economic Risk Factor Update: April 2024 [SlideShare]
Economic Risk Factor Update: April 2024 [SlideShare]
 
The AES Investment Code - the go-to counsel for the most well-informed, wise...
The AES Investment Code -  the go-to counsel for the most well-informed, wise...The AES Investment Code -  the go-to counsel for the most well-informed, wise...
The AES Investment Code - the go-to counsel for the most well-informed, wise...
 
Vp Girls near me Delhi Call Now or WhatsApp
Vp Girls near me Delhi Call Now or WhatsAppVp Girls near me Delhi Call Now or WhatsApp
Vp Girls near me Delhi Call Now or WhatsApp
 
project management information system lecture notes
project management information system lecture notesproject management information system lecture notes
project management information system lecture notes
 
Managing Finances in a Small Business (yes).pdf
Managing Finances  in a Small Business (yes).pdfManaging Finances  in a Small Business (yes).pdf
Managing Finances in a Small Business (yes).pdf
 
The Core Functions of the Bangko Sentral ng Pilipinas
The Core Functions of the Bangko Sentral ng PilipinasThe Core Functions of the Bangko Sentral ng Pilipinas
The Core Functions of the Bangko Sentral ng Pilipinas
 
NO1 Certified Black Magic Specialist Expert In Bahawalpur, Sargodha, Sialkot,...
NO1 Certified Black Magic Specialist Expert In Bahawalpur, Sargodha, Sialkot,...NO1 Certified Black Magic Specialist Expert In Bahawalpur, Sargodha, Sialkot,...
NO1 Certified Black Magic Specialist Expert In Bahawalpur, Sargodha, Sialkot,...
 
PMFBY , Pradhan Mantri Fasal bima yojna
PMFBY , Pradhan Mantri  Fasal bima yojnaPMFBY , Pradhan Mantri  Fasal bima yojna
PMFBY , Pradhan Mantri Fasal bima yojna
 

Features of Indian Economy

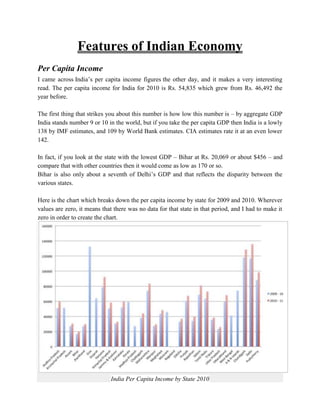
  • 1. Features of Indian Economy Per Capita Income I came across India’s per capita income figures the other day, and it makes a very interesting read. The per capita income for India for 2010 is Rs. 54,835 which grew from Rs. 46,492 the year before. The first thing that strikes you about this number is how low this number is – by aggregate GDP India stands number 9 or 10 in the world, but if you take the per capita GDP then India is a lowly 138 by IMF estimates, and 109 by World Bank estimates. CIA estimates rate it at an even lower 142. In fact, if you look at the state with the lowest GDP – Bihar at Rs. 20,069 or about $456 – and compare that with other countries then it would come as low as 170 or so. Bihar is also only about a seventh of Delhi’s GDP and that reflects the disparity between the various states. Here is the chart which breaks down the per capita income by state for 2009 and 2010. Wherever values are zero, it means that there was no data for that state in that period, and I had to make it zero in order to create the chart. India Per Capita Income by State 2010
  • 2. In this chart – Goa is doing well, and I think this is closer to reality than the high unemployment shown in the unemployment survey. Apart from the low number, and disparity, the third thing that strikes me is the role of cities in the high GDP. The tallest towers belong to cities, and to me, industrialization, building cities, and moving the workforce out of agriculture into more industries, and services seems to be the only way to grow the GDP numbers, and generally improving the standard of living in the country. A look at the countries with the highest per capita GDP confirms this because there aren’t any countries there that aren’t industrialized. I’m interested to see what the break up of the GDP for each of these states looks like also. At present, I don’t know if that data is available somewhere but I’ll look for it. If you know about such a document then please do leave a link. Finally, here is the data for the above chart in a format that you should be able to copy in Excel easily. S.No. State 2009 – 10 2010 – 11 1 Andhra Pradesh 51025 60458 2 Arunachal Pradesh 51405 0 3 Assam 27197 30413 4 Bihar 16715 20069 5 Jharkhand 27132 29786 6 Goa 132719 0 7 Gujarat 63961 0 8 Haryana 78781 92327 9 Himachal Pradesh 50365 58493 10 Jammu & Kashmir 30582 33056 11 Karnataka 52097 59763 12 Kerala 59179 0 13 Madhya Pradesh 27250 0 14 Chattisgarh 38059 44097 15 Maharashtra 74027 83471 16 Manipur 27332 29684 17 Meghalaya 43555 48383 18 Mizoram 45982 0 19 Nagaland 0 0 20 Odisha 33226 36923 21 Punjab 60746 67473 22 Rajasthan 34042 39967 23 Sikkim 68731 81159
  • 3. 24 Tamil Nadu 63547 72993 25 Tripura 35799 38493 26 Uttar Pradesh 23395 26051 27 Uttarakhand 59584 68292 28 West Bengal 41219 0 29 A & N islands 74340 0 30 Chandigarh 118136 128634 31 Delhi 116886 135814 32 Puducherry 88158 98719 Standard of Living With one of the fastest growing economies in the world, clocked at a growth rate of 8.3% in 2010, India is fast on its way to becoming a large and globally important consumer. The Indian middle class, estimated to be 50 million people, by McKinsey is fast becoming used to Western culture. If current trends continue, Indian per capita purchasing power parity will significantly increase from 4.7 to 6.1 percent of the world share by 2015.[3] In 2006, 22 percent of Indians lived under the poverty line. India aims to eradicate poverty by 2020. The standard of living in India shows large disparity. For example, rural areas of India exist with very basic (or even non-existent) medical facilities, while cities boast of world class medical establishments. Similarly, the very latest machinery may be used in some construction projects, but many construction workers work without mechanization in most projects. In 2010, the per capita PPP-adjusted GDP for India was US$3,608. High Poverty Poverty is widespread in India, with the nation estimated to have a third of the world's poor. According to a 2005 World Bank estimate, 41.6% of the total Indian population falls below the international poverty line of US$ 1.25 a day (PPP, in nominal terms 21.6 a day in urban areas and 14.3 in rural areas). According to a new UN Millennium Development Goals Report, as many as 320 million people in India and China are expected to come out of extreme poverty in the next four years, while India's poverty rate is projected to drop to 22% in 2015. [2] The report also indicates that in Southern Asia, however, only India, where the poverty rate is projected to fall from 51% in 1990 to about 22% in 2015, is on track to cut poverty in half by the 2015 target date. The 2011 Global Hunger Index (GHI) Report ranked India 15th, amongst leading countries with hunger situation. It also places India amongst the three countries where the GHI between 1996 and 2011 went up from 22.9 to 23.7, while 78 out of the 81 developing countries studied, including Pakistan, Nepal, Bangladesh, Vietnam, Kenya, Nigeria, Myanmar, Uganda, Zimbabwe and Malawi, succeeded in improving hunger condition.
  • 4. The states are listed below in increasing order of poverty based on the Multi- dimensional Poverty Index. Population Number of MPI (in Proportion Average Contribution to States MPI MPI poor rank millions) of poor intensity overall poverty (in millions) 2007 — India 1,164.7 0.296 55.4% 53.5% - 645.0 1 Kerala 35.0 0.065 15.9% 40.9% 0.6% 5.6 2 Goa 1.6 0.094 21.7% 43.4% 0.0% 0.4 3 Punjab 27.1 0.120 26.2% 46.0% 1.0% 7.1 Himachal 4 6.7 0.131 31.0% 42.3% 0.3% 2.1 Pradesh 5 Tamil Nadu 68.0 0.141 32.4% 43.6% 2.6% 22.0 6 Uttarakhand 9.6 0.189 40.3% 46.9% 0.5% 3.9 7 Maharashtra 108.7 0.193 40.1% 48.1% 6.0% 43.6 8 Haryana 24.1 0.199 41.6% 47.9% 1.3% 10.0 9 Gujarat 57.3 0.205 41.5% 49.2% 3.4% 23.8 Jammu And 10 12.2 0.209 43.8% 47.7% 0.7% 5.4 Kashmir Andhra 11 83.9 0.211 44.7% 47.1% 5.1% 37.5 Pradesh 12 Karnataka 58.6 0.223 46.1% 48.3% 4.2% 27.0 Eastern 13 44.2 0.303 57.6% 52.5% 4.0% 25.5 Indian States 14 West Bengal 89.5 0.317 58.3% 54.3% 8.5% 52.2 15 Orissa 40.7 0.345 64.0% 54.0% 4.3% 26.0 16 Rajasthan 65.4 0.351 64.2% 54.7% 7.0% 41.9 17 Uttar Pradesh 192.6 0.386 69.9% 55.2% 21.3% 134.7 18 Chhattisgarh 23.9 0.387 71.9% 53.9% 2.9% 17.2 Madhya 19 70.0 0.389 69.5% 56.0% 8.5% 48.6 Pradesh 20 Jharkhand 30.5 0.463 77.0% 60.2% 4.2% 23.5 21 Bihar 95.0 0.499 81.4% 61.3% 13.5% 77.3
  • 5. Unequal Income Distribution Income distribution refers to the spread of a country's income percentage throughout its population and yields a ratio between incomes of the richest in a country to the poorest. When income is not proportionally distributed, it is called income inequality. While many would argue it is a very much necessary part of natural economics, as in many other countries, India’s increasing income inequality continues to pose a significant threat. In most cases, income inequality plays a big role in the amount of crime a country has because "as the rich get richer and the poor get poorer" it promotes unhappiness. A great portion of India's population is a victim of rising monetary deficits, most of which has crossed well under the poverty threshold. While the top 10% of India’s population enjoys 31.1% of the country’s income, the lowest 10% suffers with merely 3.6%. The following data portrays how India’s Inequality measures ratio compares to that of other countries:  India 8.6  United Kingdom 13.8  United States 15.9  Sierra Leone 87.2  Austria 6.9  Slovenia 5.9 Dominance of Agriculture India ranks second worldwide in farm output. Agriculture and allied sectors like forestry, logging and fishing accounted for 15.7% of the GDP in 2009–10, employed 52.1% of the total workforce, and despite a steady decline of its share in the GDP, is still the largest economic sector and a significant piece of the overall socio-economic development of India. Yields per unit area of all crops have grown since 1950, due to the special emphasis placed on agriculture in the five-year plans and steady improvements in irrigation, technology, application of modern agricultural practices and provision of agricultural credit and subsidies since the Green Revolution in India. However, international comparisons reveal the average yield in India is generally 30% to 50% of the highest average yield in the world. Indian states Uttar Pradesh, Punjab, Haryana, Madhya Pradesh, Andhra Pradesh, Bihar, West Bengal and Maharashtra are key agricultural contributing states of India. India receives an average annual rainfall of 1,208 millimeters (47.6 in) and a total annual precipitation of 4000 billion cubic meters, with the total utilizable water resources, including surface and groundwater, amounting to 1123 billion cubic meters. 546,820 square kilometers (211,130 sq mi) of the land area, or about 39% of the total cultivated area, is irrigated. India's inland water resources including rivers, canals, ponds and lakes and marine resources comprising the east and west coasts of the Indian ocean and other gulfs and bays provide employment to nearly six million people in the fisheries sector. In 2008, India had the world's third largest fishing industry.
  • 6. India is the largest producer in the world of milk, jute and pulses, and also has the world's second largest cattle population with 175 million animals in 2008. It is the second largest producer of rice, wheat, sugarcane, cotton and groundnuts, as well as the second largest fruit and vegetable producer, accounting for 10.9% and 8.6% of the world fruit and vegetable production respectively. India is also the second largest producer and the largest consumer of silk in the world, producing 77,000 million tons in 2005. Existence of Rich Resources The total cultivable area in India is 1,269,219 km² (56.78% of total land area), which is decreasing due to constant pressure from an ever-growing population and increased urbanization. India has a total water surface area of 314,40 km² and receives an average annual rainfall of 1,100 mm. Irrigation accounts for 92% of the water utilization, and comprised 380 km² in 1974, and is expected to rise to 1,050 km² by 2025, with the balance accounted for by industrial and domestic consumers. India's inland water resources comprising rivers, canals, ponds and lakes and marine resources comprising the east and west coasts of the Indian ocean and other gulfs and bays provide employment to nearly 6 million people in the fisheries sector. In 2008, India had the world's third largest fishing industry. India's major mineral resources include Coal (fourth-largest reserves in the world), Iron ore, Manganese, Mica, Bauxite, Titanium ore, Chromite, Natural gas, Diamonds, Petroleum, Limestone and Thorium (world's largest along Kerala's shores). India's oil reserves, found in Bombay High off the coast of Maharashtra, Gujarat, Rajasthan and in eastern Assam meet 25% of the country's demand. Rising energy demand concomitant with economic growth has created a perpetual state of energy crunch in India. India is poor in oil resources and is currently heavily dependent on coal and foreign oil imports for its energy needs. Though India is rich in Thorium, but not in Uranium, which it might get access to in light of the nuclear deal with US. India is rich in certain energy resources which promise significant future potential - clean / renewable energy resources like solar, wind, biofuels (jatropha, sugarcane). Unemployment and Underemployment Unemployment has been a major problem among young Indians. There are thousands of young who do not have a job and lakhs of people are not in the right kind of job (underemployed), just because there are no openings for jobs in which they specialize. There are lots of talented people who are striving to find the right kind of jobs, but land up wasting their energy in inferior kind of jobs. This leads in under utilization of labor (also called Underemployment). The huge population explosion in a main reason for growing unemployment and underemployment in India. The industrial sector is growing, no doubts about it. But the
  • 7. growths of industries are not in par with the growth of Indian population. So, industries are not in a position to create as much as jobs required by the society. It has brought a cut throat competition especially in highly desired fields. Only those people who have the qualification exceeding the requirement of the industries are able to get into the jobs. The scarcity of jobs even has lead to the corruption in hiring the employees. In many cases, the human resource officials are taking the undue advantage of the situation, by demanding the bribes to offer the jobs. Candidates are helplessly bribing them, as they are desperately in need of a job. Even the jobs being offered are not always quite secure. Government jobs are often prone to bribes. Industries and the government should work towards creating more and more jobs to kill the problem growing unemployment and underemployment. At the same time, the proper control has to be taken to control the explosion of population. The control of the population can be done only by creating the awareness amongst the public. Society itself has to take the responsibility of controlling the excess growth of population, which has been a cause for unemployment and for many other problems. Infrastructural Inadequacies Infrastructure in India include transportation, agriculture, water management, telecommunications, industrial and commercial development, power, petroleum and natural gas, housing and other segments such as mining, disaster management services, technology-related infrastructure. Important sectors in Infrastructure in India: Within the Infrastructure of India, the transportation sector is the most important, including the aviation, ports, roads, rail system and logistics. The agriculture sector comprises infrastructure- related storage facilities, construction relating to agro-processing projects and reservation and storage of perishable goods. Among others essential sectors, real-estate development, including industrial parks, special economic zones, tourism and entertainment centers, educational institutions and hospitals and solid waste management systems, also play significant role in Indian economy. Under the Infrastructure in India the most essential field in which there should be development is in the urban infrastructure. Except for a few large projects in a handful of cities, paucity of urban infrastructure projects is a standing problem. Although city mass transport systems and airports have found place in developmental plans, essential services such as roads, drinking water, sewerage management, drainage, and primary health are still greatly under developed. However, with the economy growing at more than at the rate of 8 per cent, the government is aiming at an economic growth rate of 8 per cent during the Eleventh Plan (2008–12), for which the government is taking necessary steps to develop the Infrastructure in India.