Quantitative Easing and the Fed 2008-2014: A Tutorial
•Als PPT, PDF herunterladen•
15 gefällt mir•17,543 views

This slideshow gives a comprehensive review of the theory and practice of quantitative easing in the United States from 2008 to 2014

Empfohlen
Weitere ähnliche Inhalte
Was ist angesagt?
Was ist angesagt? (20)
Andere mochten auch
Andere mochten auch (20)
Ähnlich wie Quantitative Easing and the Fed 2008-2014: A Tutorial
Ähnlich wie Quantitative Easing and the Fed 2008-2014: A Tutorial (20)
Mehr von Ed Dolan
Mehr von Ed Dolan (20)
Kürzlich hochgeladen
Kürzlich hochgeladen (20)
Quantitative Easing and the Fed 2008-2014: A Tutorial
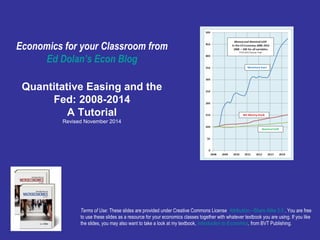
- 1. Economics for your Classroom from Ed Dolan’s Econ Blog Quantitative Easing and the Fed: 2008-2014 A Tutorial Revised November 2014 Terms of Use: These slides are provided under Creative Commons License Attribution—Share Alike 3.0 . You are free to use these slides as a resource for your economics classes together with whatever textbook you are using. If you like the slides, you may also want to take a look at my textbook, Introduction to Economics, from BVT Publishing.
- 2. Understanding Quantitative Easing Central banks—the Federal Reserve, the European Central Bank, the People’s Bank of China, and others—are among the most powerful institutions in the world One of their potentially most powerful but least understood instruments is Quantitative Easing or QE, a type of policy that the Fed pursued for six years, from late 2008 to late 2014 This tutorial explains the mechanics of QE and its effects on the US economy Federal Reserve Building, Washington, DC Photo by Agnosticpreacherskid, http://upload.wikimedia.org/wikipedia/commons/8/8d/Marriner_S._Eccle s_Federal_Reserve_Board_Building.jpg Revised version November 2014 Ed Dolan’s Econ Blog
- 3. Quantitative Easing Part 1: The Mechanics
- 4. The Central Bank Balance Sheet: Assets Fig 1 gives a stylized balance sheet of a typical central bank Net domestic assets consist of all assets denominated in the country’s own currency, e.g., bonds issued by its government, adjusted by subtracting certain liabilities and capital Net foreign assets consist of all assets denominated in foreign currencies, e.g., bonds issued by foreign governments, adjusted by subtracting foreign liabilities, if any Revised version November 2014 Ed Dolan’s Econ Blog
- 5. The Central Bank Balance Sheet: Liabilities The sum of the items on the liabilities side of the balance sheet is called the monetary base, which consists of two parts Reserve deposits that private commercial banks hold with the central bank Currency (paper money) Revised version November 2014 Ed Dolan’s Econ Blog
- 6. The Central Bank and Commercial Banks The central bank balance sheet is linked to those of commercial banks through reserves of liquid assets held by commercial banks: Reserves of currency used to fill ATM machines and serve other needs Reserve deposits in accounts that commercial banks maintain with the central bank Loans to consumers and firms are banks’ main income-earning assets Bank deposits held by consumers and business firms are banks largest category of liabilities Revised version November 2014 Ed Dolan’s Econ Blog
- 7. The Complete Financial System We complete our stylized picture of the financial system by adding the balance sheet of the “nonfinancial public,” consisting of all private firms except commercial banks and all households The public balance sheet is linked to the central bank via currency—an asset of the public and a liability of the central bank Bank deposits are an asset of the public and a liability of commercial banks Loans—an asset of commercial banks and a liability of the public—are the last important link among the balance sheets Revised version November 2014 Ed Dolan’s Econ Blog
- 8. The Money Stock and the Equation of Exchange The nation’s money stock or money supply consists of the total value of currency and bank deposits held by the public. (Currency held by banks is not included). The most common measure of the money stock is known as M2 In practice, bank deposits form 80 to 90 percent of the money stock in the monetary systems of developed countries, and currency plays a minor role Revised version November 2014 Ed Dolan’s Econ Blog
- 9. Central Bank Open Market Operations Open market operations are one of the most important tools that central banks use to control the money stock These are purchases or sales of assets (usually government securities) from or to the public via secondary markets that are open to all buyers and sellers—hence the name “open market” operations. Note: This and subsequent slides use “T-accounts,” which are simplified balance sheets that only show items that change as a result of whatever operation we are discussing Revised version November 2014 Ed Dolan’s Econ Blog
- 10. Open Market Operations Step-by-Step Step1: The central bank adds to its holdings of domestic securities by buying them from a bank Step 2: In return, the central bank credits an equal amount to the bank’s reserve account Step 3: The result is an increase in bank reserves and in the monetary base Revised version November 2014 Ed Dolan’s Econ Blog
- 11. Open Market Operations: Alternative Version Step1a: Alternatively, the central bank could buy the securities from dealers who are not banks or from other members of the public Step 2a: The central bank pays for the securities using a payment order that is executed through the banking system. Sellers of the securities receive payment as deposits added to their bank accounts Step 3a: To complete the payment process, the central bank adds an equal amount to the reserve deposit of the commercial bank or banks where the sellers keep their accounts Revised version November 2014 Ed Dolan’s Econ Blog
- 12. Further effects of open market operations The immediate effects of an open market operation are increase in bank reserves and the monetary base Subsequently, banks may make new loans to members of the nonfinancial public If they do so, the proceeds of the loans are paid out to the borrowers in the form of added bank deposits. The result is a further expansion of the money supply with no further change in reserves or the monetary base Revised version November 2014 Ed Dolan’s Econ Blog
- 13. The Costs of QE: Recycling Interest Payments What, if anything, is the cost of QE to the Fed? To the government as a whole? When the Fed buys securities, interest it collects is a source of income for the Fed, but the Fed is not allowed to profit from it. After deducting its operating costs, it turns any surplus back to the Treasury. In the simplest case, where the securities purchased are government bonds, QE is purely a bookkeeping operation with no immediate cost to the Fed or to the government as a whole The Fed The Treasury Treasury photo by David Monack, http://commons.wikimedia.org/wiki/File:GallatinTreas.jpg Revised version November 2014 Ed Dolan’s Econ Blog
- 14. Possible Indirect Costs Qualification No 1: Since 2008, the Fed has begun paying interest on banks’ reserve deposits, so not all the interest is recycled, however, the interest rate is low—just 0.25 percent. Qualification No. 2: The Fed may not be able to hold its big QE purchases of bonds forever. Sooner or later, the economy will begin to recover. The Fed’s exit strategy from QE may require selling off many of the extra securities. Under some conditions, it might have to sell them at a loss Photo: © BrokenSphere / Wikimedia Commons Revised version November 2014 Ed Dolan’s Econ Blog
- 15. Quantitative Easing Part 2: The Effects
- 16. Effects of Open Market Purchase: Traditional Textbook Version According to a traditional textbook model, open market operations affect the economy through two key ratios: The ratio of the M2 money supply to the monetary base is known as the money multiplier The ratio of nominal GDP to the money supply is known as the velocity of circulation of money, or, for short, simply velocity If the money multiplier and velocity were fixed constants, then the Fed could control the economy as easily as a child can control a model train Revised version November 2014 Ed Dolan’s Econ Blog
- 17. Before QE The first massive purchases of assets by the Fed, now known as QE1, began in mid-2008 Before that time, the money multiplier and velocity ratios in reality been approximately constant, as we can see from the fact that the monetary base, the money stock, and nominal GDP tracked closely together. Note: In this and the following figures, the base, the money stock, and GDP are all charted with their values for Jan. 2008 = 100 Revised version November 2014 Ed Dolan’s Econ Blog
- 18. Effects of QE1 As soon as the Fed began the first phase of QE, however, the economy stopped behaving according to the textbook model The monetary base grew rapidly, but the money stock grew only slightly. The growing gap between the curves indicates a rapidly falling money multiplier The money stock increased but nominal GDP at first continued to fall. The gap between the curves indicates a decrease in velocity Revised version November 2014 Ed Dolan’s Econ Blog
- 19. From QE1 to QE2 Because QE1 failed to get the economy back on track, the Fed decided to try again. From late 2010 to mid-2011, it carried out an additional large scale purchase of assets that became known as QE2 Nominal GDP did begin slowly to increase, but the effects of QE2 were weak and the curves continued to diverge Revised version November 2014 Ed Dolan’s Econ Blog
- 20. Finally, QE3 In September 2012 the Fed decided to begin a third round of easing, QE3 Unlike QE1 and QE2, QE3 had no specified end date, but was intended to continue until the economy improved As under QE1 and QE2, the curves continued to diverge. There was no mechanical linkage between monetary policy and the economy as a whole, but nominal GDP did continue to grow and the economy began slowly to improve Revised version November 2014 Ed Dolan’s Econ Blog
- 21. Progress toward the Fed’s Targets The Fed sets official targets of 2 percent for inflation and 5.25-5.75 percent for unemployment By late 2014, unemployment had fallen to 5.9 percent. The Fed decided that there had been enough progress toward the targets to bring QE3 officially to a close Did QE work? Can the Fed take credit for the recovery, or would the economy have recovered anyway? Revised version November 2014 Ed Dolan’s Econ Blog
- 22. How QE may have worked Supporters of QE say we should not expect it to work through rigid ratios like the money multiplier and velocity One theory says that it works by changing the relative amounts of long- and short-term securities, thereby lowering long-term rates, supporting stock prices, and encouraging investment Another theory says the most important effect is forward guidance, that is, changing people’s expectations about what the Fed will do in the future Jackson Hole, Wyoming Source: Enricokamasa via http://commons.wikimedia.org/wiki/File:Corbet %27s_Couloir_jackson_hole.jpg For a detailed discussion of how QE works, see this paper by Michael Woodford presented at the Fed’s 2012 conference in Jackson Hole, WY Revised version November 2014 Ed Dolan’s Econ Blog
- 23. Monetary vs. Fiscal Policy Supporters of QE place part of the blame for a slow recovery on fiscal policy, which is beyond the Fed’s control Despite some stimulus in 2008 and 2009, fiscal policy soon became tighter as Congress cut spending to reduce the federal deficit (see chart on next slide) In the words of former Fed chairman Ben Bernanke, “Monetary policy cannot achieve by itself what a broader and more balanced set of economic policies might achieve.” (Speech of Aug 31, 2012) Revised version November 2014 Ed Dolan’s Econ Blog vs.
- 24. US Fiscal Policy, 2006-2014 The best single measure of the stance of fiscal policy is the primary structural balance (PSB), which is the surplus or deficit, excluding interest payments, that would prevail if the economy were at full employment Fiscal policy moves adds stimulus if the PSB decreases (down on the chart) from year to year and restraint if it increases (up) After 2009, fiscal restraint offset much of the monetary stimulus from quantitative easing (Follow this link for a more detailed discussion) Revised version November 2014 Ed Dolan’s Econ Blog
- 25. The Bottom Line The US experience with quantitative easing shows that during a deep recession, the central bank’s control over the economy is weak. Trying to stimulate the economy with monetary policy alone is like “pushing a string.” Tight fiscal policy further limited the effectiveness of quantitative easing. Nonetheless, it is likely that QE did have a positive effect. Very likely the recession would have been even deeper and the recovery even slower without it. Revised version November 2014 Ed Dolan’s Econ Blog
- 26. For more slideshows and commentary, follow Ed Dolan’s Econ Blog Like this slideshow? Follow @DolanEcon on Twitter Click here to learn more about Ed Dolan’s Econ texts