Revising butler model
•Als PPTX, PDF herunterladen•
2 gefällt mir•5,368 views

GCSE geography revision includes an exam question and mark scheme from AQA Syllabus A

Empfohlen
Weitere ähnliche Inhalte
Andere mochten auch
Andere mochten auch (19)
Ähnlich wie Revising butler model
Ähnlich wie Revising butler model (20)
Mehr von dhukkhagogo
Kürzlich hochgeladen
Kürzlich hochgeladen (20)
Revising butler model
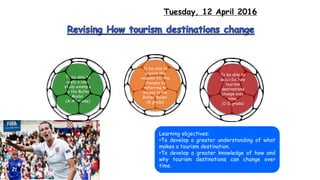
- 1. Tuesday, 12 April 2016 To be able to describe how tourism destinations change over time. (C-D grade) To be able to explain the reasons for the changes by referring to stages in the Butler Model. (B grade) To be able to apply a case study example to the Butler Model. (A-A* grade) Learning objectives; •To develop a greater understanding of what makes a tourism destination. •To develop a greater knowledge of how and why tourism destinations can change over time.
- 2. 1/ What is the name of the tourist model you need to know for the exam? 2/ Write these stages of the model out in their correct order … you have 3 minutes • Development • Stagnation • Decline • Consolidation • Involvement • Exploration • Rejuvenation • Stabilisation Top tip: Remember that 3 of them are “possibilities” and you could put them all at the same time
- 3. Small numbers of tourists begin to EXPLORE the area. There are few facilities. The local people realise the economic potential or tourism and become INVOLVED. The local government realises the potential of tourism and DEVELOPS the area. Control moves from the locals to big companies. There are more and more facilities built. In groups of 4 map the Butler model from memory. Each person will see this slide for 1 minute. The area has reached a period of CONSOLIDATION with tourism. It is still a large part of the economy but numbers are starting to level off. Visitors number have peaked and begin to STAGNATE. Facilities are no longer as good and tourists have had a negative impact on the environment and are making the area less attractive. New facilities and the area attracts more visitors. Fewer visitors come as the area is less attractive and so the area becomes run-down and tourism and the area DECLINES.
- 5. Use the text book p 240 and the youtube video on the Machin Anderson channel called “Blackpool tourist area life cycle model” to create a specific Blackpool Butler life cycle model. Began in the 19th century People set up shops as factory workers came for holidays.
- 8. Draw and label the tourist area/resort life cycle model (Butler’s model) to show how a resort such as Cromer changes over time. (4 marks) Taken from 2013 paper
- 9. Draw and label the tourist area/resort life cycle model (Butler’s model) to show how a resort such as Cromer changes over time. (4 marks) • A graph must be drawn and the points made through labelling. This should show a steady rise in numbers as the resort develops until there are a substantial number of tourists. At the apex of the line there should be two (or three) possible lines drawn to show continued growth / (stagnation) / decline. This may depend on the version of the model the candidate has seen. Labels should reflect these stages. • 1 mark for shape including the alternative endings. • 1 mark for correct labelling of axes. (Horizontal axis – time or years; vertical axis – number of visitors.) • Up to 2 marks for labels • Maximum 1 mark if all labels / information only is in the correct sequence.
Hinweis der Redaktion
- Print copy of this for them to glue in