SlideShare ist ein Scribd-Unternehmen logo
1 von 198
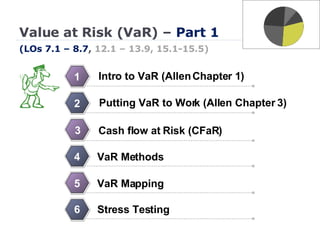
Value at Risk (VaR) –  Part 1 (LOs 7.1 – 8.7 ,  12.1 – 13.9, 15.1-15.5)   Intro to VaR (Allen Chapter 1) 1 VaR Mapping 4 VaR Methods 5 Cash flow at Risk (CFaR) 2 Putting VaR to Work (Allen Chapter 3) 3 Stress Testing 6
Value at Risk (VaR) in the Readings We are reviewing here (Sec II) Was reviewed in Quant (Sec I) To be reviewed in Investments (Sec V) Learning Outcome Location in Study Guide Reading LO 7.1 to 7.6 II. Market 1.A. Intro to VaR Allen Ch. 1 LO 7.7 to 7.15 II. Market 1.B. Putting VaR to work Allen Ch. 3 LO 8.1 to 8.7 II. Market 6.A. Firm-wide Approach to Risk Stulz Ch. 4 LO 9.1 to 9.11 V. Investment 6.A. Portfolio Risk Jorion Ch. 7 LO 10.1 10.7 I. Quant 3.A. Forecasting Risk and Correlation Jorion Ch. 9 LO 11.1 to 11.10 I. Quant 1. Quantifying Volatility Allen Ch. 2
We are reviewing here (Sec II) Was reviewed in Quant (Sec I) To be reviewed in Investments (Sec V) Value at Risk (VaR) in the Readings Learning Outcome Location in Study Guide Reading LO 12.1 to 12.6 II. Market 3.A. VaR Methods Jorion Ch. 10 LO 13.1 to 13.9 II. Market 3.B. VaR Mapping Jorion Ch. 11 LO 14.1 to 14.7 I. Quant 3.B. MCS Jorion Ch. 12 LO 15.1 to 15.5 I. Market 3.C Stress Testing Jorion Ch. 14 LO 16.1 to 16.3 I. Quant 4. EVT Kalyvas Ch. 4 LO 17.1 17.13 V. Investment 6.B. Budgeting in I/M Jorion Ch. 17
Value at Risk (VaR) ,[object Object],[object Object],[object Object],[object Object],[object Object],[object Object],[object Object]
Value at Risk (VaR) ,[object Object],Single-Period VaR (n=1)
Value at Risk (VaR) ,[object Object]
Value at Risk (VaR) - % Basis -1.645  One-Period VaR (n=1) and 95% confidence (5% significance)
Value at Risk (VaR) – Dollar Basis -1.645  One-Period VaR (n=1) and 95% confidence (5% significance)
10-period VaR @ 5% significance -1.645  10 10-Period VaR (n=10) and 95% confidence (5% significance)
10-period (10-day) VaR 5% significance, annual    = +12% $100(1+  ) +0.48 ($95.30)
Absolute versus Relative VaR $100(1+  ) $100    $5.20    $4.73
Absolute VaR $100(1+  ) $100
VaR Re-cap
Value at Risk (VaR) ,[object Object],What is one-day VaR with 95% confidence, dollars and percentage terms?
Value at Risk (VaR) ,[object Object],What is one-day VaR with 95% confidence?
Value at Risk (VaR) ,[object Object],Square-root rule J-day VaR = 1-day VaR    Square Root of Delta Time Assumes i.i.d. Independent    not (auto/serial) correlated Identically distr.   constant variance  (homoskedastic)
Value at Risk (VaR) ,[object Object],Daily VaR is (-)$10,000. What is 5-day VaR?
Value at Risk (VaR) ,[object Object],10-day VaR is (-)$1 million. What is annual VaR (assume 250 trading days)?
Value at Risk (VaR) ,[object Object],[object Object],[object Object],[object Object],[object Object],[object Object]
Value at Risk (VaR) ,[object Object]
Value at Risk (VaR) ,[object Object],[object Object],[object Object],[object Object],Except for interest rate variables: absolute  
Value at Risk (VaR) ,[object Object]
Value at Risk (VaR) ,[object Object],Directional Impacts Factor Impact on  Portfolio volatility Higher variance  Greater asset concentration  More equally weighted assets  Lower correlation  Higher systematic risk  Higher idiosyncratic risk Not relevant
Value at Risk (VaR) ,[object Object],[object Object],[object Object],All assets are locally linear .  For example, an option: the option is convex in the value of the underlying. The delta is the slope of the tangent line. For small changes, the delta is approximately constant.
Value at Risk (VaR) ,[object Object]
Value at Risk (VaR) ,[object Object],[object Object],[object Object],[object Object]
Value at Risk (VaR) ,[object Object],[object Object],[object Object],[object Object],[object Object]
Value at Risk (VaR) ,[object Object],Advantage Disadvantage Structured Monte Carlo ,[object Object],[object Object],[object Object]
Value at Risk (VaR) ,[object Object],[object Object],[object Object],[object Object]
Value at Risk (VaR) ,[object Object],Advantage Disadvantage Stress Testing ,[object Object],[object Object],[object Object],[object Object],[object Object]
Value at Risk (VaR) ,[object Object],[object Object]
Value at Risk (VaR) ,[object Object],[object Object],[object Object],[object Object],[object Object]
Value at Risk (VaR) ,[object Object],[object Object],[object Object]
Value at Risk (VaR) ,[object Object],VAR CFAR Balance sheet  (asset values) Statement of cash flows Banks, financial services firm, funds Non-financial corporations    External markets for capital    Internal growth provides capital
Value at Risk (VaR) ,[object Object]
Value at Risk (VaR) ,[object Object],Impact of “small” project: Buy #1 and Sell #3 1% of portfolio
Value at Risk (VaR) ,[object Object]
Value at Risk (VaR) ,[object Object],[object Object],[object Object],[object Object]
Value at Risk (VaR) ,[object Object],[object Object],[object Object],[object Object],[object Object],[object Object],[object Object]
Value at Risk (VaR) ,[object Object],[object Object],[object Object]
Value at Risk (VaR) ,[object Object],[object Object]
Value at Risk (VaR) ,[object Object],[object Object],[object Object],[object Object],[object Object]
Value at Risk (VaR) ,[object Object],Valuation Method Risk factor Local Full Analytical Delta-normal Not used Delta-gamma-delta Simulated Delta-gamma-Monte-Carlo Monte Carlo Grid Monte Carlo Historical
Value at Risk (VaR) ,[object Object],Advantage Disadvantage Delta-normal Easy to implement Computationally fast Can be run in real-time Amenable to analysis (can run marginal and incremental VaR) Normality assumption violated by fat-tails (compensate by increasing the confidence interval) Inadequate for nonlinear assets
Value at Risk (VaR) ,[object Object],Advantage Disadvantage Historical Simulation Simple to implement Does not require covariance matrix Can account for fat-tails Robust because it does not require distributional assumption (e.g., normal) Can do full valuation Allows for horizon choice Intuitive Uses only one sample path (if history does not represent future, important tail events not captured) High sampling variation (data in tail may be small) Assumes stationary distribution (can be addressed with filtered simulation)
Value at Risk (VaR) ,[object Object],Advantage Disadvantage Monte Carlo Most powerful Handles fat tails Handles nonlinearities Incorporates passage of time; e.g., including time decay of options Computationally intensive (need lots of computer and/or time) Can be expensive Model risk Sampling variation
Value at Risk (VaR) ,[object Object]
Value at Risk (VaR) ,[object Object],[object Object],[object Object],[object Object],[object Object],The  second component  is the “mapping system” which transforms (or maps) the portfolio positions into weights on each of the securities for which risk is measured.
Value at Risk (VaR) ,[object Object],[object Object],[object Object],[object Object]
Value at Risk (VaR) ,[object Object],[object Object]
Value at Risk (VaR) ,[object Object],[object Object],[object Object],[object Object]
Value at Risk (VaR) ,[object Object]
Value at Risk (VaR) ,[object Object],[object Object],[object Object]
Value at Risk (VaR) ,[object Object]
Value at Risk (VaR) ,[object Object],[object Object],[object Object],[object Object],[object Object]
Value at Risk (VaR) ,[object Object],VAR vs. Stress Testing VAR Stress Testing No information on magnitude of losses in excess of  VaR  Captures the “magnitude effect” of large market moves. Little/no information on direction of exposure; e.g., is exposure due to price increase or market decline Simulates changes in market rates and prices, in both directions Says nothing about the risk due to omitted factors; e.g., due to lack of data or to maintain simplicity Incorporates multiple factors and captures the effect of nonlinear instruments.
Value at Risk (VaR) ,[object Object],[object Object],[object Object],[object Object],[object Object],[object Object],[object Object],[object Object],[object Object]
Value at Risk (VaR) ,[object Object],[object Object],[object Object],[object Object],[object Object],[object Object],[object Object],[object Object]
Value at Risk (VaR) ,[object Object],Advantage Disadvantage Prospective Scenarios in MDA Relies on input of managers to frame scenario and therefore may be most realistic vis-à-vis actual extreme exposures May not be well-suited to “large, complex” portfolios FACTOR PUSH METHOD: ignores correlations Historical scenarios in MDA Useful for measuring joint movements in financial variables Typically, limited number of events to draw upon
Value at Risk (VaR) ,[object Object],Advantage Disadvantage Conditional Scenario Method More realistically incorporates correlations across variables: allows us to predict certain variables  conditional on  movements in key variables   Relies on  correlations derived from entire sample period. Highly subjective
Value at Risk (VaR) ,[object Object],[object Object],[object Object],[object Object],[object Object],[object Object],[object Object],[object Object]
VaR: Question ,[object Object],[object Object],[object Object]
VaR: Answer 1 ,[object Object],[object Object]
VaR: Answer 2 ,[object Object],[object Object]
VaR: Question ,[object Object],[object Object]
VaR: Answer ,[object Object],[object Object]
VaR of nonlinear derivative ,[object Object],[object Object],[object Object],[object Object]
VaR of nonlinear derivative
Taylor approximation AIM: Explain how the addition of second-order terms through the Taylor approximation improves the estimate of VAR for non-linear derivatives 1. Constant approximation 2. First-order (linear) approximation 3. Second-order (quadratic) approximation
Taylor approximation AIM: Explain how the addition of second-order terms through the Taylor approximation improves the estimate of VAR for non-linear derivatives
Taylor approximation AIM: Discuss why the Taylor approximation is ineffective for certain types of securities Does not perform well when the derivative shows  extreme nonlinearities . For example: ,[object Object],[object Object],When beta/duration can change rapidly, Taylor approximation (delta-gamma approximation) is ineffective – need more complex models.
Versus Full Re-value AIM: Explain the differences between the delta-normal and full-revaluation methods for measuring the risk of non-linear derivatives Delta-normal: linear approximation that assumes normality ,[object Object],[object Object],Full-revaluation: linear approximation that assumes normality Computationally fast but… approximate Accurate but… computationally burdensome ,[object Object]
Structured Monte Carlo ,[object Object],[object Object],[object Object],Simulate with one variable (e.g., GBM) or several (Cholesky)
Structured Monte Carlo
Structured Monte Carlo ,[object Object],[object Object],[object Object],[object Object],[object Object],[object Object]
Scenario Analysis Evaluate Correlation Matrix Under Scenarios ERM Crisis (92) Mexican Crisis (94) Crash Of 1987 Gulf War (90) Asian Crisis (’97/8)
Scenario Analysis AIM: Discuss the implications of correlation breakdown for scenario analysis Severe stress events wreak havoc on the covariance matrix
Scenario Analysis AIM: Describe the primary approaches to stress testing and the advantages and disadvantages of each approach ,[object Object],[object Object],[object Object],(a) Plugs-in  historical events , or  (b)  Analyzes  predetermined scenarios
Scenario Analysis Historical events +  Can inform on portfolio weaknesses - But could miss weaknesses  unique  to the portfolio Stress Scenarios + Gives exposure to standard risk factors -  But may generate unwarranted red flags -  May not perform well in regard to asset-class-specific risk AIM: Describe the primary approaches to stress testing and the advantages and disadvantages of each approach
Summary ,[object Object],[object Object],[object Object],[object Object]
Probability
Random Variables + + + Short-term  Asset Returns Probability distributions are models of random behavior + + + - - - - - - - ? ? ?
Random Variables ,[object Object],[object Object]
Random Variables ,[object Object],[object Object],[object Object]
Random Variables ,[object Object],[object Object],[object Object],[object Object]
Random Variables ,[object Object],[object Object],[object Object],[object Object],[object Object]
Random Variables ,[object Object],[object Object],[object Object],[object Object],[object Object],[object Object]
Random Variables ,[object Object],One Event: Roll a seven Six outcomes
Probability ,[object Object]
Conditional ,[object Object],Unconditional
Conditional ,[object Object],Conditional
Joint probability ,[object Object],S= $10 S= $15 S=$20 Total T=$15 0 2 2 4 T=$20 3 4 3 10 T=$30 3 6 3 12 Total 6 12 8 26
Theorems ,[object Object]
Theorems ,[object Object],Independent = not correlated
Theorems ,[object Object]
Theorems ,[object Object],What is the variance of a single six-sided die?
Theorems ,[object Object]
Covariance & correlation ,[object Object]
Covariance & correlation ,[object Object],X Y 3 5 2 4 4 6
Covariance & correlation ,[object Object],X Y (X-X  avg )(Y-Y  avg ) 3 5 0.0 2 4 1.0 4 6 1.0 Avg = 3 Avg = 5 Avg = .67
Covariance & correlation X Y (X-X  avg )(Y-Y  avg ) 3 5 0.0 2 4 1.0 4 6 1.0 Avg = 3 Avg = 5 Avg = .67 s.d. = SQRT(.67) s.d. = SQRT(.67) Correl. = 1.0
Covariance & correlation ,[object Object]
Bayes’ formula ,[object Object]
Bayes’ Formula
Bayes’ Formula
Permutations & combinations ,[object Object]
Permutations & combinations ,[object Object],Given a set of seven letters: {a, b, c, d, e, f, g} How many permutations of three letters? How many combinations of three letters?
Permutations & combinations ,[object Object]
Distributions ,[object Object],LO 2.2 Discuss a probability function, a probability density function, and a cumulative distribution function
Discrete Variables
Continuous Variables
PDF
Cumulative Distribution
Comparison Probability Density Function (pdf) Cumulative Distribution Discrete variable Continuous variable
Distributions ,[object Object],[object Object],[object Object],[object Object],[object Object]
Distributions ,[object Object],[object Object],[object Object],[object Object],[object Object],[object Object],[object Object],[object Object]
Uniform Distribution
Distributions ,[object Object]
Probability Distributions
Binomial
Binomial
Binomial
Binomial – con’t
Normal distribution ,[object Object]
Normal Distribution
Also Normal
A Big Problem with Normal
Normal
Normal
Normal distribution ,[object Object],% of all (two-tailed) % “to the left” (one-tailed) Critical values Interval –math (two-tailed) VaR ~ 68% ~ 34% 1 ~ 90% ~ 5.0 % 1.645 (~1.65) ~ 95% ~ 2.5% 1.96 ~ 98% ~ 1.0 % 2.327 (~2.33) ~ 99% ~ 0.5% 2.58
Normal distribution ,[object Object],[object Object],[object Object],[object Object]
For Parametric VAR ,[object Object],[object Object],[object Object],[object Object],[object Object],[object Object]
Poisson
Poisson: Question ,[object Object],[object Object]
Poisson: Answer ,[object Object]
Distributions - Poisson ,[object Object],[object Object],[object Object],[object Object],[object Object],[object Object],[object Object],[object Object]
Compared ,[object Object],In Poisson, the expected value (the mean) = variance Variance is standard deviation 2
Lognormal ,[object Object]
Lognormal Transform x-axis To logarithmic scale
Student’s t
Summary ,[object Object],[object Object],[object Object],[object Object],[object Object],[object Object],[object Object],[object Object]
Sampling ,[object Object],[object Object],[object Object],[object Object],[object Object],We take a sample (from the population)  in order to draw an inference  about the population.
Frequencies ,[object Object],[object Object]
Sampling ,[object Object],[object Object],[object Object]
Sampling ,[object Object],[object Object],[object Object],[object Object],[object Object],[object Object]
Geo & Arithmetic mean 2003 5.0% 2004 8.0% 2005 (3.0%) 2006 9.0% Geo. Arith.
Geo & Arithmetic mean 2003 5.0% 1.05 2004 8.0% 1.08 2005 (3.0%) 0.97 2006 9.0% 1.09  1.199 Geo. 4.641% Arith. 4.75%
Sampling ,[object Object],The sampling distribution is the probability of the sample statistic
Sampling ,[object Object],Variance of sampling distribution of means: Infinite population  or  with replacement
Sampling ,[object Object],Variance of sampling distribution of means: Finite population (size N)  and  without replacement Variance of sampling distribution of means: Infinite population  or  with replacement
Sampling ,[object Object],Standardized Variable: “ Asymptotically normal” even when population is not normally distributed !!
Sampling ,[object Object],Standardized Variable: “ Asymptotically normal” even when population is not normally distributed !! Central limit theorem: Random variables are not normally distributed,  But as sample size increases  -> Average (and summation) tend toward normal
Sampling ,[object Object],Sampling distribution of proportions Where p = probability of success
Sampling ,[object Object],Sampling distribution of differences Two populations,  Two samples,  difference  of the means
Sampling ,[object Object],Sampling distribution of differences Two populations,  Two samples, sum of the means
Variance ,[object Object],Population Variance
Variance ,[object Object],Sample Variance
Variance ,[object Object],Sample Standard Deviation
Chebyshev’s ,[object Object],What is the probability that random variable X (with finite mean and variance) will differ by more than three (3) standard deviations from its mean?
Chebyshev’s ,[object Object],If k = 3, then P() = 1/(3 2 ) = 1/9 = 0.1111
Skewness & Kurtosis ,[object Object]

Weitere ähnliche Inhalte

Was ist angesagt?

chapter three interest rates in the financial system.pptx
chapter three interest rates in the financial system.pptxchapter three interest rates in the financial system.pptx
chapter three interest rates in the financial system.pptxEbsaAbdi
 
Currency options
Currency optionsCurrency options
Currency optionsjigi1234
 
Interest Rate Risk And Management
Interest Rate Risk And ManagementInterest Rate Risk And Management
Interest Rate Risk And Managementcatelong
 
FRTB - Market Risk Capital Charge Calculation
FRTB - Market Risk Capital Charge CalculationFRTB - Market Risk Capital Charge Calculation
FRTB - Market Risk Capital Charge CalculationRamesh Jonnadula
 
INTEREST RATE RISK MANAGEMENT IN BANKS
INTEREST RATE RISK MANAGEMENT IN BANKSINTEREST RATE RISK MANAGEMENT IN BANKS
INTEREST RATE RISK MANAGEMENT IN BANKSIBS Business School
 
Counterparty Credit Risk and CVA under Basel III
Counterparty Credit Risk and CVA under Basel IIICounterparty Credit Risk and CVA under Basel III
Counterparty Credit Risk and CVA under Basel IIIHäner Consulting
 
FIM - Credit Derivatives PPT
FIM - Credit Derivatives PPTFIM - Credit Derivatives PPT
FIM - Credit Derivatives PPTBishnu Kumar
 
Liquidity Risk Measurement
Liquidity Risk MeasurementLiquidity Risk Measurement
Liquidity Risk MeasurementRaja Abdarrahman
 
Capital asset pricing model
Capital asset pricing modelCapital asset pricing model
Capital asset pricing modelAaryendr
 
Asset liability management
Asset liability managementAsset liability management
Asset liability managementAnil Chaurasiya
 
Capital asset pricing model (CAPM)
Capital asset pricing model (CAPM)Capital asset pricing model (CAPM)
Capital asset pricing model (CAPM)Simran Kaur
 
Asset Allocation And Your Portfolio
Asset Allocation And Your PortfolioAsset Allocation And Your Portfolio
Asset Allocation And Your PortfolioWilliamDeye
 

Was ist angesagt? (20)

chapter three interest rates in the financial system.pptx
chapter three interest rates in the financial system.pptxchapter three interest rates in the financial system.pptx
chapter three interest rates in the financial system.pptx
 
Currency options
Currency optionsCurrency options
Currency options
 
Currency Swaps
Currency SwapsCurrency Swaps
Currency Swaps
 
Liquidity Risk Oct 4
Liquidity Risk Oct 4Liquidity Risk Oct 4
Liquidity Risk Oct 4
 
Interest Rate Risk And Management
Interest Rate Risk And ManagementInterest Rate Risk And Management
Interest Rate Risk And Management
 
FRTB - Market Risk Capital Charge Calculation
FRTB - Market Risk Capital Charge CalculationFRTB - Market Risk Capital Charge Calculation
FRTB - Market Risk Capital Charge Calculation
 
INTEREST RATE RISK MANAGEMENT IN BANKS
INTEREST RATE RISK MANAGEMENT IN BANKSINTEREST RATE RISK MANAGEMENT IN BANKS
INTEREST RATE RISK MANAGEMENT IN BANKS
 
Counterparty Credit Risk and CVA under Basel III
Counterparty Credit Risk and CVA under Basel IIICounterparty Credit Risk and CVA under Basel III
Counterparty Credit Risk and CVA under Basel III
 
Swaps
SwapsSwaps
Swaps
 
FIM - Credit Derivatives PPT
FIM - Credit Derivatives PPTFIM - Credit Derivatives PPT
FIM - Credit Derivatives PPT
 
hedging strategy
hedging strategyhedging strategy
hedging strategy
 
Financial Derivatives and Options
Financial Derivatives and OptionsFinancial Derivatives and Options
Financial Derivatives and Options
 
Liquidity Risk Measurement
Liquidity Risk MeasurementLiquidity Risk Measurement
Liquidity Risk Measurement
 
Capital asset pricing model
Capital asset pricing modelCapital asset pricing model
Capital asset pricing model
 
The Greeks
The GreeksThe Greeks
The Greeks
 
Market Risk
Market RiskMarket Risk
Market Risk
 
Asset liability management
Asset liability managementAsset liability management
Asset liability management
 
Capital asset pricing model (CAPM)
Capital asset pricing model (CAPM)Capital asset pricing model (CAPM)
Capital asset pricing model (CAPM)
 
Asset Allocation And Your Portfolio
Asset Allocation And Your PortfolioAsset Allocation And Your Portfolio
Asset Allocation And Your Portfolio
 
Bond markets
Bond marketsBond markets
Bond markets
 

Andere mochten auch

Measuring risk essentials of financial risk management
Measuring risk essentials of financial risk managementMeasuring risk essentials of financial risk management
Measuring risk essentials of financial risk managementChho Phet
 
7. Derivatives Part1 Pdf
7. Derivatives Part1 Pdf7. Derivatives Part1 Pdf
7. Derivatives Part1 Pdfdavidharper
 
Absolute and Relative VaR of a mutual fund.
Absolute and Relative VaR of a mutual fund.Absolute and Relative VaR of a mutual fund.
Absolute and Relative VaR of a mutual fund.Lello Pacella
 
FRM 2007 1. Volatility
FRM 2007 1. VolatilityFRM 2007 1. Volatility
FRM 2007 1. Volatilityturtle
 
Long Term Capital Management (LTCM) Financial Collapse - Risk Management Case...
Long Term Capital Management (LTCM) Financial Collapse - Risk Management Case...Long Term Capital Management (LTCM) Financial Collapse - Risk Management Case...
Long Term Capital Management (LTCM) Financial Collapse - Risk Management Case...Duc Anh Nguyen
 
Ch07 hullofod8thedition
Ch07 hullofod8theditionCh07 hullofod8thedition
Ch07 hullofod8theditiontrevorsum67890
 
VaR Approximation Methods
VaR Approximation MethodsVaR Approximation Methods
VaR Approximation MethodsCognizant
 
Arbitrage bounds on option prices
Arbitrage bounds on option pricesArbitrage bounds on option prices
Arbitrage bounds on option pricesVaibhav Banjan
 
CVAR Real Estate Road Warrior Apps
CVAR Real Estate Road Warrior AppsCVAR Real Estate Road Warrior Apps
CVAR Real Estate Road Warrior AppsShannon W. King
 
Differential connectivity in neoplastic coexpression networks (BITS2014, Rome)
Differential connectivity in neoplastic coexpression networks (BITS2014, Rome)Differential connectivity in neoplastic coexpression networks (BITS2014, Rome)
Differential connectivity in neoplastic coexpression networks (BITS2014, Rome)Roberto Anglani
 
Cvar modesto council
Cvar modesto councilCvar modesto council
Cvar modesto councilByron Bogaard
 
IRMC2016- Keynote Speech - Giovanni Barone Adesi - Lecture title: “Crude Oil ...
IRMC2016- Keynote Speech - Giovanni Barone Adesi - Lecture title: “Crude Oil ...IRMC2016- Keynote Speech - Giovanni Barone Adesi - Lecture title: “Crude Oil ...
IRMC2016- Keynote Speech - Giovanni Barone Adesi - Lecture title: “Crude Oil ...The Risk, Banking and Finance Society
 

Andere mochten auch (20)

Value at risk
Value at riskValue at risk
Value at risk
 
Value at Risk
Value at RiskValue at Risk
Value at Risk
 
Measuring risk essentials of financial risk management
Measuring risk essentials of financial risk managementMeasuring risk essentials of financial risk management
Measuring risk essentials of financial risk management
 
7. Derivatives Part1 Pdf
7. Derivatives Part1 Pdf7. Derivatives Part1 Pdf
7. Derivatives Part1 Pdf
 
Absolute and Relative VaR of a mutual fund.
Absolute and Relative VaR of a mutual fund.Absolute and Relative VaR of a mutual fund.
Absolute and Relative VaR of a mutual fund.
 
Futures hedging
Futures hedgingFutures hedging
Futures hedging
 
FRM 2007 1. Volatility
FRM 2007 1. VolatilityFRM 2007 1. Volatility
FRM 2007 1. Volatility
 
Quant Primer10x
Quant Primer10xQuant Primer10x
Quant Primer10x
 
Long Term Capital Management (LTCM) Financial Collapse - Risk Management Case...
Long Term Capital Management (LTCM) Financial Collapse - Risk Management Case...Long Term Capital Management (LTCM) Financial Collapse - Risk Management Case...
Long Term Capital Management (LTCM) Financial Collapse - Risk Management Case...
 
Quản trị rủi ro (Value at risk)
Quản trị rủi ro (Value at risk)Quản trị rủi ro (Value at risk)
Quản trị rủi ro (Value at risk)
 
Ch07 hullofod8thedition
Ch07 hullofod8theditionCh07 hullofod8thedition
Ch07 hullofod8thedition
 
Valuation of swaps
Valuation of swapsValuation of swaps
Valuation of swaps
 
VaR Approximation Methods
VaR Approximation MethodsVaR Approximation Methods
VaR Approximation Methods
 
VaR Methodologies Jp Morgan
VaR Methodologies Jp MorganVaR Methodologies Jp Morgan
VaR Methodologies Jp Morgan
 
Arbitrage bounds on option prices
Arbitrage bounds on option pricesArbitrage bounds on option prices
Arbitrage bounds on option prices
 
Bwfn3023 silibus a132
Bwfn3023 silibus a132Bwfn3023 silibus a132
Bwfn3023 silibus a132
 
CVAR Real Estate Road Warrior Apps
CVAR Real Estate Road Warrior AppsCVAR Real Estate Road Warrior Apps
CVAR Real Estate Road Warrior Apps
 
Differential connectivity in neoplastic coexpression networks (BITS2014, Rome)
Differential connectivity in neoplastic coexpression networks (BITS2014, Rome)Differential connectivity in neoplastic coexpression networks (BITS2014, Rome)
Differential connectivity in neoplastic coexpression networks (BITS2014, Rome)
 
Cvar modesto council
Cvar modesto councilCvar modesto council
Cvar modesto council
 
IRMC2016- Keynote Speech - Giovanni Barone Adesi - Lecture title: “Crude Oil ...
IRMC2016- Keynote Speech - Giovanni Barone Adesi - Lecture title: “Crude Oil ...IRMC2016- Keynote Speech - Giovanni Barone Adesi - Lecture title: “Crude Oil ...
IRMC2016- Keynote Speech - Giovanni Barone Adesi - Lecture title: “Crude Oil ...
 

Ähnlich wie Intro to Value at Risk (VaR)

Portfolio selection final
Portfolio selection finalPortfolio selection final
Portfolio selection finalsumit payal
 
Chapter v capital market theory
Chapter v  capital market theoryChapter v  capital market theory
Chapter v capital market theorynirdoshk88
 
Hedge Fund Risks Simulation
Hedge Fund Risks SimulationHedge Fund Risks Simulation
Hedge Fund Risks Simulationkashlik
 
Financial Management Slides Ch 05
Financial Management Slides Ch 05Financial Management Slides Ch 05
Financial Management Slides Ch 05Sayyed Naveed Ali
 
Page 1 of 9 This material is only for the use of stud.docx
Page 1 of 9  This material is only for the use of stud.docxPage 1 of 9  This material is only for the use of stud.docx
Page 1 of 9 This material is only for the use of stud.docxkarlhennesey
 
Bba 2204 fin mgt week 8 risk and return
Bba 2204 fin mgt week 8 risk and returnBba 2204 fin mgt week 8 risk and return
Bba 2204 fin mgt week 8 risk and returnStephen Ong
 
Capital market theory
Capital market theoryCapital market theory
Capital market theoryStudent
 
Ch_05 - Risk and Return Valuation Theory.ppt
Ch_05 - Risk and Return Valuation Theory.pptCh_05 - Risk and Return Valuation Theory.ppt
Ch_05 - Risk and Return Valuation Theory.pptkemboies
 
Ch_05 - Risk and Return Valuation Theory.ppt
Ch_05 - Risk and Return Valuation Theory.pptCh_05 - Risk and Return Valuation Theory.ppt
Ch_05 - Risk and Return Valuation Theory.pptkemboies
 
The effect of VaR-based risk management on asset prices and the volatility s...
The effect of VaR-based risk management on asset prices  and the volatility s...The effect of VaR-based risk management on asset prices  and the volatility s...
The effect of VaR-based risk management on asset prices and the volatility s...Nicha Tatsaneeyapan
 
Risky business: Guide to Risk Management
Risky business: Guide to Risk ManagementRisky business: Guide to Risk Management
Risky business: Guide to Risk ManagementMichael Le
 
Chapter 12.Risk and Return
Chapter 12.Risk and ReturnChapter 12.Risk and Return
Chapter 12.Risk and ReturnZahraMirzayeva
 
CAPM-3-Nt.ppt
CAPM-3-Nt.pptCAPM-3-Nt.ppt
CAPM-3-Nt.pptSafriR
 
Managerial Finance MNQ
Managerial Finance MNQManagerial Finance MNQ
Managerial Finance MNQScott Brown
 
Return.ppt
Return.pptReturn.ppt
Return.pptziena2
 

Ähnlich wie Intro to Value at Risk (VaR) (20)

Fm5
Fm5Fm5
Fm5
 
Portfolio selection final
Portfolio selection finalPortfolio selection final
Portfolio selection final
 
Risk and return
Risk and returnRisk and return
Risk and return
 
Chapter v capital market theory
Chapter v  capital market theoryChapter v  capital market theory
Chapter v capital market theory
 
0273685988 ch05
0273685988 ch050273685988 ch05
0273685988 ch05
 
Hedge Fund Risks Simulation
Hedge Fund Risks SimulationHedge Fund Risks Simulation
Hedge Fund Risks Simulation
 
Financial Management Slides Ch 05
Financial Management Slides Ch 05Financial Management Slides Ch 05
Financial Management Slides Ch 05
 
Page 1 of 9 This material is only for the use of stud.docx
Page 1 of 9  This material is only for the use of stud.docxPage 1 of 9  This material is only for the use of stud.docx
Page 1 of 9 This material is only for the use of stud.docx
 
Bba 2204 fin mgt week 8 risk and return
Bba 2204 fin mgt week 8 risk and returnBba 2204 fin mgt week 8 risk and return
Bba 2204 fin mgt week 8 risk and return
 
Chap011.ppt
Chap011.pptChap011.ppt
Chap011.ppt
 
Capital market theory
Capital market theoryCapital market theory
Capital market theory
 
Ch_05 - Risk and Return Valuation Theory.ppt
Ch_05 - Risk and Return Valuation Theory.pptCh_05 - Risk and Return Valuation Theory.ppt
Ch_05 - Risk and Return Valuation Theory.ppt
 
Ch_05 - Risk and Return Valuation Theory.ppt
Ch_05 - Risk and Return Valuation Theory.pptCh_05 - Risk and Return Valuation Theory.ppt
Ch_05 - Risk and Return Valuation Theory.ppt
 
The effect of VaR-based risk management on asset prices and the volatility s...
The effect of VaR-based risk management on asset prices  and the volatility s...The effect of VaR-based risk management on asset prices  and the volatility s...
The effect of VaR-based risk management on asset prices and the volatility s...
 
Risky business: Guide to Risk Management
Risky business: Guide to Risk ManagementRisky business: Guide to Risk Management
Risky business: Guide to Risk Management
 
Chapter 12.Risk and Return
Chapter 12.Risk and ReturnChapter 12.Risk and Return
Chapter 12.Risk and Return
 
CAPM-3-Nt.ppt
CAPM-3-Nt.pptCAPM-3-Nt.ppt
CAPM-3-Nt.ppt
 
Managerial Finance MNQ
Managerial Finance MNQManagerial Finance MNQ
Managerial Finance MNQ
 
Return.ppt
Return.pptReturn.ppt
Return.ppt
 
risk and return
risk and returnrisk and return
risk and return
 

Kürzlich hochgeladen

Classical Theory of Macroeconomics by Adam Smith
Classical Theory of Macroeconomics by Adam SmithClassical Theory of Macroeconomics by Adam Smith
Classical Theory of Macroeconomics by Adam SmithAdamYassin2
 
The AES Investment Code - the go-to counsel for the most well-informed, wise...
The AES Investment Code -  the go-to counsel for the most well-informed, wise...The AES Investment Code -  the go-to counsel for the most well-informed, wise...
The AES Investment Code - the go-to counsel for the most well-informed, wise...AES International
 
Economics, Commerce and Trade Management: An International Journal (ECTIJ)
Economics, Commerce and Trade Management: An International Journal (ECTIJ)Economics, Commerce and Trade Management: An International Journal (ECTIJ)
Economics, Commerce and Trade Management: An International Journal (ECTIJ)ECTIJ
 
Governor Olli Rehn: Dialling back monetary restraint
Governor Olli Rehn: Dialling back monetary restraintGovernor Olli Rehn: Dialling back monetary restraint
Governor Olli Rehn: Dialling back monetary restraintSuomen Pankki
 
原版1:1复刻温哥华岛大学毕业证Vancouver毕业证留信学历认证
原版1:1复刻温哥华岛大学毕业证Vancouver毕业证留信学历认证原版1:1复刻温哥华岛大学毕业证Vancouver毕业证留信学历认证
原版1:1复刻温哥华岛大学毕业证Vancouver毕业证留信学历认证rjrjkk
 
Economic Risk Factor Update: April 2024 [SlideShare]
Economic Risk Factor Update: April 2024 [SlideShare]Economic Risk Factor Update: April 2024 [SlideShare]
Economic Risk Factor Update: April 2024 [SlideShare]Commonwealth
 
House of Commons ; CDC schemes overview document
House of Commons ; CDC schemes overview documentHouse of Commons ; CDC schemes overview document
House of Commons ; CDC schemes overview documentHenry Tapper
 
Stock Market Brief Deck for 4/24/24 .pdf
Stock Market Brief Deck for 4/24/24 .pdfStock Market Brief Deck for 4/24/24 .pdf
Stock Market Brief Deck for 4/24/24 .pdfMichael Silva
 
NO1 Certified Ilam kala Jadu Specialist Expert In Bahawalpur, Sargodha, Sialk...
NO1 Certified Ilam kala Jadu Specialist Expert In Bahawalpur, Sargodha, Sialk...NO1 Certified Ilam kala Jadu Specialist Expert In Bahawalpur, Sargodha, Sialk...
NO1 Certified Ilam kala Jadu Specialist Expert In Bahawalpur, Sargodha, Sialk...Amil Baba Dawood bangali
 
Managing Finances in a Small Business (yes).pdf
Managing Finances  in a Small Business (yes).pdfManaging Finances  in a Small Business (yes).pdf
Managing Finances in a Small Business (yes).pdfmar yame
 
212MTAMount Durham University Bachelor's Diploma in Technology
212MTAMount Durham University Bachelor's Diploma in Technology212MTAMount Durham University Bachelor's Diploma in Technology
212MTAMount Durham University Bachelor's Diploma in Technologyz xss
 
Stock Market Brief Deck for "this does not happen often".pdf
Stock Market Brief Deck for "this does not happen often".pdfStock Market Brief Deck for "this does not happen often".pdf
Stock Market Brief Deck for "this does not happen often".pdfMichael Silva
 
call girls in Nand Nagri (DELHI) 🔝 >༒9953330565🔝 genuine Escort Service 🔝✔️✔️
call girls in  Nand Nagri (DELHI) 🔝 >༒9953330565🔝 genuine Escort Service 🔝✔️✔️call girls in  Nand Nagri (DELHI) 🔝 >༒9953330565🔝 genuine Escort Service 🔝✔️✔️
call girls in Nand Nagri (DELHI) 🔝 >༒9953330565🔝 genuine Escort Service 🔝✔️✔️9953056974 Low Rate Call Girls In Saket, Delhi NCR
 
Vp Girls near me Delhi Call Now or WhatsApp
Vp Girls near me Delhi Call Now or WhatsAppVp Girls near me Delhi Call Now or WhatsApp
Vp Girls near me Delhi Call Now or WhatsAppmiss dipika
 
Call Girls Near Delhi Pride Hotel, New Delhi|9873777170
Call Girls Near Delhi Pride Hotel, New Delhi|9873777170Call Girls Near Delhi Pride Hotel, New Delhi|9873777170
Call Girls Near Delhi Pride Hotel, New Delhi|9873777170Sonam Pathan
 
BPPG response - Options for Defined Benefit schemes - 19Apr24.pdf
BPPG response - Options for Defined Benefit schemes - 19Apr24.pdfBPPG response - Options for Defined Benefit schemes - 19Apr24.pdf
BPPG response - Options for Defined Benefit schemes - 19Apr24.pdfHenry Tapper
 
《加拿大本地办假证-寻找办理Dalhousie毕业证和达尔豪斯大学毕业证书的中介代理》
《加拿大本地办假证-寻找办理Dalhousie毕业证和达尔豪斯大学毕业证书的中介代理》《加拿大本地办假证-寻找办理Dalhousie毕业证和达尔豪斯大学毕业证书的中介代理》
《加拿大本地办假证-寻找办理Dalhousie毕业证和达尔豪斯大学毕业证书的中介代理》rnrncn29
 

Kürzlich hochgeladen (20)

Classical Theory of Macroeconomics by Adam Smith
Classical Theory of Macroeconomics by Adam SmithClassical Theory of Macroeconomics by Adam Smith
Classical Theory of Macroeconomics by Adam Smith
 
The AES Investment Code - the go-to counsel for the most well-informed, wise...
The AES Investment Code -  the go-to counsel for the most well-informed, wise...The AES Investment Code -  the go-to counsel for the most well-informed, wise...
The AES Investment Code - the go-to counsel for the most well-informed, wise...
 
Economics, Commerce and Trade Management: An International Journal (ECTIJ)
Economics, Commerce and Trade Management: An International Journal (ECTIJ)Economics, Commerce and Trade Management: An International Journal (ECTIJ)
Economics, Commerce and Trade Management: An International Journal (ECTIJ)
 
Governor Olli Rehn: Dialling back monetary restraint
Governor Olli Rehn: Dialling back monetary restraintGovernor Olli Rehn: Dialling back monetary restraint
Governor Olli Rehn: Dialling back monetary restraint
 
原版1:1复刻温哥华岛大学毕业证Vancouver毕业证留信学历认证
原版1:1复刻温哥华岛大学毕业证Vancouver毕业证留信学历认证原版1:1复刻温哥华岛大学毕业证Vancouver毕业证留信学历认证
原版1:1复刻温哥华岛大学毕业证Vancouver毕业证留信学历认证
 
Economic Risk Factor Update: April 2024 [SlideShare]
Economic Risk Factor Update: April 2024 [SlideShare]Economic Risk Factor Update: April 2024 [SlideShare]
Economic Risk Factor Update: April 2024 [SlideShare]
 
🔝+919953056974 🔝young Delhi Escort service Pusa Road
🔝+919953056974 🔝young Delhi Escort service Pusa Road🔝+919953056974 🔝young Delhi Escort service Pusa Road
🔝+919953056974 🔝young Delhi Escort service Pusa Road
 
House of Commons ; CDC schemes overview document
House of Commons ; CDC schemes overview documentHouse of Commons ; CDC schemes overview document
House of Commons ; CDC schemes overview document
 
Stock Market Brief Deck for 4/24/24 .pdf
Stock Market Brief Deck for 4/24/24 .pdfStock Market Brief Deck for 4/24/24 .pdf
Stock Market Brief Deck for 4/24/24 .pdf
 
NO1 Certified Ilam kala Jadu Specialist Expert In Bahawalpur, Sargodha, Sialk...
NO1 Certified Ilam kala Jadu Specialist Expert In Bahawalpur, Sargodha, Sialk...NO1 Certified Ilam kala Jadu Specialist Expert In Bahawalpur, Sargodha, Sialk...
NO1 Certified Ilam kala Jadu Specialist Expert In Bahawalpur, Sargodha, Sialk...
 
Managing Finances in a Small Business (yes).pdf
Managing Finances  in a Small Business (yes).pdfManaging Finances  in a Small Business (yes).pdf
Managing Finances in a Small Business (yes).pdf
 
212MTAMount Durham University Bachelor's Diploma in Technology
212MTAMount Durham University Bachelor's Diploma in Technology212MTAMount Durham University Bachelor's Diploma in Technology
212MTAMount Durham University Bachelor's Diploma in Technology
 
Stock Market Brief Deck for "this does not happen often".pdf
Stock Market Brief Deck for "this does not happen often".pdfStock Market Brief Deck for "this does not happen often".pdf
Stock Market Brief Deck for "this does not happen often".pdf
 
Monthly Economic Monitoring of Ukraine No 231, April 2024
Monthly Economic Monitoring of Ukraine No 231, April 2024Monthly Economic Monitoring of Ukraine No 231, April 2024
Monthly Economic Monitoring of Ukraine No 231, April 2024
 
call girls in Nand Nagri (DELHI) 🔝 >༒9953330565🔝 genuine Escort Service 🔝✔️✔️
call girls in  Nand Nagri (DELHI) 🔝 >༒9953330565🔝 genuine Escort Service 🔝✔️✔️call girls in  Nand Nagri (DELHI) 🔝 >༒9953330565🔝 genuine Escort Service 🔝✔️✔️
call girls in Nand Nagri (DELHI) 🔝 >༒9953330565🔝 genuine Escort Service 🔝✔️✔️
 
Vp Girls near me Delhi Call Now or WhatsApp
Vp Girls near me Delhi Call Now or WhatsAppVp Girls near me Delhi Call Now or WhatsApp
Vp Girls near me Delhi Call Now or WhatsApp
 
Call Girls Near Delhi Pride Hotel, New Delhi|9873777170
Call Girls Near Delhi Pride Hotel, New Delhi|9873777170Call Girls Near Delhi Pride Hotel, New Delhi|9873777170
Call Girls Near Delhi Pride Hotel, New Delhi|9873777170
 
BPPG response - Options for Defined Benefit schemes - 19Apr24.pdf
BPPG response - Options for Defined Benefit schemes - 19Apr24.pdfBPPG response - Options for Defined Benefit schemes - 19Apr24.pdf
BPPG response - Options for Defined Benefit schemes - 19Apr24.pdf
 
《加拿大本地办假证-寻找办理Dalhousie毕业证和达尔豪斯大学毕业证书的中介代理》
《加拿大本地办假证-寻找办理Dalhousie毕业证和达尔豪斯大学毕业证书的中介代理》《加拿大本地办假证-寻找办理Dalhousie毕业证和达尔豪斯大学毕业证书的中介代理》
《加拿大本地办假证-寻找办理Dalhousie毕业证和达尔豪斯大学毕业证书的中介代理》
 
Q1 2024 Newsletter | Financial Synergies Wealth Advisors
Q1 2024 Newsletter | Financial Synergies Wealth AdvisorsQ1 2024 Newsletter | Financial Synergies Wealth Advisors
Q1 2024 Newsletter | Financial Synergies Wealth Advisors
 

Intro to Value at Risk (VaR)

  • 1. Value at Risk (VaR) – Part 1 (LOs 7.1 – 8.7 , 12.1 – 13.9, 15.1-15.5) Intro to VaR (Allen Chapter 1) 1 VaR Mapping 4 VaR Methods 5 Cash flow at Risk (CFaR) 2 Putting VaR to Work (Allen Chapter 3) 3 Stress Testing 6
  • 2. Value at Risk (VaR) in the Readings We are reviewing here (Sec II) Was reviewed in Quant (Sec I) To be reviewed in Investments (Sec V) Learning Outcome Location in Study Guide Reading LO 7.1 to 7.6 II. Market 1.A. Intro to VaR Allen Ch. 1 LO 7.7 to 7.15 II. Market 1.B. Putting VaR to work Allen Ch. 3 LO 8.1 to 8.7 II. Market 6.A. Firm-wide Approach to Risk Stulz Ch. 4 LO 9.1 to 9.11 V. Investment 6.A. Portfolio Risk Jorion Ch. 7 LO 10.1 10.7 I. Quant 3.A. Forecasting Risk and Correlation Jorion Ch. 9 LO 11.1 to 11.10 I. Quant 1. Quantifying Volatility Allen Ch. 2
  • 3. We are reviewing here (Sec II) Was reviewed in Quant (Sec I) To be reviewed in Investments (Sec V) Value at Risk (VaR) in the Readings Learning Outcome Location in Study Guide Reading LO 12.1 to 12.6 II. Market 3.A. VaR Methods Jorion Ch. 10 LO 13.1 to 13.9 II. Market 3.B. VaR Mapping Jorion Ch. 11 LO 14.1 to 14.7 I. Quant 3.B. MCS Jorion Ch. 12 LO 15.1 to 15.5 I. Market 3.C Stress Testing Jorion Ch. 14 LO 16.1 to 16.3 I. Quant 4. EVT Kalyvas Ch. 4 LO 17.1 17.13 V. Investment 6.B. Budgeting in I/M Jorion Ch. 17
  • 4.
  • 5.
  • 6.
  • 7.
  • 8.
  • 9.
  • 10.
  • 11.
  • 12. Value at Risk (VaR) - % Basis -1.645  One-Period VaR (n=1) and 95% confidence (5% significance)
  • 13. Value at Risk (VaR) – Dollar Basis -1.645  One-Period VaR (n=1) and 95% confidence (5% significance)
  • 14. 10-period VaR @ 5% significance -1.645  10 10-Period VaR (n=10) and 95% confidence (5% significance)
  • 15. 10-period (10-day) VaR 5% significance, annual  = +12% $100(1+  ) +0.48 ($95.30)
  • 16. Absolute versus Relative VaR $100(1+  ) $100  $5.20  $4.73
  • 17. Absolute VaR $100(1+  ) $100
  • 19.
  • 20.
  • 21.
  • 22.
  • 23.
  • 24.
  • 25.
  • 26.
  • 27.
  • 28.
  • 29.
  • 30.
  • 31.
  • 32.
  • 33.
  • 34.
  • 35.
  • 36.
  • 37.
  • 38.
  • 39.
  • 40.
  • 41.
  • 42.
  • 43.
  • 44.
  • 45.
  • 46.
  • 47.
  • 48.
  • 49.
  • 50.
  • 51.
  • 52.
  • 53.
  • 54.
  • 55.
  • 56.
  • 57.
  • 58.
  • 59.
  • 60.
  • 61.
  • 62.
  • 63.
  • 64.
  • 65.
  • 66.
  • 67.
  • 68.
  • 69.
  • 70.
  • 71.
  • 72.
  • 73.
  • 74.
  • 75.
  • 76.
  • 77.
  • 78.
  • 79.
  • 80.
  • 81.
  • 82.
  • 83.
  • 84.
  • 85.
  • 86.
  • 87.
  • 88.
  • 89.
  • 90.
  • 91.
  • 92.
  • 93.
  • 94.
  • 95. VaR of nonlinear derivative
  • 96. VaR of nonlinear derivative
  • 97. VaR of nonlinear derivative
  • 98. Taylor approximation AIM: Explain how the addition of second-order terms through the Taylor approximation improves the estimate of VAR for non-linear derivatives 1. Constant approximation 2. First-order (linear) approximation 3. Second-order (quadratic) approximation
  • 99. Taylor approximation AIM: Explain how the addition of second-order terms through the Taylor approximation improves the estimate of VAR for non-linear derivatives
  • 100.
  • 101.
  • 102.
  • 104.
  • 105. Scenario Analysis Evaluate Correlation Matrix Under Scenarios ERM Crisis (92) Mexican Crisis (94) Crash Of 1987 Gulf War (90) Asian Crisis (’97/8)
  • 106. Scenario Analysis AIM: Discuss the implications of correlation breakdown for scenario analysis Severe stress events wreak havoc on the covariance matrix
  • 107.
  • 108. Scenario Analysis Historical events + Can inform on portfolio weaknesses - But could miss weaknesses unique to the portfolio Stress Scenarios + Gives exposure to standard risk factors - But may generate unwarranted red flags - May not perform well in regard to asset-class-specific risk AIM: Describe the primary approaches to stress testing and the advantages and disadvantages of each approach
  • 109.
  • 111. Random Variables + + + Short-term Asset Returns Probability distributions are models of random behavior + + + - - - - - - - ? ? ?
  • 112.
  • 113.
  • 114.
  • 115.
  • 116.
  • 117.
  • 118.
  • 119.
  • 120.
  • 121.
  • 122.
  • 123.
  • 124.
  • 125.
  • 126.
  • 127.
  • 128.
  • 129.
  • 130.
  • 131. Covariance & correlation X Y (X-X avg )(Y-Y avg ) 3 5 0.0 2 4 1.0 4 6 1.0 Avg = 3 Avg = 5 Avg = .67 s.d. = SQRT(.67) s.d. = SQRT(.67) Correl. = 1.0
  • 132.
  • 133.
  • 134.
  • 135.
  • 138.
  • 139.
  • 140.
  • 141.
  • 142.
  • 143.
  • 146. PDF
  • 149. Comparison Probability Density Function (pdf) Cumulative Distribution Discrete variable Continuous variable
  • 150.
  • 151.
  • 154.
  • 160.
  • 163. A Big Problem with Normal
  • 164. Normal
  • 165. Normal
  • 166.
  • 167.
  • 168.
  • 170.
  • 171.
  • 172.
  • 173.
  • 174.
  • 175. Lognormal Transform x-axis To logarithmic scale
  • 177.
  • 178.
  • 179.
  • 180.
  • 181.
  • 182.
  • 183. Geo & Arithmetic mean 2003 5.0% 2004 8.0% 2005 (3.0%) 2006 9.0% Geo. Arith.
  • 184. Geo & Arithmetic mean 2003 5.0% 1.05 2004 8.0% 1.08 2005 (3.0%) 0.97 2006 9.0% 1.09  1.199 Geo. 4.641% Arith. 4.75%
  • 185.
  • 186.
  • 187.
  • 188.
  • 189.
  • 190.
  • 191.
  • 192.
  • 193.
  • 194.
  • 195.
  • 196.
  • 197.
  • 198.