1. Q3 2010 | OFFICE MARKET
HOUSTON OFFICE MARKET
RESEARCH & FORECAST REPORT
Houston Suburban Office Market
Continues to Outpace CBD
Houston’s office market at the close of 3Q2010 showed a slight improvement from the previous
quarter, with a stronger performing suburban sector, compared to the Central Business District (CBD).
Although leasing activity picked up, vacancy increased slightly. Year-over-year change in office
occupancy citywide was moderate with 83.3 percent occupancy at the end of the third quarter
compared to 83.8 percent in the same quarter last year. Quoted rental rates citywide for Class A space
MARKET INDICATORS decreased 0.4 percent, with the CBD Class A decreasing 2.0 percent to $35.16 per square foot, while
Q3-09 Q3-10 suburban Class A space decreased a minimal 0.2 percent to $27.30 per square foot. Net absorption
NET ABSORPTION (SF) also showed the combined suburban markets outperforming the CBD. While the CBD’s year-to-date net
6k (26k) absorption was negative 553,516 square feet, the suburban markets’ combined net absorption was
positive at 242,261 square feet. Even with weak pockets scattered citywide, the suburban market
CITYWIDE AVERAGE VACANCY
trends continue to indicate this sector will plateau sooner, and will likely lead the office market
16.2% 16.6% recovery.
CITYWIDE AVERAGE RENTAL RATE
Looking forward, several key events are contributing to a more cautious outlook for the local downtown
$22.82 $23.11 office market over the next 6–12 months. The recently approved merger between Houston-based
CLASS A RENTAL RATE Continental Airlines and Chicago-based United Airlines expected to close by year-end will not
CBD $37.45 $35.16 negatively impact CBD Class A occupancy in the near-term. According to a source close to the deal,
Continental’s lease doesn’t expire until 2014 and the space will not be offered for sublease for 12-24
SUBURBAN $26.84 $27.30
months. The top concern for the CBD Class A market is the completion of speculative new
CLASS A VACANCY
construction. Hines’ 972,474-square-foot MainPlace is currently 10 percent leased and expected to be
CBD 8.8% 10.1% completed by February 2011. Securing an anchor tenant before final delivery, however, remains a
SUBURBAN 18.4% 19.3% possibility as was the case with the only other new office building underway downtown—Trammell
Crow Company’s 844,763-square-foot Hess Tower—100 percent pre-leased to Hess Corporation and
scheduled to open in October 2010.
UNEMPLOYMENT 08/09 08/10
According to the Texas Labor Market Review, Texas MSA’s have experienced job gains in six out of
HOUSTON 8.2% 8.7% eight months so far this year. Although Houston isn’t the top performing MSA in Texas, Houston
TEXAS 8.0% 8.3% continues to be recognized as one of the strongest metros in the U.S. for business activity, with the
U.S. 9.7% 9.6% employment sector reporting marked improvement from this time last year. In the 12 months ending in
#
August 2010, Houston’s job loss totaled 18,300, significantly below the 100,000 jobs lost in 2009, with
JOB GROWTH %
the local MSA projected to end 2010 with positive job growth. The area’s above-average population
HOUSTON -0.04% (0.9k)
growth spurring the need for increased services is also a positive contributing factor in Houston’s
TEXAS 1.3% 129k strong long-term outlook.
U.S. -0.1% (183k)
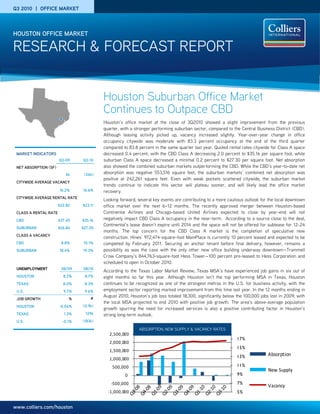
ABSORPTION, NEW SUPPLY & VACANCY RATES
2,500,000
17%
2,000,000
15%
1,500,000
13% Absorption
1,000,000
500,000 11%
New Supply
0 9%
-500,000 7%
Vacancy
-1,000,000 5%
www.colliers.com/houston
2. RESEARCH & FORECAST REPORT | Q3 2010 | HOUSTON OFFICE MARKET
OCCUPANCY & AVAILABILITY ABSORPTION & DEMAND
CBD VS. SUBURBAN With the exception of suburban Class B properties, Houston recorded negative net absorption of
CLASS A OFFICE VACANCY occupancy levels citywide have decreased at a 25,586 square feet in the third quarter, compared
slow pace over the past year. Houston’s office to 248,351 square feet negative net absorption at
20.0%
occupancy for all property classes averaged 83.3 the same time last year. City-wide year-to-date
18.0%
16.0%
percent in the second quarter, compared to 83.8 net absorption is negative 311,225 square feet
14.0%
percent this time last year. Despite the incremental with CBD Class A product contributing most of
12.0%
decreases, however, the ongoing softness in the that with year-to-date negative net absorption of
10.0% employment sector is not likely to reverse current 435,872 square feet, followed by CBD Class B
8.0% occupancy trends in the near future. with negative net absorption at 131,085 square
6.0% In the CBD, top-tier properties’ resilience waned feet. In contrast, suburban Class A and B have
4.0% between quarters, inching up into double-digit managed to maintain modest positive net
vacancy, with Class A occupancy at 89.9 percent, absorption year-to-date with 72,499 and 101,149
Q3-09 Q4-09 Q1-10 Q2-10 Q3-10
compared to 91.2 percent one year ago. In sharp square feet, respectively.
CBD VACANCY SUBURBAN VACANCY contrast, the CBD Class B posted 76.9 percent Prevailing economic uncertainty is likely to
occupancy, down from 78.3 percent 12 months continue negatively impacting overall absorption
earlier. levels through the end of 2010.
While the overall suburban occupancy rate RENTAL RATES
CLASS A OFFICE RENTS
remained relatively flat between quarters, double-
$40.00 After declining during the first two quarters of
digit vacancy continued for all suburban property
$38.00 2010, rental rates for all property classes
classes at midyear. Suburban Class A occupancy
$36.00
remained relatively flat between quarters.
fell to 80.7 percent at the end of the third quarter
$34.00 from 87.4 percent last year. By comparison, On a year-over-year basis, CBD Class A average
$32.00 suburban Class B occupancy rose a modest 0.1 quoted rental rates actually fell by 6.1 percent to
$30.00 percent to 83.5 during the same period. $35.16 per square foot (from $37.45), while
$28.00 suburban Class A rates increased 1.7 percent to
Citywide, a total of 56 office properties had
$26.00 $27.30 per square foot. CBD Class B rates
100,000 square feet or more available for lease in
posted a 1.8 percent increase to $23.87 per
Q3-09 Q4-09 Q1-10 Q2-10 Q3-10 both direct and sublease space—16 of those
square foot (from $23.46), while suburban Class
properties have over 200,000 square feet
B rates fell 0.4 percent to $17.88 per square foot
CBD RENTS SUBURBAN RENTS available—at the end of the third quarter. Sublease
on a full-service basis. While supply continues to
space totaled 3.8 million square feet, including 2
outpace demand, the current office tenants’
million square feet of vacant space and 1.8 million
market is expected to continue through the end of
square feet of subleases available for occupancy
the year.
over the next 12 months. The largest sublease
space being marketed is Devon Energy’s space,
281,755 square feet in Two Allen Center and
186,462 square feet in Three Allen Center
(available for occupancy 4/2011) in the CBD. In
Westchase, 2103 CityWestPlace has the largest
suburban sublease space available, 128,770 square
feet.
QUOTED GROSS RENTAL RATES FOR TOP PERFORMING OFFICE BUILDINGS
BUILDING NAME ADDRESS SUBMARKET RBA (SF) YEAR BUILT LEASED AVAIL. SF RENT ($/SF) OWNER
Wells Fargo Plaza 1000 Louisiana CBD 1,721,242 1983 94.6% 157,326 $40.96 Metropolitan Life Insurance Co.
Heritage Plaza 1111 Bagby CBD 1,149,635 1986 90.4% 110,365 $40.53 Goddard Investment Group
1100 Louisiana 1100 Louisiana CBD 1,265,332 1980 99.7% 17,605 $39.74 Enterprise Products Partners
One Eldridge Place 777 N. Eldridge Pkwy. Energy Corridor 239,417 1985/2001 91.4% 20,590 $29.50 Behringer Harvard
Offices at Park 10 16290 Katy Freeway Energy Corridor 157,000 2006 97.8% 3,428 $29.00 Franklin Street Properties
Minute Maid Building 2150 Town Square Place E. Fort Bend 185,000 2008 78.3% 40,145 $28.50 Planned Community Developers
Wells Fargo Tower 1300 Post Oak Blvd. Galleria 491,254 1983 93.6% 31,440 $33.00 TIAA-CREF
Five Post Oak Park 4400 Post Oak Pkwy. Galleria 567,396 1982 95.1% 27,802 $32.83 Shorenstein Company
Marathon Oil Tower 5555 San Felipe Galleria 1,178,750 1983 92.9% 83,616 $28.71 Hanover Real Estate Partners
11 Greenway Plaza 11 Greenway Greenway 745,956 1978 91.1% 66,390 $29.15 Crescent Real Estate Equities
One BriarLake Plaza 2000 W. Sam Houston Westchase 502,410 2000 95.8% 21,101 $39.73 Behringer Harvard
Waterway Square 4 Waterway Ave. Woodlands 232,364 2009 45.6% 126,406 $36.73 The Woodlands Development Co.
COLLIERS INTERNATIONAL | P. 2
3. RESEARCH & FORECAST REPORT | Q3 2010 | HOUSTON OFFICE MARKET
SALES ACTIVITY Significant new office leases (non-renewal) signed in the third quarter
Investment sales activity in the third quarter remained at a slow pace with include:
a handful of suburban properties changing hands. Year-to-date through the Weatherford International leased 335,000 Sq. Ft. at 2000 St. James
third quarter, office transactions totaled 29 with a total dollar volume of Place, relocating from 515 Post Oak, both located in the Galleria
$948 million, averaging $205 per square foot with an 8.4 percent submarket. Aker Solutions leased 133,417 Sq. Ft. at 3010 Briarpark,
capitalization rate. relocating from 3600 Briarpark, both located in the Westchase
Among the most significant transactions closed in the third quarter are: submarket.
American National Insurance acquired the 153,345-square-foot Three The largest office lease renewal signed in the third quarter was
Sugar Creek from Harry M. Green Interests for $28.5 million ($186 per Mustang Engineering’s early renewal of 248,872 square feet in Ten
square foot). Located in the E Ft Bend/Sugar Land submarket, the building West Corporate Center II located in the Katy Freeway submarket.
was completed in 2007, and at the time of sale was 45 percent leased to Shell Oil Company signed the largest sublease during the quarter,
Aetna. 300,000 Sq. Ft. in 1000 Main located in the CBD submarket.
Healthcare Trust of America acquired a 176,000-square-foot medical
office building located at 7900 Fannin in the Medical Center from
Stonehenge Development for $45.5 million ($257 per square foot).
Lincoln Property Co acquired Energy Crossing from M&I Bank. The six-
story building located on I-10 at Hwy 6 was purchased with the adjacent
5.5 acres of land that is designed for additional office space as well as a
1.2 acre retail parcel. The sales price was not disclosed.
LEASING ACTIVITY
Houston’s office leasing activity reached 3.2 million square feet in the third
quarter, compared to 3.9 million square feet in the same quarter last year.
Although still below levels before the recession, an increasing number of
office tenants are renewing lease commitments with better concession
packages or relocating to buildings/submarkets offering more attractive
terms.
SIGNIFICANT SALES TRANSACTIONS CLOSED IN THE Q3 2010
YEAR SALE
BUILDING NAME SUBMARKET RBA (SF) BUYER SELLER $/SF CLOSED
BUILT PRICE
7900 Fannin St. Medical Center 176,000 2004 Healthcare Trust of America Stonehenge Development $45.4M $257 06/2010
Three Sugar Creek Ft Bend/Sugar Land 153,345 2007 American National Insurance Harry M. Green Interests $28.5M $186 07/2010
5050 Westheimer Galleria/Uptown 162,909 1965 Black Forest Ventures LLC Stanford Financial Group $12.2M $172 07/2010
2010 TOP OFFICE LEASES (YTD)
BUILDING NAME/ADDRESS SUBMARKET SF TENANT LEASE DATE
KBR Tower CBD 883,487 KBR* 02/2010
2000 St. James Place West Loop/Galleria 335,000 Weatherford International 09/2010
1000 Main CBD 300,000 Shell Oil Co. 09/2010
Cullen Center CBD 291,536 KBR** 02/2010
Ten West Corporate Center II Katy Freeway 248,872 Mustang Engineering** 09/2010
Once Commerce Green Greenspoint 205,000 Nabors Corporate Services, Inc.** 08/2010
Galleria Tower II West Loop/Galleria 193,000 Southern Union 09/2010
Two Eldridge Place Katy Freeway 190,000 McDermott** 09/2010
Pinnacle Westchase Westchase 133,417 Aker Solutions 08/2010
Post Oak Central III West Loop/Galleria 130,846 SUEZ Energy** 05/2010
Wells Fargo Plaza CBD 122,896 U.S. General Services Administration 04/2010
5150 Westway Park Blvd. Northwest 92,420 CyrusOne 03/2010
Two Westlake Park Katy Freeway 92,000 BP** 09/2010
Williams Tower West Loop/Galleria 78,841 Rowan Cos.** 08/2010
Park Towers West Loop/Galleria 75,000 Cooper Cameron** 08/2010
2500 CityWest Westchase 68,000 TGS-NOPEC Geophysical 08/2010
*Renewal of 695,000 SF and expansion of 187,687 SF, **Renewal
COLLIERS INTERNATIONAL | P. 3
4. RESEARCH & FORECAST REPORT | Q3 2010 | HOUSTON OFFICE MARKET
HOUSTON OFFICE MARKET SUMMARY (CBD, SUBURBAN & CITYWIDE)
INVENTORY DIRECT VACANCY SUBLEASE VACANCY VACANCY VACANCY RATE (%) NET ABSORPTION (SF) RENTAL RATE
CLASS TOTAL (SF) (SF) RATE (%) (SF) RATE (%) TOTAL (SF) Q3-2010 Q2-2010 Q3-2010 YTD AVG ($/SF)
CBD
A 26,726,873 2,282,115 8.5% 407,328 1.5% 2,689,443 10.1% 9.3% (194,016) (435,872) $35.16
B 8,816,266 1,974,148 22.4% 61,710 0.7% 2,035,858 23.1% 23.0% (4,442) (131,085) $23.87
C 1,426,156 781,947 54.8% 0 0.0% 781,947 54.8% 54.0% (11,827) 13,441 $16.15
TOTAL 36,969,295 5,038,210 13.6% 469,038 1.3% 5,507,248 14.9% 14.3% (210,285) (553,516) $29.87
SUBURBAN
A 68,523,499 12,509,859 18.3% 725,597 1.1% 13,235,456 19.3% 19.6% 221,943 72,499 $27.30
B 69,810,068 10,796,668 15.5% 778,415 1.1% 11,366,648 16.3% 16.3% (34,158) 101,149 $17.88
C 19,303,683 2,174,524 11.3% 36,615 0.2% 2,127,764 11.0% 11.3% (3,086) 68,613 $14.73
TOTAL 157,637,250 25,481,051 16.2% 1,540,627 1.0% 26,729,868 17.0% 17.1% 184,699 242,261 $21.77
OVERALL
A 95,250,372 14,791,974 15.5% 1,132,925 1.2% 15,924,899 16.7% 16.6% 27,927 (363,373) $28.92
B 78,626,334 12,770,816 16.2% 840,125 1.1% 13,402,506 17.1% 17.0% (38,600) (29,936) $18.65
C 20,729,839 2,956,471 14.3% 36,615 0.2% 2,909,711 14.0% 14.2% (14,913) 82,054 $14.94
TOTAL 194,606,545 30,519,261 15.7% 2,009,665 1.0% 32,237,116 16.6% 16.5% (25,586) (311,225) $23.11
HOUSTON SUBURBAN OFFICE MARKET SUMMARY
INVENTORY DIRECT VACANCY SUBLEASE VACANCY VACANCY VACANCY RATE (%) NET ABSORPTION (SF) RENTAL RATE
CLASS TOTAL (SF) (SF) RATE (%) (SF) RATE (%) TOTAL (SF) Q3-2010 Q3-2010 YTD AVG ($/SF)
ALLEN PARKWAY
A 1,217,048 211,890 17.4% 120,877 9.9% 332,767 27.3% (1,191) 16,824 $28.44
B 3,081,442 218,692 7.1% 2,636 0.1% 221,328 7.3% 4,470 (36,202) $23.21
C 1,164,650 408,533 35.1% 0 0.0% 408,533 35.1% 1,779 12,563 $19.39
TOTAL 5,463,140 839,115 15.4% 123,513 2.3% 962,628 17.6% 5,058 (6,815) $24.83
BAYTOWN
B 525,544 4,600 0.9% 0 0.0% 4,600 0.9% 0 800 $18.08
C 60,396 2,603 4.3% 0 0.0% 2,603 4.3% 2,184 2,184 $15.76
TOTAL 585,940 7,203 1.2% 0 0.0% 7,203 1.2% 2,184 2,984 $17.24
BELLAIRE
A 1,389,252 114,770 8.3% 28,288 2.0% 143,058 10.3% (21,339) (27,924) $22.54
B 952,823 44,060 4.6% 60,131 6.3% 104,191 10.9% (60,486) (53,624) $19.19
C 546,968 47,592 8.7% 0 0.0% 47,592 8.7% (7,111) (15,391) $15.09
TOTAL 2,889,043 206,442 7.1% 80,419 3.1% 294,841 10.2% (88,936) (96,939) $20.55
CONROE
A 60,000 0 0.0% 0 0.0% 0 0.0% 0 0 -
B 192,859 14,282 7.4% 0 0.0% 14,282 7.4% 112 6,264 $16.24
C 157,335 4,275 2.7% 0 0.0% 4,275 2.7% 0 0 $15.00
TOTAL 410,194 18,557 4.5% 0 0.0% 18,557 4.5% 112 6,264 $15.79
E. FORT BEND
A 3,535,437 1,094,685 31.0% 15,069 0.4% 1,109,754 31.4% 31,178 (452,768) $27.15
B 2,061,851 311,867 15.1% 2,999 0.1% 314,866 15.3% (20,295) 5,103 $18.29
C 163,968 2,820 1.7% 0 0.0% 2,820 1.7% 810 5,272 $17.50
TOTAL 5,761,256 1,409,372 24.5% 18,068 0.3% 1,427,440 24.8% 11,693 (442,393) $23.73
COLLIERS INTERNATIONAL | P. 4
5. RESEARCH & FORECAST REPORT | Q3 2010 | HOUSTON OFFICE MARKET
HOUSTON SUBURBAN OFFICE MARKET SUMMARY
INVENTORY DIRECT VACANCY SUBLEASE VACANCY VACANCY VACANCY RATE (%) NET ABSORPTION (SF) RENTAL RATE
CLASS TOTAL (SF) (SF) RATE (%) (SF) RATE (%) TOTAL (SF) Q3-2010 Q3-2010 YTD AVG ($/SF)
FM 1960
A 2,267,021 1,487,314 65.6% 2,071 0.1% 1,489,385 65.7% 36 33,500 $26.12
B 4,669,277 962,648 20.6% 61,797 1.3% 1,024,445 21.9% (27,535) 39,590 $15.55
C 762,145 62,778 8.2% 2,463 0.3% 65,241 8.6% 7,640 24,546 $14.50
TOTAL 7,698,443 2,512,740 32.6% 66,331 0.9% 2,579,071 33.5% (19,859) 97,636 $19.37
GREENWAY
A 6,167,603 973,500 15.8% 136,251 2.2% 1,109,751 18.0% 25,077 (42,338) $27.27
B 2,551,339 254,628 10.0% 1,459 0.1% 256,087 10.0% 22,356 (7,678) $21.16
C 924,839 262,270 28.4% 0 0.0% 262,270 28.4% 1,456 (15,215) $16.92
TOTAL 9,643,781 1,490,398 15.5% 137,710 1.4% 1,628,108 16.9% 48,889 (65,231) $25.07
GULF FREEWAY/PASADENA
A 75,066 23,414 31.2% 6,273 8.4% 29,687 39.5% 547 547 $28.03
B 1,709,790 194,162 11.4% 13,481 0.8% 207.643 12.1% (19,388) 2,751 $19.74
C 1,126,564 106,867 9.5% 3,590 0.3% 110,457 9.8% 18,672 7,372 $14.23
TOTAL 2,911,420 324,443 11.1% 23,344 0.8% 347,787 11.9% (169) 10,670 $18.77
I-10 EAST
B 274,672 79,131 28.8% 9,260 3.4% 88,391 32.2% 2,349 9,343 $13.84
C 157,955 0 0.0% 6,536 4.1% 6,536 4.1% (6,526) (6,526) $11.91
TOTAL 432,627 79,131 18.3% 15,796 3.7% 94,927 21.9% (4,187) 2,817 $13.63
KATY FREEWAY
A 11,071,761 2,445,653 22.1% 23,979 0.2% 2,469,632 22.3% 112,513 271,539 $28.17
B 6,904,995 811,017 11.7% 75,872 1.1% 886,889 11.7% (16,625) 301,226 $18.31
C 1,813,421 189,948 10.5% 1,522 0.1% 191,470 10.6% 5,596 18,476 $15.06
TOTAL 19,790,177 3,446,618 17.4% 101,373 0.5% 3,547,991 17.9% 101,484 591,241 $23.56
KINGWOOD/HUMBLE
A 158,640 25,904 16.3% 0 0.0% 25,904 16.3% 4,800 4,800 $29.50
B 1,795,933 184,857 10.3% 3,741 0.2% 188,598 10.3% (15,801) 35,365 $20.42
C 663,736 27,108 4.1% 0 0.0% 27,108 4.1% (445) 650 $14.91
TOTAL 2,618,309 237,869 9.1% 3,741 0.1% 241,610 9.2% (11,446) 40,815 $19.88
NASA/CLEAR LAKE
A 809,372 81,818 10.1% 6,214 0.8% 88,032 10.9% 6,025 3,714 $21.92
B 3,174,855 205,620 6.5% 19,807 0.6% 225,427 7.0% 4,804 33,902 $21.39
C 1,228,410 169,703 13.8% 13,047 1.1% 182,750 14.9% (3,314) (6,681) $15.73
TOTAL 5,212,637 457,141 8.8% 39,068 0.7% 496,209 9.5% 7,515 30,935 $20.51
NORTH BELT/GREENSPOINT
A 4,618,495 239,116 5.2% 62,232 1.3% 301,348 6.5% 13,960 43,168 $19.38
B 5,288,025 1,303,011 24.6% 152,713 2.9% 1,455,724 27.5% (101,948 (144,038) $15.69
C 1,346,611 212,993 15.8% 9,457 0.7% 222,450 16.5% (8,709) (29,184) $13.32
TOTAL 11,253,131 1,755,120 15.6% 224,402 2.0% 1,979,522 17.6% (96,697) (130,054) $16.04
NORTHEAST/OUTLIER
B 265,773 39,918 15.0% 0 0.0% 39,918 15.0% (348) 7,616 $15.33
C 149,813 12,506 8.3% 0 0.0% 12,506 8.3% 4,403 (3,266) $12.00
TOTAL 415,586 52,424 12.6% 0 0.0% 52,424 12.6% 4,055 4,350 $14.31
COLLIERS INTERNATIONAL | P. 5
6. RESEARCH & FORECAST REPORT | Q3 2010 | HOUSTON OFFICE MARKET
HOUSTON SUBURBAN OFFICE MARKET SUMMARY
INVENTORY DIRECT VACANCY SUBLEASE VACANCY VACANCY VACANCY RATE (%) NET ABSORPTION (SF) RENTAL RATE
CLASS TOTAL (SF) (SF) RATE (%) (SF) RATE (%) TOTAL (SF) Q3-2010 Q3-2010 YTD AVG ($/SF)
NORTHWEST
A 3,724,724 1,322,400 35.5% 1,404 0.0% 1,323,804 35.5% 30,976 83,828 $25.33
B 6,710,072 1,473,546 22.0% 26,567 0.4% 1,500,113 22.4% 38,607 (64,757) $15.37
C 1,546,532 83,458 5.4% 0 0.0% 83.458 5.4% 10,405 39,402 $12.22
TOTAL 11,981,328 2,879,404 24.0% 27,971 0.2% 2,907,375 24.3% 79,988 58,473 $19.73
NORTHWEST OUTLIER
A 89,750 0 0.0% 0 0.0% 0 0.0% 0 0 -
B 135,457 1,594 1.2% 0 0.0% 1,594 1.2% 0 5,978 $17.70
TOTAL 225,207 1,594 0.7% 0 0.0% 1,594 0.7% 0 5,978 $17.70
RICHMOND/FOUNTAINVIEW
B 761,420 72,286 9.5% 0 0.0% 72,286 9.5% 4,327 6,295 $15.83
C 693,325 36,949 5.3% 0 0.0% 36,949 5.3% (1,478) 14,292 $14.73
TOTAL 1,454,745 109,235 7.5% 0 0.0% 109,235 7.5% 2,849 20,587 $15.56
SAN FELIPE/VOSS
A 1,741,228 272,931 15.7% 2,688 0.2% 275,619 15.8% 3,658 (26,530) $29.48
B 3,271,828 302,666 9.3% 24,839 0.7% 326,505 10.0% (23,195) 8,297 $19.78
C 161,393 21,403 13.3% 0 0.0% 21,403 13.3% 265 497 $17.40
TOTAL 5,174,449 597,000 11.5% 26,527 0.5% 623,527 11.5% (19,272) (17,736) $23.05
SOUTH
A 80,000 74,500 93.1% 0 0.0% 74,500 93.1% 0 5,500 $26.63
B 379,764 23,164 6.10% 0 0.00% 23,164 6.10% 3,740 6,650 $22.99
C 223,029 38,920 17.50% 0 0.00% 38,920 17.50% 3,300 3,300 $16.70
Total 682,793 145,584 21.30% 0 0.00% 145,584 21.30% -1,960 6,450 $23.39
SOUTH MAIN/MED CENTER
A 3,916,577 363,337 9.3% 0 0.0% 363,337 9.3% (1,196) (12,309) $30.92
B 3,791,116 328,347 8.7% 4,800 0.1% 333,147 8.8% 4,090 (101,287) $20.17
C 2,745,096 112,916 4.1% 0 0.0% 112,916 4.1% (26,745) 15,364 $17.28
TOTAL 10,452,789 804,600 7.7% 4,800 0.1% 809,400 7.7% (23,851) (98,232) $24.15
SOUTHEAST/OUTLIER
A 159,304 0 0.0% 0 0.0% 0 0.0% 0 0 -
B 456,504 73,177 16.0% 0 0.0% 73,177 16.0% (2,423) (1,698) $22.28
C 22,783 12,533 55.0% 0 0.0% 12,533 55.0% (12,533) (12,533) $24.00
TOTAL 638,591 85,710 13.4% 0 0.0% 85,710 13.4% (14,956) (14,231) $22.51
SOUTHWEST
A 1,505,805 432,270 28.7% 52,056 3.5% 484,326 32.2% 11,656 (19,623) $15.94
B 6,043,028 1,234,928 20.4% 158,895 2.6% 1,393,823 23.1% (41,313) (30,417) $15.63
C 2,475,389 259,768 10.5% 0 0.0% 259,768 10.5% 11,994 12,701 $11.96
TOTAL 10,024,222 1,926,966 19.2% 210,951 2.1% 2,137,917 21.3% (17,663) (37,339) $15.20
SOUTHWEST FAR/OUTLIER
A 87,710 2,371 2.7% 0 0.0% 2,371 2.7% 7,745 7,745 $28.00
B 616,117 77,253 12.5% 0 0.0% 77,253 12.5% 14,318 14,463 $26.84
C 128,735 0 0.0% 0 0.0% 0 0.0% 0 (3,000) -
TOTAL 832,562 79,624 9.6% 0 0.0% 79,624 9.6% 22,063 19,208 $27.00
COLLIERS INTERNATIONAL | P. 6
7. RESEARCH & FORECAST REPORT | Q3 2010 | HOUSTON OFFICE MARKET
HOUSTON SUBURBAN OFFICE MARKET SUMMARY
INVENTORY DIRECT VACANCY SUBLEASE VACANCY VACANCY VACANCY RATE (%) NET ABSORPTION (SF) RENTAL RATE
CLASS TOTAL (SF) (SF) RATE (%) (SF) RATE (%) TOTAL (SF) Q3-2010 Q3-2010 YTD AVG ($/SF)
WEST LOOP/GALLERIA
A 16,303,906 1,536,703 9.4% 187,307 1.1% 1,724,010 10.6% (41,296) 46,804 $29.95
B 5,545,754 1,217,757 22.0% 14,820 0.3% 1,232,577 22.2% (17,291) 75,609 $19.92
C 426,332 2,444 0.6% 0 0.0% 2,444 0.6% 7,430 20,950 $16.50
TOTAL 22,277,992 2,756,904 12.4% 202,127 0.9% 2,959,031 13.3% (51,157) 143,363 $26.45
WESTCHASE
A 7,636,999 1,329,788 17.4% 36,357 0.5% 1,366,145 17.9% 27,340 108,583 $30.03
B 5,374,721 937,457 17.4% 59,658 1.1% 997,115 18.6% 84,214 (9,884) $18.88
C 441,936 53,425 12.1% 0 0.0% 53,425 12.1% 5,476 475 $15.16
TOTAL 13,453,656 2,320,670 17.2% 96,015 0.7% 2,416,685 18.0% 117,030 99,174 $25.11
THE WOODLANDS
A 1,907,801 477,495 25.0% 44,531 2.3% 522,026 27.4% 11,454 27439 $28.42
B 3,275,109 426,000 13.0% 84,940 2.6% 510,940 15.6% 27,155 (8,518) $20.32
C 172,322 42,712 24.8% 0 0.0% 42,712 24.8% (17,635) (17,635) -
TOTAL 5,355,232 946,207 17.7% 129,471 2.4% 1,075,678 20.1% 20,974 18,322 $23.55
OFFICE DEVELOPMENT PIPELINE
Houston’s development activity remained dormant in Q3 2010, with no new additions to the office
buildings already under construction. The 2M square feet under construction are as follows:
Indermuehle & Company’s 19,130-square-foot Sugar Creek Office Park (E. Fort Bend County
4
3
submarket) and Caldwell Companies’ 15,367-square-foot Webster Office Building (NASA/Clear
Lake submarket).
Two CBD office projects—Hines’ 972,474-square-foot Main Place (slated for delivery by February
2011) and Trammell Crow Company’s Hess Tower (formerly Discovery Tower, scheduled for
completion by October 2010)—continue to be the sole high-profile buildings under construction at
the end of the third quarter. Notably, both downtown projects began construction before the
economic downturn of late 2008. Developers have ventured to introduce new product in high-
1
2 growth suburban markets, including a project in the East Fort Bend County submarket: Newland
Communities’ 40,000-square-foot The Exchange at Telfair (expected by year-end 2010), which
will be part of the planned mixed-use development for one of the area’s newest and most
5 successful master-planned communities of the same name. Other suburban projects include
Greenwood Corporation’s 156,000-square-foot Chasewood Crossing II in the FM 1960-Highway
249 submarket (scheduled for completion in April 2011), as well as Black Forest Ventures’
70,000-square-foot Black Forest Park, located in The Woodlands submarket and slated for
delivery by November 2010. The German investment firm Black Forest Ventures (based in The
Woodlands) recently made news with the acquisition of the Stanford Financial Center in the
Galleria submarket, and is considered by industry leaders likely to continue expanding in Houston.
SELECT OFFICE BUILDINGS UNDER CONSTRUCTION
BUILDING NAME ADDRESS SUBMARKET SF LEASED DEVELOPER EST. DELIVERY
MainPlace 1 811 Main St. CBD 972,474 10.1% Hines Holdings Inc. 02/2011
Hess Tower 2 1501 McKinney St. CBD 844,763 100.0% TCC Development 10/2010
Chasewood Crossing II 3 19450 State Hwy 249 FM 1960/Hwy 249 156,000 0.0% Greenwood Corporation 04/2011
Black Forest Park 4 4526 Research Forest Dr. The Woodlands 64,000 0.0% Black Forest Ventures 12/2010
The Exchange at Telfair 5 University Blvd. & Hwy 59 E. Fort Bend 40,000 0.0% Newland Communities 12/2010
Total SF Under Construction 2,077,237
COLLIERS INTERNATIONAL | P. 7
8. RESEARCH & FORECAST REPORT | Q3 2010 | HOUSTON OFFICE MARKET
480 offices in
61 countries on
6 continents
United States: 95
Canada: 17
Latin America: 17
Asia Pacific: 52
EMEA: 85
COLLIERS INTERNATIONAL | HOUSTON
1300 Post Oak Boulevard
Suite 200
Houston, Texas 77056
MAIN +1 713 222 2111
Accelerating success.
COLLIERS INTERNATIONAL | P. 8