SlideShare ist ein Scribd-Unternehmen logo
1 von 30
Downloaden Sie, um offline zu lesen
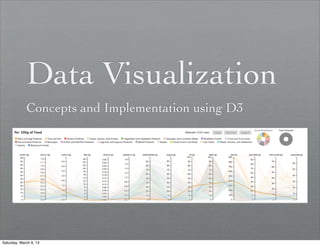
Data Visualization	

             Concepts and Implementation using D3


Saturday, March 9, 13
Agenda

             ✦      Hello Visualization
             ✦      Introducing D3
             ✦      Show Me The Code
             ✦      Online Resources


Saturday, March 9, 13
Hello Visualization


Saturday, March 9, 13
Hello Visualization


Saturday, March 9, 13
Hello Visualization


Saturday, March 9, 13
Why Visualize


             ✦      Visualization helps us understand


Saturday, March 9, 13
Visualization Challenges

             ✦      Versatile visualizations
             ✦      Versatile data
             ✦      Scalable
             ✦      Interactive


Saturday, March 9, 13
D3 Is Different


Saturday, March 9, 13
D3 Is Different


             ✦      YOU choose how to visualize
             ✦      D3 just builds the DOM


Saturday, March 9, 13
What You Need


             ✦      Data items
             ✦      Know how to visualize an item


Saturday, March 9, 13
What You Need
             ✦      Data Item: #69ce85

             ✦      Visualization:

               <div style="
                 background-color: rgb(108,
               199, 224);
                 height: 20px;
                 width: 25px;"
               class="color"></div>


Saturday, March 9, 13
Demo1: Visualizing
             Numbers


              http://jsbin.com/ogenow/2/edit


Saturday, March 9, 13
D3 Concepts

             ✦      Use selectAll(...).data(...) to
                    bind data and DOM
             ✦      Append new elements on enter()
             ✦      Remove them on exit()
             ✦      Separate visualization from data


Saturday, March 9, 13
Demo2: Visualizing
             Numbers
              Using the DOM instead of SVG is just as easy


             http://jsbin.com/ogenow/3/edit

Saturday, March 9, 13
Using Scales

             ✦      So far our scale was “coded-in” the
                    visualization
             ✦      D3 helps us decouple the scale


Saturday, March 9, 13
Using Scales
             ✦      The scale function creates a
                    scale                          var xScale = d3.scale.linear()
                                                     .domain([0,data.length])
                                                     .range([50,500]);
             ✦      Domain is the input
                                                   .attr('cx', function(d, i) {
             ✦      Range is the output               return xScale( i );
                                                   })
             ✦      Basically, it translates
                    FROM domain TO range

             ✦      https://github.com/
                    mbostock/d3/wiki/Scales

Saturday, March 9, 13
Scales Demo


               http://jsbin.com/iyavef/1/edit


Saturday, March 9, 13
Show Me The Code

             ✦      More D3 Demos:
                        ✦   Bar Graph http://jsbin.com/abagiv/1/edit
                        ✦   Color Picker http://jsbin.com/igited/1/edit


Saturday, March 9, 13
More D3 Features


             ✦      Built-in visualizations for common SVG
                    shapes


Saturday, March 9, 13
D3 Charts
     Original Data         Layout      SVG Shapes


                                       A function
        Array of         Maps values
                                       that paints
      objects from        to “shape”
                                       using SVG
      YOUR world            values
                                          path


Saturday, March 9, 13
D3 Charts Example

                              var   pie_values = [
                                {   y: 10, label: 'foo'},
             Your Data          {   y: 20, label: 'bar'},
                                {   y: 40, label: 'buz'},
                                {   y: 30, label: 'hss'}
                              ];


Saturday, March 9, 13
D3 Charts Example
          Layout
       [
         {"data":{"y":10,"label":"foo"},"value":10,"startAngle":
       5.654866776461628,"endAngle":6.283185307179586},

         {"data":{"y":20,"label":"bar"},"value":20,"startAngle":
       4.39822971502571,"endAngle":5.654866776461628},

         {"data":{"y":40,"label":"buz"},"value":40,"startAngle":
       0,"endAngle":2.5132741228718345},

         {"data":{"y":30,"label":"hss"},"value":30,"startAngle":
       2.5132741228718345,"endAngle":4.39822971502571}
       ]


Saturday, March 9, 13
D3 Charts Example

             ✦      Create a shape with:
                    var arc = d3.svg.arc().outerRadius(150).innerRadius(0);

             ✦      Now we get:
                    arc(p_data[0]) ==
                    "M-88.16778784387098,-121.3525491562421A150,150 0 0,1
                    -2.7553642961003488e-14,-150L0,0Z"


Saturday, March 9, 13
Pie Chart Full Demo


             ✦      http://jsbin.com/usujoq/1/edit


Saturday, March 9, 13
More Layouts

             ✦      Partition Layout

             ✦      Adjacency diagrams

             ✦      Use with d3.svg.arc


Saturday, March 9, 13
More Layouts

             ✦      Cluster Layout

             ✦      Produces dendograms

             ✦      Use with d3.svg.diagonal


Saturday, March 9, 13
More Layouts

             ✦      Pack Layout

             ✦      Enclosure diagrams

             ✦      Plain circles


Saturday, March 9, 13
More Layouts

             ✦      Histogram Layout

             ✦      Splits data to bins

             ✦      Use with plain rects


Saturday, March 9, 13
D3 Online

             ✦      Rich examples gallery:
                    http://static.cybercommons.org/js/d3/
                    examples/
             ✦      D3 wiki:
                    https://github.com/mbostock/d3/wiki


Saturday, March 9, 13
Thanks For Listening

             ✦      Ynon Perek
             ✦      ynon@ynonperek.com
             ✦      http://ynonperek.com


Saturday, March 9, 13

Weitere ähnliche Inhalte

Was ist angesagt?

Tableau Visual analytics complete deck 2
Tableau Visual analytics complete deck 2Tableau Visual analytics complete deck 2
Tableau Visual analytics complete deck 2Arun K
 
Common MongoDB Use Cases
Common MongoDB Use Cases Common MongoDB Use Cases
Common MongoDB Use Cases MongoDB
 
Visual Api Training
Visual Api TrainingVisual Api Training
Visual Api TrainingSpark Summit
 
Introducing DataFrames in Spark for Large Scale Data Science
Introducing DataFrames in Spark for Large Scale Data ScienceIntroducing DataFrames in Spark for Large Scale Data Science
Introducing DataFrames in Spark for Large Scale Data ScienceDatabricks
 
An introduction to Vue.js
An introduction to Vue.jsAn introduction to Vue.js
An introduction to Vue.jsPagepro
 
Intro to Graphs and Neo4j
Intro to Graphs and Neo4jIntro to Graphs and Neo4j
Intro to Graphs and Neo4jjexp
 
Tableau Tutorial for Data Science | Edureka
Tableau Tutorial for Data Science | EdurekaTableau Tutorial for Data Science | Edureka
Tableau Tutorial for Data Science | EdurekaEdureka!
 
Basics of MongoDB
Basics of MongoDB Basics of MongoDB
Basics of MongoDB Habilelabs
 
Intro to Cypher
Intro to CypherIntro to Cypher
Intro to CypherNeo4j
 
Data Federation with Apache Spark
Data Federation with Apache SparkData Federation with Apache Spark
Data Federation with Apache SparkDataWorks Summit
 
Introduction To PostGIS
Introduction To PostGISIntroduction To PostGIS
Introduction To PostGISmleslie
 
Introduction to DAX
Introduction to DAXIntroduction to DAX
Introduction to DAXIke Ellis
 
Intro to Neo4j
Intro to Neo4jIntro to Neo4j
Intro to Neo4jNeo4j
 

Was ist angesagt? (20)

Tableau Visual analytics complete deck 2
Tableau Visual analytics complete deck 2Tableau Visual analytics complete deck 2
Tableau Visual analytics complete deck 2
 
Common MongoDB Use Cases
Common MongoDB Use Cases Common MongoDB Use Cases
Common MongoDB Use Cases
 
Svelte JS introduction
Svelte JS introductionSvelte JS introduction
Svelte JS introduction
 
Graph database
Graph databaseGraph database
Graph database
 
Visual Api Training
Visual Api TrainingVisual Api Training
Visual Api Training
 
Graph db
Graph dbGraph db
Graph db
 
Introducing DataFrames in Spark for Large Scale Data Science
Introducing DataFrames in Spark for Large Scale Data ScienceIntroducing DataFrames in Spark for Large Scale Data Science
Introducing DataFrames in Spark for Large Scale Data Science
 
An introduction to Vue.js
An introduction to Vue.jsAn introduction to Vue.js
An introduction to Vue.js
 
Intro to Graphs and Neo4j
Intro to Graphs and Neo4jIntro to Graphs and Neo4j
Intro to Graphs and Neo4j
 
Tableau Tutorial for Data Science | Edureka
Tableau Tutorial for Data Science | EdurekaTableau Tutorial for Data Science | Edureka
Tableau Tutorial for Data Science | Edureka
 
Basics of VueJS
Basics of VueJSBasics of VueJS
Basics of VueJS
 
Basics of MongoDB
Basics of MongoDB Basics of MongoDB
Basics of MongoDB
 
Intro to Cypher
Intro to CypherIntro to Cypher
Intro to Cypher
 
ssis lab
ssis labssis lab
ssis lab
 
Data Federation with Apache Spark
Data Federation with Apache SparkData Federation with Apache Spark
Data Federation with Apache Spark
 
Google Cloud Platform Data Storage
Google Cloud Platform Data StorageGoogle Cloud Platform Data Storage
Google Cloud Platform Data Storage
 
Introduction To PostGIS
Introduction To PostGISIntroduction To PostGIS
Introduction To PostGIS
 
Introduction to DAX
Introduction to DAXIntroduction to DAX
Introduction to DAX
 
Intro to Neo4j
Intro to Neo4jIntro to Neo4j
Intro to Neo4j
 
Get to know PostgreSQL!
Get to know PostgreSQL!Get to know PostgreSQL!
Get to know PostgreSQL!
 

Ähnlich wie D3 js

D3.js capita selecta
D3.js capita selectaD3.js capita selecta
D3.js capita selectaJoris Klerkx
 
Projeto de criacao e prod digital 2013
Projeto de criacao e prod digital 2013Projeto de criacao e prod digital 2013
Projeto de criacao e prod digital 2013famecos2013
 
Getting rid of images with CSS
Getting rid of images with CSSGetting rid of images with CSS
Getting rid of images with CSSChris Mills
 
Progressive Advancement, by way of progressive enhancement
Progressive Advancement, by way of progressive enhancementProgressive Advancement, by way of progressive enhancement
Progressive Advancement, by way of progressive enhancementPaul Irish
 
Responsive Web Design
Responsive Web DesignResponsive Web Design
Responsive Web DesignNicolae Rusan
 
Shiny r, live shared and explored
Shiny   r, live shared and exploredShiny   r, live shared and explored
Shiny r, live shared and exploredAlex Brown
 
Essential Test-Driven Development
Essential Test-Driven DevelopmentEssential Test-Driven Development
Essential Test-Driven DevelopmentTechWell
 
Having fun with graphs, a short introduction to D3.js
Having fun with graphs, a short introduction to D3.jsHaving fun with graphs, a short introduction to D3.js
Having fun with graphs, a short introduction to D3.jsMichael Hackstein
 
Developers + Designers: A Mutalistic Relationship - From BlendConf 2013
Developers + Designers: A Mutalistic Relationship - From BlendConf 2013Developers + Designers: A Mutalistic Relationship - From BlendConf 2013
Developers + Designers: A Mutalistic Relationship - From BlendConf 2013Rachel Parsons
 
3D Web Services And Models For The Web: Where Do We Stand?
3D Web Services And Models For The Web: Where Do We Stand?3D Web Services And Models For The Web: Where Do We Stand?
3D Web Services And Models For The Web: Where Do We Stand?Camptocamp
 

Ähnlich wie D3 js (20)

D3.js capita selecta
D3.js capita selectaD3.js capita selecta
D3.js capita selecta
 
Learning d3
Learning d3Learning d3
Learning d3
 
D3js
D3jsD3js
D3js
 
Projeto de criacao e prod digital 2013
Projeto de criacao e prod digital 2013Projeto de criacao e prod digital 2013
Projeto de criacao e prod digital 2013
 
WebGL and three.js
WebGL and three.jsWebGL and three.js
WebGL and three.js
 
Getting rid of images with CSS
Getting rid of images with CSSGetting rid of images with CSS
Getting rid of images with CSS
 
d3 is cool
d3 is coold3 is cool
d3 is cool
 
Progressive Advancement, by way of progressive enhancement
Progressive Advancement, by way of progressive enhancementProgressive Advancement, by way of progressive enhancement
Progressive Advancement, by way of progressive enhancement
 
Responsive Web Design
Responsive Web DesignResponsive Web Design
Responsive Web Design
 
Shiny r, live shared and explored
Shiny   r, live shared and exploredShiny   r, live shared and explored
Shiny r, live shared and explored
 
Essential Test-Driven Development
Essential Test-Driven DevelopmentEssential Test-Driven Development
Essential Test-Driven Development
 
D3
D3D3
D3
 
Backbone
BackboneBackbone
Backbone
 
Couchbase
CouchbaseCouchbase
Couchbase
 
Having fun with graphs, a short introduction to D3.js
Having fun with graphs, a short introduction to D3.jsHaving fun with graphs, a short introduction to D3.js
Having fun with graphs, a short introduction to D3.js
 
Intro tobackbone
Intro tobackboneIntro tobackbone
Intro tobackbone
 
Developers + Designers: A Mutalistic Relationship - From BlendConf 2013
Developers + Designers: A Mutalistic Relationship - From BlendConf 2013Developers + Designers: A Mutalistic Relationship - From BlendConf 2013
Developers + Designers: A Mutalistic Relationship - From BlendConf 2013
 
3D Web Services And Models For The Web: Where Do We Stand?
3D Web Services And Models For The Web: Where Do We Stand?3D Web Services And Models For The Web: Where Do We Stand?
3D Web Services And Models For The Web: Where Do We Stand?
 
Utahjs D3
Utahjs D3Utahjs D3
Utahjs D3
 
Effective Scala @ Jfokus
Effective Scala @ JfokusEffective Scala @ Jfokus
Effective Scala @ Jfokus
 

Mehr von Ynon Perek

09 performance
09 performance09 performance
09 performanceYnon Perek
 
Mobile Web Intro
Mobile Web IntroMobile Web Intro
Mobile Web IntroYnon Perek
 
Qt multi threads
Qt multi threadsQt multi threads
Qt multi threadsYnon Perek
 
Mobile Devices
Mobile DevicesMobile Devices
Mobile DevicesYnon Perek
 
Architecture app
Architecture appArchitecture app
Architecture appYnon Perek
 
Unit Testing JavaScript Applications
Unit Testing JavaScript ApplicationsUnit Testing JavaScript Applications
Unit Testing JavaScript ApplicationsYnon Perek
 
How to write easy-to-test JavaScript
How to write easy-to-test JavaScriptHow to write easy-to-test JavaScript
How to write easy-to-test JavaScriptYnon Perek
 
Introduction to Selenium and Ruby
Introduction to Selenium and RubyIntroduction to Selenium and Ruby
Introduction to Selenium and RubyYnon Perek
 
Introduction To Web Application Testing
Introduction To Web Application TestingIntroduction To Web Application Testing
Introduction To Web Application TestingYnon Perek
 
Qt Design Patterns
Qt Design PatternsQt Design Patterns
Qt Design PatternsYnon Perek
 
Web Application Security
Web Application SecurityWeb Application Security
Web Application SecurityYnon Perek
 

Mehr von Ynon Perek (20)

Regexp
RegexpRegexp
Regexp
 
Html5 intro
Html5 introHtml5 intro
Html5 intro
 
09 performance
09 performance09 performance
09 performance
 
Mobile Web Intro
Mobile Web IntroMobile Web Intro
Mobile Web Intro
 
Qt multi threads
Qt multi threadsQt multi threads
Qt multi threads
 
Vimperl
VimperlVimperl
Vimperl
 
Syllabus
SyllabusSyllabus
Syllabus
 
Mobile Devices
Mobile DevicesMobile Devices
Mobile Devices
 
Network
NetworkNetwork
Network
 
Architecture app
Architecture appArchitecture app
Architecture app
 
Cryptography
CryptographyCryptography
Cryptography
 
Unit Testing JavaScript Applications
Unit Testing JavaScript ApplicationsUnit Testing JavaScript Applications
Unit Testing JavaScript Applications
 
How to write easy-to-test JavaScript
How to write easy-to-test JavaScriptHow to write easy-to-test JavaScript
How to write easy-to-test JavaScript
 
Introduction to Selenium and Ruby
Introduction to Selenium and RubyIntroduction to Selenium and Ruby
Introduction to Selenium and Ruby
 
Introduction To Web Application Testing
Introduction To Web Application TestingIntroduction To Web Application Testing
Introduction To Web Application Testing
 
Accessibility
AccessibilityAccessibility
Accessibility
 
Angularjs
AngularjsAngularjs
Angularjs
 
Js memory
Js memoryJs memory
Js memory
 
Qt Design Patterns
Qt Design PatternsQt Design Patterns
Qt Design Patterns
 
Web Application Security
Web Application SecurityWeb Application Security
Web Application Security
 

Kürzlich hochgeladen

CloudStudio User manual (basic edition):
CloudStudio User manual (basic edition):CloudStudio User manual (basic edition):
CloudStudio User manual (basic edition):comworks
 
Are Multi-Cloud and Serverless Good or Bad?
Are Multi-Cloud and Serverless Good or Bad?Are Multi-Cloud and Serverless Good or Bad?
Are Multi-Cloud and Serverless Good or Bad?Mattias Andersson
 
Designing IA for AI - Information Architecture Conference 2024
Designing IA for AI - Information Architecture Conference 2024Designing IA for AI - Information Architecture Conference 2024
Designing IA for AI - Information Architecture Conference 2024Enterprise Knowledge
 
How AI, OpenAI, and ChatGPT impact business and software.
How AI, OpenAI, and ChatGPT impact business and software.How AI, OpenAI, and ChatGPT impact business and software.
How AI, OpenAI, and ChatGPT impact business and software.Curtis Poe
 
Developer Data Modeling Mistakes: From Postgres to NoSQL
Developer Data Modeling Mistakes: From Postgres to NoSQLDeveloper Data Modeling Mistakes: From Postgres to NoSQL
Developer Data Modeling Mistakes: From Postgres to NoSQLScyllaDB
 
Story boards and shot lists for my a level piece
Story boards and shot lists for my a level pieceStory boards and shot lists for my a level piece
Story boards and shot lists for my a level piececharlottematthew16
 
SAP Build Work Zone - Overview L2-L3.pptx
SAP Build Work Zone - Overview L2-L3.pptxSAP Build Work Zone - Overview L2-L3.pptx
SAP Build Work Zone - Overview L2-L3.pptxNavinnSomaal
 
Artificial intelligence in cctv survelliance.pptx
Artificial intelligence in cctv survelliance.pptxArtificial intelligence in cctv survelliance.pptx
Artificial intelligence in cctv survelliance.pptxhariprasad279825
 
Scanning the Internet for External Cloud Exposures via SSL Certs
Scanning the Internet for External Cloud Exposures via SSL CertsScanning the Internet for External Cloud Exposures via SSL Certs
Scanning the Internet for External Cloud Exposures via SSL CertsRizwan Syed
 
Search Engine Optimization SEO PDF for 2024.pdf
Search Engine Optimization SEO PDF for 2024.pdfSearch Engine Optimization SEO PDF for 2024.pdf
Search Engine Optimization SEO PDF for 2024.pdfRankYa
 
SIP trunking in Janus @ Kamailio World 2024
SIP trunking in Janus @ Kamailio World 2024SIP trunking in Janus @ Kamailio World 2024
SIP trunking in Janus @ Kamailio World 2024Lorenzo Miniero
 
Commit 2024 - Secret Management made easy
Commit 2024 - Secret Management made easyCommit 2024 - Secret Management made easy
Commit 2024 - Secret Management made easyAlfredo García Lavilla
 
"LLMs for Python Engineers: Advanced Data Analysis and Semantic Kernel",Oleks...
"LLMs for Python Engineers: Advanced Data Analysis and Semantic Kernel",Oleks..."LLMs for Python Engineers: Advanced Data Analysis and Semantic Kernel",Oleks...
"LLMs for Python Engineers: Advanced Data Analysis and Semantic Kernel",Oleks...Fwdays
 
"Debugging python applications inside k8s environment", Andrii Soldatenko
"Debugging python applications inside k8s environment", Andrii Soldatenko"Debugging python applications inside k8s environment", Andrii Soldatenko
"Debugging python applications inside k8s environment", Andrii SoldatenkoFwdays
 
TrustArc Webinar - How to Build Consumer Trust Through Data Privacy
TrustArc Webinar - How to Build Consumer Trust Through Data PrivacyTrustArc Webinar - How to Build Consumer Trust Through Data Privacy
TrustArc Webinar - How to Build Consumer Trust Through Data PrivacyTrustArc
 
How to write a Business Continuity Plan
How to write a Business Continuity PlanHow to write a Business Continuity Plan
How to write a Business Continuity PlanDatabarracks
 
H2O.ai CEO/Founder: Sri Ambati Keynote at Wells Fargo Day
H2O.ai CEO/Founder: Sri Ambati Keynote at Wells Fargo DayH2O.ai CEO/Founder: Sri Ambati Keynote at Wells Fargo Day
H2O.ai CEO/Founder: Sri Ambati Keynote at Wells Fargo DaySri Ambati
 
Take control of your SAP testing with UiPath Test Suite
Take control of your SAP testing with UiPath Test SuiteTake control of your SAP testing with UiPath Test Suite
Take control of your SAP testing with UiPath Test SuiteDianaGray10
 
New from BookNet Canada for 2024: BNC CataList - Tech Forum 2024
New from BookNet Canada for 2024: BNC CataList - Tech Forum 2024New from BookNet Canada for 2024: BNC CataList - Tech Forum 2024
New from BookNet Canada for 2024: BNC CataList - Tech Forum 2024BookNet Canada
 
Nell’iperspazio con Rocket: il Framework Web di Rust!
Nell’iperspazio con Rocket: il Framework Web di Rust!Nell’iperspazio con Rocket: il Framework Web di Rust!
Nell’iperspazio con Rocket: il Framework Web di Rust!Commit University
 

Kürzlich hochgeladen (20)

CloudStudio User manual (basic edition):
CloudStudio User manual (basic edition):CloudStudio User manual (basic edition):
CloudStudio User manual (basic edition):
 
Are Multi-Cloud and Serverless Good or Bad?
Are Multi-Cloud and Serverless Good or Bad?Are Multi-Cloud and Serverless Good or Bad?
Are Multi-Cloud and Serverless Good or Bad?
 
Designing IA for AI - Information Architecture Conference 2024
Designing IA for AI - Information Architecture Conference 2024Designing IA for AI - Information Architecture Conference 2024
Designing IA for AI - Information Architecture Conference 2024
 
How AI, OpenAI, and ChatGPT impact business and software.
How AI, OpenAI, and ChatGPT impact business and software.How AI, OpenAI, and ChatGPT impact business and software.
How AI, OpenAI, and ChatGPT impact business and software.
 
Developer Data Modeling Mistakes: From Postgres to NoSQL
Developer Data Modeling Mistakes: From Postgres to NoSQLDeveloper Data Modeling Mistakes: From Postgres to NoSQL
Developer Data Modeling Mistakes: From Postgres to NoSQL
 
Story boards and shot lists for my a level piece
Story boards and shot lists for my a level pieceStory boards and shot lists for my a level piece
Story boards and shot lists for my a level piece
 
SAP Build Work Zone - Overview L2-L3.pptx
SAP Build Work Zone - Overview L2-L3.pptxSAP Build Work Zone - Overview L2-L3.pptx
SAP Build Work Zone - Overview L2-L3.pptx
 
Artificial intelligence in cctv survelliance.pptx
Artificial intelligence in cctv survelliance.pptxArtificial intelligence in cctv survelliance.pptx
Artificial intelligence in cctv survelliance.pptx
 
Scanning the Internet for External Cloud Exposures via SSL Certs
Scanning the Internet for External Cloud Exposures via SSL CertsScanning the Internet for External Cloud Exposures via SSL Certs
Scanning the Internet for External Cloud Exposures via SSL Certs
 
Search Engine Optimization SEO PDF for 2024.pdf
Search Engine Optimization SEO PDF for 2024.pdfSearch Engine Optimization SEO PDF for 2024.pdf
Search Engine Optimization SEO PDF for 2024.pdf
 
SIP trunking in Janus @ Kamailio World 2024
SIP trunking in Janus @ Kamailio World 2024SIP trunking in Janus @ Kamailio World 2024
SIP trunking in Janus @ Kamailio World 2024
 
Commit 2024 - Secret Management made easy
Commit 2024 - Secret Management made easyCommit 2024 - Secret Management made easy
Commit 2024 - Secret Management made easy
 
"LLMs for Python Engineers: Advanced Data Analysis and Semantic Kernel",Oleks...
"LLMs for Python Engineers: Advanced Data Analysis and Semantic Kernel",Oleks..."LLMs for Python Engineers: Advanced Data Analysis and Semantic Kernel",Oleks...
"LLMs for Python Engineers: Advanced Data Analysis and Semantic Kernel",Oleks...
 
"Debugging python applications inside k8s environment", Andrii Soldatenko
"Debugging python applications inside k8s environment", Andrii Soldatenko"Debugging python applications inside k8s environment", Andrii Soldatenko
"Debugging python applications inside k8s environment", Andrii Soldatenko
 
TrustArc Webinar - How to Build Consumer Trust Through Data Privacy
TrustArc Webinar - How to Build Consumer Trust Through Data PrivacyTrustArc Webinar - How to Build Consumer Trust Through Data Privacy
TrustArc Webinar - How to Build Consumer Trust Through Data Privacy
 
How to write a Business Continuity Plan
How to write a Business Continuity PlanHow to write a Business Continuity Plan
How to write a Business Continuity Plan
 
H2O.ai CEO/Founder: Sri Ambati Keynote at Wells Fargo Day
H2O.ai CEO/Founder: Sri Ambati Keynote at Wells Fargo DayH2O.ai CEO/Founder: Sri Ambati Keynote at Wells Fargo Day
H2O.ai CEO/Founder: Sri Ambati Keynote at Wells Fargo Day
 
Take control of your SAP testing with UiPath Test Suite
Take control of your SAP testing with UiPath Test SuiteTake control of your SAP testing with UiPath Test Suite
Take control of your SAP testing with UiPath Test Suite
 
New from BookNet Canada for 2024: BNC CataList - Tech Forum 2024
New from BookNet Canada for 2024: BNC CataList - Tech Forum 2024New from BookNet Canada for 2024: BNC CataList - Tech Forum 2024
New from BookNet Canada for 2024: BNC CataList - Tech Forum 2024
 
Nell’iperspazio con Rocket: il Framework Web di Rust!
Nell’iperspazio con Rocket: il Framework Web di Rust!Nell’iperspazio con Rocket: il Framework Web di Rust!
Nell’iperspazio con Rocket: il Framework Web di Rust!
 

D3 js

  • 1. Data Visualization Concepts and Implementation using D3 Saturday, March 9, 13
  • 2. Agenda ✦ Hello Visualization ✦ Introducing D3 ✦ Show Me The Code ✦ Online Resources Saturday, March 9, 13
  • 6. Why Visualize ✦ Visualization helps us understand Saturday, March 9, 13
  • 7. Visualization Challenges ✦ Versatile visualizations ✦ Versatile data ✦ Scalable ✦ Interactive Saturday, March 9, 13
  • 9. D3 Is Different ✦ YOU choose how to visualize ✦ D3 just builds the DOM Saturday, March 9, 13
  • 10. What You Need ✦ Data items ✦ Know how to visualize an item Saturday, March 9, 13
  • 11. What You Need ✦ Data Item: #69ce85 ✦ Visualization: <div style=" background-color: rgb(108, 199, 224); height: 20px; width: 25px;" class="color"></div> Saturday, March 9, 13
  • 12. Demo1: Visualizing Numbers http://jsbin.com/ogenow/2/edit Saturday, March 9, 13
  • 13. D3 Concepts ✦ Use selectAll(...).data(...) to bind data and DOM ✦ Append new elements on enter() ✦ Remove them on exit() ✦ Separate visualization from data Saturday, March 9, 13
  • 14. Demo2: Visualizing Numbers Using the DOM instead of SVG is just as easy http://jsbin.com/ogenow/3/edit Saturday, March 9, 13
  • 15. Using Scales ✦ So far our scale was “coded-in” the visualization ✦ D3 helps us decouple the scale Saturday, March 9, 13
  • 16. Using Scales ✦ The scale function creates a scale var xScale = d3.scale.linear() .domain([0,data.length]) .range([50,500]); ✦ Domain is the input .attr('cx', function(d, i) { ✦ Range is the output return xScale( i ); }) ✦ Basically, it translates FROM domain TO range ✦ https://github.com/ mbostock/d3/wiki/Scales Saturday, March 9, 13
  • 17. Scales Demo http://jsbin.com/iyavef/1/edit Saturday, March 9, 13
  • 18. Show Me The Code ✦ More D3 Demos: ✦ Bar Graph http://jsbin.com/abagiv/1/edit ✦ Color Picker http://jsbin.com/igited/1/edit Saturday, March 9, 13
  • 19. More D3 Features ✦ Built-in visualizations for common SVG shapes Saturday, March 9, 13
  • 20. D3 Charts Original Data Layout SVG Shapes A function Array of Maps values that paints objects from to “shape” using SVG YOUR world values path Saturday, March 9, 13
  • 21. D3 Charts Example var pie_values = [   { y: 10, label: 'foo'}, Your Data   { y: 20, label: 'bar'},   { y: 40, label: 'buz'},   { y: 30, label: 'hss'} ]; Saturday, March 9, 13
  • 22. D3 Charts Example Layout [   {"data":{"y":10,"label":"foo"},"value":10,"startAngle": 5.654866776461628,"endAngle":6.283185307179586},   {"data":{"y":20,"label":"bar"},"value":20,"startAngle": 4.39822971502571,"endAngle":5.654866776461628},   {"data":{"y":40,"label":"buz"},"value":40,"startAngle": 0,"endAngle":2.5132741228718345},   {"data":{"y":30,"label":"hss"},"value":30,"startAngle": 2.5132741228718345,"endAngle":4.39822971502571} ] Saturday, March 9, 13
  • 23. D3 Charts Example ✦ Create a shape with: var arc = d3.svg.arc().outerRadius(150).innerRadius(0); ✦ Now we get: arc(p_data[0]) == "M-88.16778784387098,-121.3525491562421A150,150 0 0,1 -2.7553642961003488e-14,-150L0,0Z" Saturday, March 9, 13
  • 24. Pie Chart Full Demo ✦ http://jsbin.com/usujoq/1/edit Saturday, March 9, 13
  • 25. More Layouts ✦ Partition Layout ✦ Adjacency diagrams ✦ Use with d3.svg.arc Saturday, March 9, 13
  • 26. More Layouts ✦ Cluster Layout ✦ Produces dendograms ✦ Use with d3.svg.diagonal Saturday, March 9, 13
  • 27. More Layouts ✦ Pack Layout ✦ Enclosure diagrams ✦ Plain circles Saturday, March 9, 13
  • 28. More Layouts ✦ Histogram Layout ✦ Splits data to bins ✦ Use with plain rects Saturday, March 9, 13
  • 29. D3 Online ✦ Rich examples gallery: http://static.cybercommons.org/js/d3/ examples/ ✦ D3 wiki: https://github.com/mbostock/d3/wiki Saturday, March 9, 13
  • 30. Thanks For Listening ✦ Ynon Perek ✦ ynon@ynonperek.com ✦ http://ynonperek.com Saturday, March 9, 13