Quality of built environments in small & medium towns of india
Chapter 11_DMF-Status Report
1. Development And Finance, Hazaribagh Development Plan 1
MASTER OF CITY PLANNING (2013-15), DEPT. OF ARCHITECTURE & REGIONAL PLANNING, IIT KHARAGPUR
11.1 MUNICIPAL ADMINISTRATIVE STRUCTURE
11.1.1 Organizational and Administrative Structure
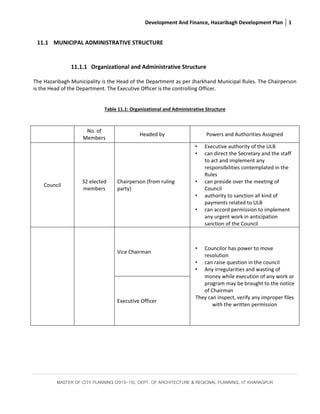
The Hazaribagh Municipality is the Head of the Department as per Jharkhand Municipal Rules. The Chairperson
is the Head of the Department. The Executive Officer is the controlling Officer.
Table 11.1: Organizational and Administrative Structure
No. of
Members
Headed by Powers and Authorities Assigned
Council
32 elected
members
Chairperson (from ruling
party)
• Executive authority of the ULB
• can direct the Secretary and the staff
to act and implement any
responsibilities contemplated in the
Rules
• can preside over the meeting of
Council
• authority to sanction all kind of
payments related to ULB
• can accord permission to implement
any urgent work in anticipation
sanction of the Council
Vice Chairman
• Councilor has power to move
resolution
• can raise question in the council
• Any irregularities and wasting of
money while execution of any work or
program may be brought to the notice
of Chairman
They can inspect, verify any improper files
with the written permission
Executive Officer
2. Development And Finance, Hazaribagh Development Plan 2
MASTER OF CITY PLANNING (2013-15), DEPT. OF ARCHITECTURE & REGIONAL PLANNING, IIT KHARAGPUR
Ward Parishad 31
councilor of the concerned
ward
• can review the activities of the ULB for
the past year and can suggest any new
preparations for the next year
• formulating plan activities
• Sanctioning of beneficiaries
• supervise the development activities in
the Ward
• verify the eligibility of Social Service
Pension beneficiaries
• verify the laxity in implementing
building rules
• review the performance audit report
of ULB
Standing
Committee
-
1.Finance Committee
2. Public Health
3. Public Works
4. Education
5. Any other special subject
• proceeding of all committees needs
confirmation of council
(Source: Secondary Data)
11.1.2 Organization Structure
Figure 11.1: Organization Chart
3. Development And Finance, Hazaribagh Development Plan 3
MASTER OF CITY PLANNING (2013-15), DEPT. OF ARCHITECTURE & REGIONAL PLANNING, IIT KHARAGPUR
The following Sections work under this Municipality:
11.1.2.1 Accounts Establishment
It includes Bills, Budget and maintenance of connected Registers and Records and Audit Report headed by a Sr.
Asst.
11.1.2.2 General Office Establishment
It includes preparation of Salary Bills/ Provident/EPF and maintenance of personal Files and Service Books of the
Employees headed by a Junior Asst.
11.1.2.3 Public Works Section
The Municipal Executive Engineer heads this Section comprising of Assistant Engineers, Jr. Engineers, Jr.
Assistants and Work Sarkars.
11.1.2.4 Tax Section
The Tax Daroga-cum-Revenue Clerk Heads the Section comprising of of Tax Collectors, Fees Collectors, and
market caretaker working under this Section.
11.1.2.5 Sanitation
The Health Officer deputed from Govt. heads the Section for Supervision of work of Sanitary Inspectors,
Sweeper Zamadar, Sweeper/ Sweepers, food Inspector and V. S. Clerk for Birth and Death.
11.1.2.6 Social Welfare Section
The S.E.O under deputation from District Office heads the Section comprising of Sr. Clerk and Peons and NMRs.
11.1.2.7 Various Departments
Table 11.2: Various Departments and Their Roles
Department Role
Scavenging
Establishment
Looks after the matters of Sewerage, drainage cleaning and Road sweeping through
manually operated persons under the various areas of Municipality by Sweepers.
The direct authority for the same is Executive Officer.
Vehicle, Transport,
Cesspool & Kalyan
Mandap
Looks after the Sanitation and sewerage cleaning around the Municipality through
mechanised method. The department also takes care of Kalyan Mandap & Water
Tank.
Works Department Looks after various developmental work like building and repairing of roads and
others along with works under BRGF scheme etc.
Tax Department Looks after various tax collections activities under Municipality areas like Holding
Tax, Water Tax etc.
Shop & License Looks after various Commercial Establishments allocation, issuing of License for
various commercial establishments etc.
Electrical Engineering Looks after various Electrical works under Municipal area with street lighting
Health Department Looks after various health issue including public health and sanitation along with
birth & death registration
Urban Poverty
Alleviation Section
Looks after various poverty alleviation programmes of State and Central government
, BPL , APL etc programmes, SGSRY etc
4. Development And Finance, Hazaribagh Development Plan 4
MASTER OF CITY PLANNING (2013-15), DEPT. OF ARCHITECTURE & REGIONAL PLANNING, IIT KHARAGPUR
11.2 DUTIES TO BE PERFORMED TO ACHIEVE THE MISSION
As per provision of Jharkhand Municipal Act, details of Service Rendered are Sanitation, Street Lighting, Water
Supply, Providing Roads, Drains and Culverts.
11.2.1 Citizens Interaction
By Organizing Awareness meetings for interaction is usually made.
11.2.2 Grievance Redresses Mechanism
Steno to Executive Officer is the in-charge of the Public Grievances; Registers have been maintained for
compliances of the Grievances.
11.3 Analysis of existing scenario
Indicators to Assess Hazaribagh Municipality's Performance
Figure 11.2: Municipal Indicators
5. Development And Finance, Hazaribagh Development Plan 5
MASTER OF CITY PLANNING (2013-15), DEPT. OF ARCHITECTURE & REGIONAL PLANNING, IIT KHARAGPUR
11.4 Administration and Management
11.4.1 Employees
Of 290 no. of sanctioned posts, 176 are in position and further 51 no. of posts have been proposed by
the Council. There is a vacancy of a total of 114 no. of posts.
The sanctioned strength and existing staff position of Hazaribagh Municipality as on 30.10.2013 is given in the
table below:
Table 11.3: Branch – General Administration
Sl. No. Category of Post No. of Posts Staff in position Vacant
1 Lekhapal 1 0 1
2 Pradhan Sahayak 1 0 1
3 Rokadpal 1 0 1
4 Sahayak 2 1 1
5 Peon 7 2 5
Total 12 3 9
Table 11.4: Branch – Tax Collection
Sl. No. Category of Post No. of Posts Staff in position Vacant
1 Tax Inspector 1 1 0
2 Tax Sub - Inspector 1 0 1
3 Sahayak 10 9 1
4 Vidhi Abhikarta 3 1 2
5 Tax Collector 5 2 3
6 Peon 3 1 2
Total 23 14 9
6. Development And Finance, Hazaribagh Development Plan 6
MASTER OF CITY PLANNING (2013-15), DEPT. OF ARCHITECTURE & REGIONAL PLANNING, IIT KHARAGPUR
Table 11.5: Branch – Public Works
Sl. No. Category of Post No. of Posts Staff in position Vacant
1 Sahayak Abhiyanta 1 1 0
2 Kaneeya Abhiyanta 2 1 1
3 Mate 1 1 0
4 Coolie (Actual +Proposed) 15 + 15 10 5
5 Peon 1 proposed - -
6 Roller Driver 1 proposed - -
Total 19 13 6
Table 11.6: Branch – Public Safety
Sl. No. Category of Post No. of Posts Staff in position Vacant
1 Prakash paryavekshak 1 0 1
2 Vidyut Mistri 4 proposed - -
3 Peon 10 proposed - -
Total 1 0 1
Table 11.7: Branch – Vaccination
Sl. No. Category of Post No. of Posts Staff in position Vacant
1 Pakshak 1 0 1
Total 1 0 1
Table 11.8: Branch – P.P.C.
Sl. No. Category of Post No. of Posts Staff in position Vacant
1 Sahayak 1 0 1
2 Peon 1 0 1
3 Ward Sweeper 11 5 6
4 Cleaning Employee 144 94 50
Total 157 99 58
7. Development And Finance, Hazaribagh Development Plan 7
MASTER OF CITY PLANNING (2013-15), DEPT. OF ARCHITECTURE & REGIONAL PLANNING, IIT KHARAGPUR
Table 11.9: Branch - Compost
Sl. No. Category of Post No. of Posts Staff in position Vacant
1 Cleaning Employee 12 7 5
Total 12 7 5
Table 11.10: Branch – Vaccination
Sl. No. Category of Post No. of Posts Staff in position Vacant
1 Driver (Actual + Proposed) 6 + 15 5 1
2 Cleaning Employee 36 25 11
Total 42 30 12
Table 11.11: Branch – Drain Cleaning
Sl. No. Category of Post No. of Posts Staff in position Vacant
1 Cleaning Employee 18 15 3
Total 18 15 3
Table 11.12: Branch – Toilet Cleaning
Sl. No. Category of Post No. of Posts Staff in position Vacant
1 Cleaning Employee 10 4 6
Total 10 4 6
Table 11.13: Branch – Park and Cremation grounds maintenance
Sl. No. Category of Post No. of Posts Staff in position Vacant
1 Cleaning Employee 5 1 4
Total 5 1 4
8. Development And Finance, Hazaribagh Development Plan 8
MASTER OF CITY PLANNING (2013-15), DEPT. OF ARCHITECTURE & REGIONAL PLANNING, IIT KHARAGPUR
Table 11.14: Branch – Water Adequacy
Sl. No. Category of Post No. of Posts Staff in position Vacant
1 Cleaning Employee 1 0 1
2 Pipeline Mistri 1 proposed 4 6
Total 1 0 1
Table 11.15: Branch – Market and Slaughterhouse
Sl. No. Category of Post No. of Posts Staff in position Vacant
1 Cleaning Employee 1 + 4 proposed 0 1
Total 1 0 1
Figure 11.3: Employees percentage
11.4.2 Inferences:
• 11 total vacant posts for various administrative and managerial staff
• A further proposal has been made in sanctioned strength.
• Huge Gap between vacancy in the Category III and Category IV employees.
11.4.3 Issues
• Vacant posts for administrative and tax collection staff.
• Lack of coordination among various departments in Municipality.
0% 20% 40% 60% 80% 100%
Total Employees
Staff on positions
Vacant positions
Proposed
9. Development And Finance, Hazaribagh Development Plan 9
MASTER OF CITY PLANNING (2013-15), DEPT. OF ARCHITECTURE & REGIONAL PLANNING, IIT KHARAGPUR
11.5 Solid Waste Management (SWM)
Erratic service of solid waste management in the city with several wards deprived of the service.
A few years earlier a NGO was given the task to operate the service but it failed due to lack of citizen
participation in paying services.
11.6 Slaughter house and Kine House
No slaughter house or Kine house is functioning in the Municipal area. There is an urgent need to establish and
operate slaughter house and Kine house in order to provide civic infrastructure to the people of Hazaribagh.
11.7 Beautification of spaces
Birsa Munda Stadium is the only stadium in Hazaribagh located at the centre point of Municipal area, which is in
a poor condition. Large companies investing in the adjacent region should come forward to take active part for
renovation and construction of ancillary developmental work of the stadium as a part of its corporate social
responsibility (CSR) and also host events to keep the place functional.
11.8 MUNICIPAL FUNCTIONAL STRUCTURE
11.8.1 Budget Preparation
As per Section 108 of J.M. Act, the detailed Estimate of Receipts & Expenditure statement for the financial year
is prepared and presented before the Standing Committee before fifteenth day of February each year. After the
Budget is presented under section 108, the Council shall consider the budget estimate and the
recommendations, if any, of the Standing Committee thereon, and shall, by the fifteenth day of March in each
year, sanction the budget estimate for the ensuing year with such changes as it may consider necessary, and
forward the budget estimate so sanctioned to –
(a) The State Government, in the case of a Municipal Corporation,
(b) The Director of Municipal Administration, in the case of Municipal Council and Nagar Panchayat.
Table 11.16: The budget estimate for the year 2012-13
1 Opening Balance Rs 11,03,23,822
2 Receipt during the year Rs 169234409
3 Expenditure Rs 5,79,11,952
4 Cash Balance at the closing of the year Rs 11,13,22,457
(Source: Secondary Data)
The Budget Estimate for the Year 2011-12 was placed in the following manner before the Council on 29.01.11
and was subsequently approved in the next council meeting on 28.02.11.
10. Development And Finance, Hazaribagh Development Plan 10
MASTER OF CITY PLANNING (2013-15), DEPT. OF ARCHITECTURE & REGIONAL PLANNING, IIT KHARAGPUR
Table 11.17: The budget estimate for the year 2011-12 (Source: Secondary Data)
1. Opening Balance Rs. 16,27,23,728
2. Receipt during the year Rs. 359481457
3. Expenditure Rs. 24,91,57,635
4. Cash Balance at the closing of the year Rs. 11,03,23,822
The financial position of the Municipality for the Year 2010-11 Up To 31st
March-2011 is as follows:
Table 11.18: The financial position of the Municipality for the year 2010-11
1. Opening Balance Rs 19,08,91,490
2. Receipt Rs, 317249190
3. Expenditure Rs. 15,46,56,092
4. Closing balance Rs. 16,25,93,098
(Source: Secondary Data)
11.8.2 Detailed municipal budget
Table 11.19: Municipal budget income details 2011-2012
Sl
No
Source of Income
Estimated
Income
in 2011-2012
Actual Income
in 2009-2010
Actual Income
for 2010-2011
up to
December
2011
Accepted
Income
for
2010-2011
1 Initial Balance 40,00,00,000 19,08,91,490 16,27,23,728 37,00,00,000
2 House Tax 65,50,530 20,98,144 15,08,540 65,40,530
3 Toilet Tax 52,40,424 15,42,338 12,06,614 52,32,424
4 Water Tax 52,40,424 15,42,338 12,06,614 52,32,424
5 Education Tax 32,75,565 9,64,072 7,54,270 32,70,565
6 Health Tax 32,75,565 9,64,072 7,54,270 32,70,565
7 Holding Tax 5,250 4,660 2,620 2,550
8 Fix Demand/Market/Stall 38,60,550 32,35,626 16,54,402 35,55,780
9
Stamp Duty-Damage
Recovery
60,00,000 — — 50,00,000
10 House Water Tax 45,66,560 2,02,290 1,93,160 45,66,560
11 Professional Tax 4,80,740 1,12,510 1,12,665 4,50,740
12 Contract Tax of Cycle 35,700 — — 35,700
11. Development And Finance, Hazaribagh Development Plan 11
MASTER OF CITY PLANNING (2013-15), DEPT. OF ARCHITECTURE & REGIONAL PLANNING, IIT KHARAGPUR
Rickshaws
13 Trade Licence Tax 23,825 10,525 — 23,575
14 Advance Return 3,00,000 — — 3,00,000
15 Deposit 7,00,000 — — 5,00,000
16 Legal Charge 1,25,000 — — 1,00,000
17 Sulabh Toilet Loan Recovery 4,50,800 3,39,947 2,90,318 4,80,650
18 Government Grant 70,00,00,000 9,22,23,350 15,71,70,987 65,00,00,000
19 Government Loan 1,05,00,00,000 1,94,81,450 49,55,663 95,00,00,000
20 Miscellaneous 1,10,00,000 36,36,378 1,06,19,965 80,00,000
Total 2,20,11,30,933 31,72,49,190 34,31,53,816 2,01,65,01,913
Total Expenditure 1,89,97,53,050 15,46,56,092 22,07,43,982 1,88,25,89,667
Final Balance 30,13,77,883 16,25,93,098 12,24,09,834 13,10,92,246
Table 11.20: Municipal budget expenditure details 2011-2012
Sl
No
Source for Expenditure
Estimated
Expenditure
in 2011-2012
Actual
Expenditure
in 2009-2010
Actual
Expenditure
of 2010-2011 up
to
Dec-11
Accepted
Expenditure
for 2010-2011
1 Normal Department 26,25,591 10,36,084 8,15,122 26,25,694
2
Revenue Collection
Department
34,80,599 14,87,998 12,77,626 33,65,732
3 PWD-Establishment 44,07,613 11,02,157 14,13,455 43,49,333
4 PWD-Works 1,30,97,03,505 11,07,43,611 16,83,68,962 1,30,25,00,000
5 Public Security 1,22,27,956 28,82,910 — 90,74,033
6 PPC 2,30,96,222 1,91,68,926 305,00,081 2,32,16,815
7 Compost 18,84,264 1,14,506 70,138 18,47,700
8 Road Cleaning 4,13,79,648 1,08,46,130 54,04,803 4,13,36,410
9 Drainage Cleaning 17,63,096 2,82,681 3,50,709 17,69,935
10 Toilet Cleaning 92,42,830 2,40,057 1,97,588 93,02,373
11 Parks & Cremation Grounds 3,73,74,395 — — 3,73,67,675
12 Markets & Slaughter 2,57,58,503 — — 2,57,53,913
12. Development And Finance, Hazaribagh Development Plan 12
MASTER OF CITY PLANNING (2013-15), DEPT. OF ARCHITECTURE & REGIONAL PLANNING, IIT KHARAGPUR
Houses
13 Water Adequacy 40,29,93,648 7,35,979 14,22,927 39,90,91,791
14 Vaccine Centre 1,09,180 — — 1,02,263
15 Hospital & Dispensary 6,000 — — 6,000
16 Miscellaneous 1,49,50,000 37,63,613 80,35,191 1,49,50,000
17 Legal Charges 2,00,000 15,000 — 2,00,000
18 Return of Government Debt 18,00,000 — — 11,00,000
19 Advance 47,50,000 22,36,440 28,87,380 36,30,000
20 Return of Deposit 10,00,000 — — 4,00,000
21 Education & Health 10,00,000 — — 6,00,000
Total 1,89,97,53,050 15,46,56,092 22,07,43,982 1,88,25,89,667
Table 11.21: Municipal budget income details 2012-2013
Sl
No
Source of Income
Estimated
Income
In 2012-2013
Actual Income
in 2010-2011
Actual Income
for 2011-2012
upto
Dec-12
Accepted
Income
for
2011-2012
1 Initial Balance 40,00,00,000 16,27,23,728 11,03,23,822 37,00,00,000
2 House Tax 66,25,750 25,09,643 13,06,296 65,40,530
3 Toilet Tax 52,53,240 20,07,352 10,44,849 52,32,424
4 Water Tax 52,53,240 20,07,352 10,44,849 52,32,424
5 Education Tax 33,12,875 12,54,821 6,53,148 32,70,565
6 Health Tax 33,12,875 12,54,821 6,53,148 32,70,565
7 Holding Tax 5,260 5,465 3,570 2,550
8 Fix Demand/Market/Stall 38,67,850 24,13,091 12,08,764 35,55,780
9
Stamp Duty-Damage
Recovery
60,00,000 — — 50,00,000
10 House Water Tax 45,66,560 2,65,611 72,040 45,66,560
11 Professional Tax 5,20,810 1,51,825 90,140 4,50,740
12
Contract Tax of Cycle
Rickshaws
35,700 — — 35,700
13. Development And Finance, Hazaribagh Development Plan 13
MASTER OF CITY PLANNING (2013-15), DEPT. OF ARCHITECTURE & REGIONAL PLANNING, IIT KHARAGPUR
13 Trade Licence Tax 24,750 3,100 4,380 23,575
14 Advance Return 3,00,000 — — 3,00,000
15 Deposit 7,00,000 — — 5,00,000
16 Legal Charge 1,25,000 — — 1,00,000
17 Sulabh Toilet Loan Recovery 4,50,800 — 4,23,60,745 4,80,650
18 Government Grant 70,00,00,000 16,60,65,029 84,95,422 65,00,00,000
19 Government Loan 10,00,00,000 1,26,12,068 19,73,236 95,00,00,000
20 Miscellaneous 1,10,00,000 62,07,551 16,92,34,409 80,00,000
Total 1,25,13,54,710 35,94,81,457 5,79,11,952 2,01,65,62,063
Total Expenditure 1,04,97,45,223 24,91,57,635 11,13,22,457 1,88,25,89,667
Final Balance 20,16,09,487 11,03,23,822 13,39,72,396
Table 11.22: Municipal budget expenditure details 2012-2013
Sl
No
Source for Expenditure
Estimated
Expenditure
in 2012-2013
Actual
Expenditure
in 2010-2011
Actual
Expenditure
of 2011-2012
upto
Dec-12
Accepted
Expenditure
for 2011-2012
1 Normal Department 33,68,286 11,01,709 16,68,885 26,25,694
2
Revenue Collection
Department
49,96,446 17,46,094 19,45,207 33,65,732
3 PWD-Establishment 1,04,33,847 16,17,642 11,12,093 43,49,333
4 PWD-Works 74,25,00,000 18,97,34,910 1,60,99,364 1,30,25,00,000
5 Public Security 1,92,48,715 — 23,36,448 90,74,033
6 PPC 3,55,39,745 3,91,51,415 2,09,62,939 2,32,16,815
7 Compost 27,54,043 83,824 1,02,520 18,47,700
8 Road Cleaning 4,55,43,716 15,22,483 27,08,896 4,13,36,410
9 Drainage Cleaning 30,19,946 4,07,354 4,40,248 17,69,935
10 Toilet Cleaning 99,66,868 2,39,952 3,20,114 93,02,373
11
Parks & Cremation
Grounds
1,72,22,552 — — 3,73,67,675
14. Development And Finance, Hazaribagh Development Plan 14
MASTER OF CITY PLANNING (2013-15), DEPT. OF ARCHITECTURE & REGIONAL PLANNING, IIT KHARAGPUR
12
Markets & Slaughter
Houses
1,81,01,778 — — 2,57,53,913
13 Water Adequacy 11,39,01,445 15,26,519 13,50,048 39,90,91,791
14 Vaccine Centre 1,71,836 — — 1,02,263
15 Hospital & Dispensary 6,000 — — 6,000
16 Miscellaneous 1,42,20,000 91,38,353 63,78,690 1,49,50,000
17 Legal Charges 2,00,000 — 15,000 2,00,000
18
Return of Government
Debt
18,00,000 — — 11,00,000
19 Advance 47,50,000 28,87,380 24,71,500 36,30,000
20 Return of Deposit 10,00,000 — — 4,00,000
21 Education & Health 10,00,000 — — 6,00,000
Total 1,04,97,45,223 24,91,57,635 5,79,11,952 1,88,25,89,667
Table 11.23: Municipal budget income details 2013-2014
Sl
No
Source of Income
Estimated Income
In 2013-2014
Actual Income
in 2011-2012
Actual Income
for 2012-2013
upto
Dec-13
Accepted
Income
for
2012-2013
1 Initial Balance 40,00,00,000 16,27,23,728 11,03,23,822 37,00,00,000
2 House Tax 66,25,750 25,09,643 13,06,296 65,40,530
3 Toilet Tax 52,53,240 20,07,352 10,44,849 52,32,424
4 Water Tax 52,53,240 20,07,352 10,44,849 52,32,424
5 Education Tax 33,12,875 12,54,821 6,53,148 32,70,565
6 Health Tax 33,12,875 12,54,821 6,53,148 32,70,565
7 Holding Tax 5,260 5,465 3,570 2,550
8 Fix Demand/Market/Stall 38,67,850 24,13,091 12,08,764 35,55,780
9
Stamp Duty-Damage
Recovery
60,00,000 — — 50,00,000
10 House Water Tax 45,66,560 2,65,611 72,040 45,66,560
11 Professional Tax 5,20,810 1,51,825 90,140 4,50,740
12 Contract Tax of Cycle 35,700 — — 35,700
15. Development And Finance, Hazaribagh Development Plan 15
MASTER OF CITY PLANNING (2013-15), DEPT. OF ARCHITECTURE & REGIONAL PLANNING, IIT KHARAGPUR
Rickshaws
13 Trade Licence Tax 24,750 3,100 4,380 23,575
14 Advance Return 3,00,000 — — 3,00,000
15 Deposit 7,00,000 — — 5,00,000
16 Legal Charge 1,25,000 — — 1,00,000
17
Sulabh Toilet Loan
Recovery
4,50,800 — — 4,80,650
18 Government Grant 70,00,00,000 16,60,65,029 4,23,60,745 65,00,00,000
19 Government Loan 10,00,00,000 1,26,12,068 84,95,422 95,00,00,000
20 Miscellaneous 1,10,00,000 62,07,551 19,73,236 80,00,000
Total 1,25,13,54,710 35,94,81,457 16,92,34,409 2,01,65,62,063
Total Expenditure 1,04,97,45,223 24,91,57,635 5,79,11,952 1,88,25,89,667
Final Balance 20,16,09,487 11,03,23,822 11,13,22,457 13,39,72,396
Table 11.24: Municipal budget expenditure details 2013-2014
Sl
No
Source for Expenditure
Estimated
Expenditure
in 2013-2014
Actual
Expenditure
in 2011-2012
Actual
Expenditure
of 2012-2013 upto
Dec-13
Accepted
Expenditure
for 2012-2013
1 Normal Department 33,68,286 11,01,709 16,68,885 26,25,694
2
Revenue Collection
Department
49,96,446 17,46,094 19,45,207 33,65,732
3 PWD-Establishment 1,04,33,847 16,17,642 11,12,093 43,49,333
4 PWD-Works 74,25,00,000 18,97,34,910 1,60,99,364 1,30,25,00,000
5 Public Security 1,92,48,715 — 23,36,448 90,74,033
6 PPC 3,55,39,745 3,91,51,415 2,09,62,939 2,32,16,815
7 Compost 27,54,043 83,824 1,02,520 18,47,700
8 Road Cleaning 4,55,43,716 15,22,483 27,08,896 4,13,36,410
9 Drainage Cleaning 30,19,946 4,07,354 4,40,248 17,69,935
10 Toilet Cleaning 99,66,868 2,39,952 3,20,114 93,02,373
11
Parks & Cremation
Grounds
1,72,22,552 — — 3,73,67,675
16. Development And Finance, Hazaribagh Development Plan 16
MASTER OF CITY PLANNING (2013-15), DEPT. OF ARCHITECTURE & REGIONAL PLANNING, IIT KHARAGPUR
12
Markets & Butcher
Houses
1,81,01,778 — — 2,57,53,913
13 Water Adequacy 11,39,01,445 15,26,519 13,50,048 39,90,91,791
14 Vaccine Centre 1,71,836 — — 1,02,263
15 Hospital & Dispensary 6,000 — — 6,000
16 Miscellaneous 1,42,20,000 91,38,353 63,78,690 1,49,50,000
17 Legal Charges 2,00,000 — 15,000 2,00,000
18
Return of Government
Debt
18,00,000 — — 11,00,000
19 Advance 47,50,000 28,87,380 24,71,500 36,30,000
20 Return of Deposit 10,00,000 — — 4,00,000
21 Education & Health 10,00,000 — — 6,00,000
Total 1,04,97,45,223 24,91,57,635 5,79,11,952 1,88,25,89,667
11.8.3 Municipal income
There is a very high dependency on Government grants, and its share has increased down the years.
Figure 11.4: Income & Expenditure Details 2011-2012
17. Development And Finance, Hazaribagh Development Plan 17
MASTER OF CITY PLANNING (2013-15), DEPT. OF ARCHITECTURE & REGIONAL PLANNING, IIT KHARAGPUR
Figure 11.5: Income & Expenditure Details 2013-2014
11.8.4 Taxation Powers
(1) Subject to the provisions of this Act, the municipality shall have, for the purposes of this Act, the power to
levy the following taxes:-
(a) Property tax on lands and buildings,
(b) Tax on vacant land,
(c) Surcharge on transfer of lands and buildings,
(d) Tax on deficit in parking spaces in any non-residential building,
(e) Water tax,
(f) Fire tax,
(g) Tax on advertisements, other than advertisements published in newspapers,
(h) Surcharge on entertainment tax,
(i) surcharge on electricity consumption within the municipal area,
(j) Tax on congregations,
(k) Tax on pilgrims and tourists,
(l) Toll –
(i) On roads, bridges, ferries and navigable channels; and
(ii) On heavy trucks which shall be heavy goods vehicles, and buses, which shall be heavy
passenger motor vehicles, within the meaning of the Motor Vehicles Act, 1988, plying on a
public street;
(m) Tax on Trade and Profession:
Provided that where tax on profession is levied on salaried employees, it may be deducted at source by
the employer and be directly remitted to the municipality.
18. Development And Finance, Hazaribagh Development Plan 18
MASTER OF CITY PLANNING (2013-15), DEPT. OF ARCHITECTURE & REGIONAL PLANNING, IIT KHARAGPUR
11.8.4.1 Existing Tax
a) Property Tax
b) Water Rate
c) Health Tax
d) Education Tax
e) Fee on Building Application
f) Latrine Tax
g) Offensive & Dangerous Trade Tax
h) Toll on Bridges & Vehicles
i) Profession Tax
j) Bus Stand Fee
11.9 Municipal tax details
11.9.1 Property Tax
It depends on the category of Structure i.e S-Range (Marble/Mosaic Flooring), B-Range (PCC Flooring) and C-
Range (Semi-Pucca Buildings). Based on the category of structure the value of property is set by Nagar Palika
then 9% of 3.75% of that property value is collected as property tax. Vacant lands are exempted from taxes.
Property tax is further divided into several parts elicited below-
• Holding Tax - 2.25%
• Latrine Tax - 2%
• Water Tax - 2%
• Education Cess - 1.25%
• Health Cess - 1.25%
• Total - 9%
11.9.2 Commercial Property Tax
It depends on the category of Structure i.e S-Range (Marble/Mosaic Flooring), B-Range (PCC Flooring) and C-
Range (Semi-Pucca Buildings). Based on the category of structure the value of property is set by Nagar Palika
then 9% of 3.75% of that property value is collected as property tax. The rate for evaluation is as following-
• A Range - Rs 2190/ Sqft
• B Range - Rs 875/ Sqft
• C Range - Rs 315/ Sqft
11.9.3 Licence Fee
Licence fee is collected on the basis of the area of the
commercial entity i.e Rs 1000 + Rs 15 /Sqft whereas there is
no provision for the collection of Road Tax and Professional
Tax. The Tax-Rates were last revised in 1994-95. That time
almost 50% of the tax hike had been done.
Figure 11.6: Trade Licence Details
19. Development And Finance, Hazaribagh Development Plan 19
MASTER OF CITY PLANNING (2013-15), DEPT. OF ARCHITECTURE & REGIONAL PLANNING, IIT KHARAGPUR
11.9.4 Commercial Tax -
Commercial tax from the commercial entities are collected in Hazaribagh based on their annual turnovers, the
rates are given as below-
• 0-50,000 - Rs 300/ pa
• 50,000-1,00,000 - Rs 400/ pa
• 1 Lac-10 Lacs - Rs 700/ pa
• 10 Lacs-25 Lacs - Rs 1200/ pa
• 25 Lacs-50 Lacs - Rs 1500/ pa
• More than 50 Lacs - Rs 2500/ pa
11.9.5 Non-revenue taxes
Table 11.25: Hording/Billboard Tax
Sl
No
Advertisement Government Land Private Land
1 LED Over signage Rs 90/ Sqft Rs 15/Sqft
2 Advertisement Board X Rs 11.25/Sqft
3 Unipole Rs 90/ Sqft Rs 37.50/Sqft
4 Traffic Trolley Rs 37.50/Sqft/Week Rs 37.50/Sqft/Week
5 Advertisement on Moving Vehicle Rs 48.75/Sqft/Week Rs 48.75/Sqft/Week
6 Banner Rs 1.50/Sqft/Week Rs 1.50/Sqft/Week
7 Torana Gate Rs 1125/Gate/3 Days
8 Shop Advertisement Rs 90/Sqft/Year Rs 90/Sqft/Year
9 Wall Paintings Rs 48.75/Sqft/Year Rs 48.75/Sqft/Year
11.10Efficiency Indicator
11.10.1 Collection Efficiency of Tax Collection Wards
Low collection efficiency and there are several sectors where taxation is exempted or are not collected
with due efficiency. There are several opportunities for property tax reforms and levying user or service
charges for municipal services to ensure continued operations.
20. Development And Finance, Hazaribagh Development Plan 20
MASTER OF CITY PLANNING (2013-15), DEPT. OF ARCHITECTURE & REGIONAL PLANNING, IIT KHARAGPUR
Table 11.26: Municipal Tax Targeted vs Collected Details 2010-2011
Sl Tax Last Due
Current
Demand
Total
Demand
Total
Collection
Balance Percentage
1 House Tax 2944258 2005775 4950033 2569643 2380390 51.91
2 Latrine Tax 2386483 1605836 3992319 2007352 1984967 50.28
3 Water Tax 2386483 1605836 3992319 2007352 1984967 50.28
4 Education Less 1099964 1002888 2102852 1254821 848031 59.67
5 Health Less 1471119 1002888 2474007 1254821 1219186 50.72
Total 'A' 10288307 7223223 17511530 9093989 8417541 51.93
6 Market Auction 90502 744500 835002 835002 0 100.00
7 Shop Rent 901154 1546930 2448084 1578089 869995 64.46
8 Professional Tax 341461 136200 477661 151825 325836 31.79
9 Licence 15207 8722 23929 3100 20829 12.95
10 Lease 19388 3285 22673 5465 17208 24.10
Total 'B' 1367712 2439637 3807349 2573481 1233868 67.59
Total 2644922 9662860 21318879 11667470 9651409 54.73
Table 11.27: Municipal Tax Targeted vs Collected Details 2011-2012
Sl Tax Last Due
Current
Demand
Total
Demand
Total
Collection
Balance Percentage
1 House Tax 2380390 2056804 4437194 2021797 2415397 45.56
2 Latrine Tax 1984967 1645161 3630128 1617146 2012982 44.55
3 Water Tax 1984967 1645161 3630128 1617146 2012982 44.55
4 Education Less 848031 1028402 1876433 1010899 865534 53.87
5 Health Less 1219186 1028402 2247588 1010899 1236689 44.98
Total 'A' 8417541 7403930 15821471 7277887 8543584 46.00
6 Market Auction 991800 991800 991800 0 100.00
7 Shop Rent 869995 1650780 2520775 1935848 584927 76.80
8 Professional Tax Tax 325836 176275 502111 123510 378601 24.60
9 Licence 20829 8722 29551 7430 22121 25.14
21. Development And Finance, Hazaribagh Development Plan 21
MASTER OF CITY PLANNING (2013-15), DEPT. OF ARCHITECTURE & REGIONAL PLANNING, IIT KHARAGPUR
10 Lease 17208 3285 20493 8550 11943 41.72
Total 'B' 1233868 2830862 4064730 3067138 997592 75.46
Total 9651409 10234792 19886201 10345025 9541176 52.02
Table 11.28: Municipal Tax Targeted vs Collected Details 2012-2013
Sl Tax Last Due
Current
Demand
Total
Demand
Total
Collection
Balance Percentage
1 House Tax 2415397 2122058 4537455 2454997 2082458 54.11
2 Latrine Tax 2012982 1697341 3710323 1963644 1746679 52.92
3 Water Tax 2012982 1697341 3710323 1963644 1746679 52.92
4 Education Less 865534 1061029 1926563 1227498 699065 63.71
5 Health Less 1236689 1061029 2297718 1227498 1070220 53.42
Total 'A' 8543584 7638798 16182382 8837281 7345101 54.61
6 Market Auction 1580500 1580500 1418000 162500 89.72
7 Shop Rent 1584927 1445275 3030202 2675868 354334 88.31
8 Professional Tax Tax 37860 232625 270485 219680 50805 81.22
9 Licence 22121 8722 30843 4500 26343 14.59
10 Lease 11943 3285 15228 9735 5493 63.93
Total 'B' 1656851 3270407 4927258 4327783 599475 87.83
Total 10200435 10909205 21109640 13165064 7944576 62.37
Table 11.29: Collection Statement for the Financial Year 2009 to 2013
TAXES
FINANCIAL YEAR (2010-2011) FINANCIAL YEAR (2012-2013)
2009-10 (IN
LAKHS)
2010-11 (IN
LAKHS)
% OF RISE/FALL
(2010-11)
2011-12 (IN
LAKHS)
2012-13
(IN LAKHS)
% OF
RISE/FALL
(2012-13)
Repealed JST 67.01 6.13 -90.85% 13.94 127.32 813.34%
JVAT 6332.25 7470.1 17.97% 9638.09 12516.57 29.87%
CST 5075.83 4694.38 -7.52% 5617.57 4823.17 -14.14%
ET 0 0 0% 2.02 0 -100%
ENT 14.19 5.26 -62.93% 6.57 3.08 -53.12%
ED 156.31 149.16 -4.57% 224.97 263.14 16.97%
22. Development And Finance, Hazaribagh Development Plan 22
MASTER OF CITY PLANNING (2013-15), DEPT. OF ARCHITECTURE & REGIONAL PLANNING, IIT KHARAGPUR
HLT 3.12 4.73 51.60% 5.64 10.61 88.12%
JPT 0 0 0% 0 216.02 0%
Adv. Tax 0 0 0% 0 0 0%
TOTAL 11648.71 12329.76 5.85% 15508.8 17959.91 15.80%
11.10.2 Issue
Low income generation through various tax revenue & non tax revenue of municipal system
Figure 11.7: Municipal Income
12
46
1
424
85
20
39 46
5
424
100
110
0
50
100
150
200
250
300
350
400
450
2011-2012
2012-2013
11.10.3 Dependency Ratio
Dependency Ratio is 73.1 %, whereas in Indian context the general Dependency Ratio should be 25-30%,
which shows the over-dependency of system for the government grants and less revenue generation by the
municipality.
23. Development And Finance, Hazaribagh Development Plan 23
MASTER OF CITY PLANNING (2013-15), DEPT. OF ARCHITECTURE & REGIONAL PLANNING, IIT KHARAGPUR
Figure 11.8: Share of Various Works in Municipal Budget
34 50 104
192
355
28
455
30
100
172 181
1139
142
18 48 10 10
0
200
400
600
800
1000
1200
11.10.4 Establishment & Administration Expenditure Ratio is 14.4 % whereas in
Indian context average ratio is 50-60 %, which shows the lesser establishment activities
in Hazaribagh.
11.10.5 Operation & Maintenance Expenditure Ratio is 27.5 % whereas in Indian
context average ratio is 11-25 %, which shows the more funds are allotted towards the
maintaining the projects rather that the new establishments.
11.10.6 Capital Expenditure Ratio is 13.4 % whereas in Indian scenario general
pattern is around 25 %, which shows under dependency towards the capital outlays
(asset managements).
Figure 11.9: Tax Collection
2569643
2007352
2007352
1254821
1254821
2021797
1617146 1617146
1010899
1010899
2454997
1963644 1963644
1227498
1227498
0
500000
1000000
1500000
2000000
2500000
3000000
House Tax Latrine Tax Water Tax Education Less Health Less
2010-11
2011-12
2012-13
24. Development And Finance, Hazaribagh Development Plan 24
MASTER OF CITY PLANNING (2013-15), DEPT. OF ARCHITECTURE & REGIONAL PLANNING, IIT KHARAGPUR
11.10.7 Cost Recovery Ratio is 86.6% whereas the average Cost Recovery Ratio in
Indian scenario is around 40%, which shows no-tax revenue sources are sharing the
greater part in municipal revenue collection than that of tax revenue sources.
Figure 11.10: Tax Targeted Vs Collected
11.10.8
45.4
37.1
37.1
19.3
23.0
15.8
30.3
2.7
0.3
0.2
24.5
19.6
19.6
12.3
12.3
14.2
26.8
2.2
0.0
0.1
Tax targetedvs collected2012-2013
Tax Targetted Tax Collected
49.5
39.9
39.9
21.0
24.7
8.4
24.5
4.8
0.2
0.2
25.7
20.1
20.1
12.5
12.5
8.4
15.8
1.5
0.0
0.1
Tax Targetted
44.4
36.3
36.3
18.8
22.5
9.9
25.2
5.0
0.3
0.2
20.2
16.2
16.2
10.1
10.1
9.9
19.4
1.2
0.1
0.1
Tax targetedvs collected2011-2012
Tax Targetted Tax Collected
25. Development And Finance, Hazaribagh Development Plan 25
MASTER OF CITY PLANNING (2013-15), DEPT. OF ARCHITECTURE & REGIONAL PLANNING, IIT KHARAGPUR
11.10.9 OTHER FISCAL PERFORMANCE OF HAZARIBAGH LOCAL BODY
11.10.9.1Decentralization Ratio is 3.4 %, whereas in Indian scenario the average decentralization ratio
should be 50-60%, which shows the obsolete & inefficient revenue collection system of the city.
11.10.9.2Revenue Administrative Efficiency in Hazaribagh is 0.2 % only which shows almost negligible
revenue collection by the municipality in comparison with the GSDP of Jharkhand.
Figure 11.11: Target Vs Achieved property tax collection
11.10.9.3 Existing Areas under Municipal Boundary
Residential Area: 8.57 sq. Km
Commercial Area: 0.435 sq. Km
11.10.9.4Property Tax as per existing tax structure
Residential Area + Commercial Area Rs. 24.5 Lacs
11.10.8 Inferences:
Collection Efficiency: Tax Collection Efficiency of Municipality is around 62.37 percent which depicts a it
as a thrust area of tax administration management. Also, the posts of tax collector are vacant.
26. Development And Finance, Hazaribagh Development Plan 26
MASTER OF CITY PLANNING (2013-15), DEPT. OF ARCHITECTURE & REGIONAL PLANNING, IIT KHARAGPUR
Enforcement of Tax Laws and Policies: Collection of own revenue, that is, tax and non-tax revenue as it
is, is not enough to enable them to make increasing investments in physical infrastructure and social
sector development including health and education. If one looks at the sources of revenue available to
the Municipality, their relatively poor growth performance in revenue mobilization is due to their failure
to enforce the tax laws and overcome complacency in tax and non-tax revenue collection.
Tax Collection Trends: For 3 consecutive years show that tax collection from holding tax and rate wise
tax imposed on several utilities like drainage, light, water etc have increased considerably.
11.11SCHEMES AND GRANTS
Within the municipal boundaries the major financial source for the various developments are the grants
received from state government & central government. The major grants are:-
11.11.1 State Grants: MLA local area development (MLALAD) grant is the biggest from
the state government. The grant consists of Rs. 2 Crores which is now increase w.e.f
2011-12 upto Rs 4 Crores per annum under which no individual project cost should be
exceeded Rs 2 Crores. Other than MLALAD, MLA- Jalnidhi Yojna consists of Rs 1 Cr per
annum, Mukhya Mantri Vikas Yojna Consists of Rs. 1 Cr per annum & CM-Lok Jalnidhi
Yojna brings Rs 1 Cr per annum to the municipality. Although all state grants are having
only 25 % contribution in the amount of mentioned grants, rest 75% amount is
contributed by the central government.
11.11.2 Central Grants & Schemes: Central grants consists of MP local area
development funds (MPLAD) under which Rs 2 Cr is sanctioned per year. Other than MP
LAD central government also provides funds for various other schemes but all such kind
of schemes are more applicable for beyond the municipal limits of the city. These
schemes comprises of NRLM (National Rural Livelihood Mission), MGNREGA, IAY (Indira
Awas Yojna), IHSDP (Integrated Housing & Slum Development Program, VAMBAY
(Valmiki Ambedkar Awas Yojna), & IAP (Integrated Action Plans).
11.11.3 NATIONAL RURAL LIVELIHOOD MISSION
This scheme is started in finical year 2012-2013 total Rs 212.15 lacs was sanctioned but due to the initial
settlements only 0.17% could be implemented. The further detail is elicited below:
27. Development And Finance, Hazaribagh Development Plan 27
MASTER OF CITY PLANNING (2013-15), DEPT. OF ARCHITECTURE & REGIONAL PLANNING, IIT KHARAGPUR
Table 11.30: NRLM Funds
Sl.No NRLM Components Fund Allocation
1 Institution Building 31.062
2 Training and Capacity Building 51.620
3 Revolving Fund & Capital Subsidy 62.124
4 Interest Subsidy 20.708
5 Infrastructure and Marketing 31.062
6 Admin Costs 9.960
7 Bank Interest Received 5.617
TOTAL 212.152
Figure 11.12: NRLM Funds
28. Development And Finance, Hazaribagh Development Plan 28
MASTER OF CITY PLANNING (2013-15), DEPT. OF ARCHITECTURE & REGIONAL PLANNING, IIT KHARAGPUR
11.11.4 INTEGRATED ACTION PLAN
The Integrated Action Plan (IAP) for Selected Tribal and Backward Districts under the BRGF program will covers
the whole district, and will be implemented with a block grant of 25 crore and 30 crore per district during 2010-
11 and 2011-12 respectively.
Table 11.31: Integrated Action Plan Financial Summary upto Mar 2010-2011
Sl.
No.
Year Month Project Id Name of Scheme/Project
No. of Projects
sanctioned
Funds
Released
1 2010-11 March 4353 Construction of Health Sub Centre 25 0
2 2010-11 March 2420 Construction of ICDS Building 336 815
3 2010-11 March 2414
Construction of Mini Rural Water
Supply Scheme Through HYDT
(PHED)
7 16.15
4 2010-11 March 2422 Construction of Roads and Bridges 12 261
5 2010-11 March 2416
Construction of Tube well in
Villages, Schools and Health Sub
Centre (PHED)
504 46
6 2010-11 March 2418
Construction on Pucca Check dam,
Guard Wall, Lift Irrigation, Nala,
Loose Bolder Check dam
50 789
7 2010-11 March 4288
Deepening of Chharwa dam Water
supply scheme(PHED)
1 0
Total 935 1927.15
Table 11.32: Integrated Action Plan Financial Summary upto Mar 2011-2012
Sl.
No.
Year Month Project Id Name of Scheme/Project
No. of Project
sanctioned
Funds
Released
Anganbadi Centres
1 2011-12 March 2420Construction of ICDS Building 336 1,253.92
Total: 336 1253.92
29. Development And Finance, Hazaribagh Development Plan 29
MASTER OF CITY PLANNING (2013-15), DEPT. OF ARCHITECTURE & REGIONAL PLANNING, IIT KHARAGPUR
Drinking Water Facilities/ Drainage & Sanitation
2 2011-12 March 2414
Construction of Mini Rural Water
Supply Scheme Through HYDT
(PHED)
7 16.15
3 2011-12 March 2416
Construction of Tube well in
Villages, Schools and Health Sub
Centre (PHED)
424 164.34
4 2011-12 March 4288
Deepening of Chharwa dam Water
supply scheme(PHED)
1 427.2
5 2011-12 March 18422
Water Supply Scheme in
Community Toilet
1 1.93
Total: 433 609.62
Health Centres/Facilities
6 2011-12 March 4353Construction of Health Sub Centre 24 330.53
Total: 24 330.53
Minor Irrigation Works
7 2011-12 March 7059Renovation of ponds 30 328.9
8 2011-12 March 7302Construction of check dam 21 420.52
9 2011-12 March 7303Renovation of Lift Irrigation 19 95.69
10 2011-12 March 2418
Construction on Pucca Check dam,
Guard Wall, Lift Irrigation, Nala,
Loose Bolder Check dam
55 820.18
Total: 125 1665.29
Village Roads
11 2011-12 March 2422 Construction of Roads and Bridges 14 634.62
Total: 14 634.62
Grand Total: 932 4493.98
Table 11.33: Integrated Action Plan Financial Summary upto Mar 2012-2013
Sl.
No.
Year Month Proj. Id Name of Scheme/Project
No. of Proj.
sanct- ioned
Funds Rel-
eased
Anganwadi Centres
1 2012-13 March 2420Construction of ICDS Building 336 1,655.02
Total: 336 1655.02
30. Development And Finance, Hazaribagh Development Plan 30
MASTER OF CITY PLANNING (2013-15), DEPT. OF ARCHITECTURE & REGIONAL PLANNING, IIT KHARAGPUR
Community Hall
2 2012-13 March 27341
Construction of Community Hall
(2012-13)
3 47.61
Total: 3 47.61
Drinking Water Facilities/ Drainage & Sanitation
3 2012-13 March 18422
Water Supply Scheme in
Community Toilet
1 3.86
4 2012-13 March 2414
Construction of Mini Rural Water
Supply Scheme Through HYDT
(PHED)
7 16.15
5 2012-13 March 2416
Construction of Tube well in
Villages, Schools and Health Sub
Centre (PHED)
432 164.34
6 2012-13 March 4288
Deepening of Chharwa dam Water
supply scheme(PHED)
1 427.2
Total: 441 611.56
Health Centres/Facilities
7 2012-13 March 4353Construction of Health Sub Centre 24 530
8 2012-13 March 27339Renovation of Sadar Hospital 2 41.41
Total: 26 571.41
Minor Irrigation Works
9 2012-13 March 23890Medium Irrigation Work (2012-13) 6 180.29
10 2012-13 March 7059Renovation of ponds 30 328.9
11 2012-13 March 7302Construction of check dam 21 420.52
12 2012-13 March 7303Renovation of Lift Irrigation 19 98.78
13 2012-13 March 2418
Construction on Pucca Check dam,
Guard Wall, Lift Irrigation, Nala,
Loose Bolder Check dam
55 820.18
Total: 131 1848.68
School Buildings / School Infrastructure
14 2012-13 March 22154Construction of Birsa Munda Library 5 87.5
Total: 5 87.5
Skill Development and Training
15 2012-13 March 27342
Construction of Youth Training
Centre (2012-13)
1 17.22
31. Development And Finance, Hazaribagh Development Plan 31
MASTER OF CITY PLANNING (2013-15), DEPT. OF ARCHITECTURE & REGIONAL PLANNING, IIT KHARAGPUR
Total: 1 17.22
Village Roads
16 2012-13 March 2422Construction of Roads and Bridges 14 694.73
Total: 14 694.73
Grand Total: 957 5533.72
Table 11.34: IAP Status
2010-2011
Physical Status Financial Status
No. of
Proj.
sanct-
ioned
No. of
Projects
taken up
No. of
Proj.
Comp-
leted
Funds
Rel-
eased
Amounts
for work
taken up
Expend-
iture
Health Centres/Facilities 25 25 0 0 565 0
Civil Construction 386 377 0 1604 2,510.38 559.06
Water Supply, Sanitation & Dam
Management
8 7 0 16.15 443.35 0
Roads & Bridges 12 12 0 261 522 30
Village School/Health 504 504 105 46 202 45
2011-2012
Anganwadi Centres 336 327 222 1253.92 1,718.09 1121.34
Water Supply, Sanitation & Dam
Management
433 433 432 609.62 618.13 532.56
Health Centres/Facilities 24 24 10 330.53 558.63 282.99
Minor Irrigation Works 125 125 125 1665.29 1,726.56 1643.81
Village Roads 14 14 12 634.62 690.6 569
2012-2013
Anganwadi Centres 336 327 285 1655.02 1,718.09 1378.17
Civil Construction 3 3 0 47.61 65.21 27.67
Water Supply, Sanitation & Dam
Management
441 441 433 611.56 618.13 577.2
Health Centres/Facilities 26 26 24 571.41 607.86 485.03
32. Development And Finance, Hazaribagh Development Plan 32
MASTER OF CITY PLANNING (2013-15), DEPT. OF ARCHITECTURE & REGIONAL PLANNING, IIT KHARAGPUR
Minor Irrigation Works 131 131 127 1848.68 1,956.86 1786.37
Educational Infrastructure 6 6 0 104.72 149.43 63.3
Village Roads 14 14 14 694.73 694.73 694.73
2013-2014
Water Supply, Sanitation & Dam
Management
82 82 80 1313.18 1465.03 1256.26
Village School/Health 432 432 427 167.58 174.15 167.37
Civil Construction 466 457 411 3531.88 3,947.63 3228.66
Roads & Bridges 93 93 61 2,334.80 2,895.79 1,964.24
Health Centres/Facilities 30 30 24 623.13 680.1 499.37
Minor Irrigation Works 6 6 6 180.29 199.81 176.74
11.11.5 Inferences:
The efficiencies of the projects taken up is below par. In every year the nos of projects taken up are
much more than the actual completion. The same scenario stands real in case of financial progress too.
More funds should be allocated for the various social & physical infrastructure as the city lacks the good
health facilities, the provision of the funds in these sectors to be increased.
11.11.6 STATE GRANTS- MLA SCHEME FY 2012-2013
Table 11.35: MLA Grants 2012-2013
Sl.No. District Name of MLA
Name of
Assembly
No. of Scheme
Recommended
Estimate
Cost (Rs. In
Lakh)
1 Hazaribag
Hon'ble Sri Sorbh Narayan Singh,
Hazaribaghbag
Sadar 25 72.650
2 Hazaribag Hon'ble Sri Teklal Mahto, Mandu Mandu 46 101.320
3 Hazaribag Hon'ble Sri Yogendra Saw, Barkagoan Barkagaon 15 39.850
4 Hazaribag Hon'ble Sri Uma Shankar Akela, Barhi Barhi 36 183.820
5 Hazaribag Hon'ble Sri Amit Yadav, Barkatha Barkattha 107 164.730
6 Hazaribag
Hon'ble Sri Binod Kumar Singh,
Bagodar
Bagodar 8 18.630
Total 237 581.000
33. Development And Finance, Hazaribagh Development Plan 33
MASTER OF CITY PLANNING (2013-15), DEPT. OF ARCHITECTURE & REGIONAL PLANNING, IIT KHARAGPUR
Table 11.36: State Grants- MLA Lok Jansamridhi Scheme FY 2012-2013
Sl.No. District Name of MLA
Name of
Assembly
No. of Scheme
Recommended
Estimate
Cost (Rs. In
Lakh)
1 Hazaribag
Hon'ble Sri Sorbh Narayan Singh,
Hazaribagh
Sadar 61 30.550
2 Hazaribag Hon'ble Sri Teklal Mahto, Mandu Mandu 123 39.630
3 Hazaribag Hon'ble Sri Yogendra Saw, Barkagoan Barkagaon 18 14.520
4 Hazaribag Hon'ble Sri Uma Shankar Akela, Barhi Barhi 25 9.870
5 Hazaribag Hon'ble Sri Amit Yadav, Barkatha Barkattha 32 13.320
6 Hazaribag Hon'ble Sri Binod Kumar Singh, Bagodar Bagodar 0 0.000
Total 259 107.890
Table 11.37: State Grants- Mukhyamantri Vikas Yojna FY 2012-2013
Sl.No. District Name of MLA
Name of
Assembly
No. of Scheme
Recommended
Estimate
Cost (Rs. In
Lakh)
1 Hazaribag Hon'ble Sri Sorbh Narayan Singh, H.bag Sadar 60 42.880
2 Hazaribag Hon'ble Sri Teklal Mahto, Mandu Mandu 26 14.630
3 Hazaribag Hon'ble Sri Yogendra Saw, Barkagoan Barkagaon 150 19.180
4 Hazaribag Hon'ble Sri Uma Shankar Akela, Barhi Barhi 210 83.670
5 Hazaribag Hon'ble Sri Amit Yadav, Barkatha Barkattha 31 33.698
Total 477 194.058
Table 11.38: State Grants- Mukhyamantri Vikas Yojna Jal Samridhi Fy 2012-2013
Sl.No. District Name of MLA
Name of
Assembly
No. of Scheme
Recommended
Estimate
Cost (Rs. In
Lakh)
1 Hazaribag
Hon'ble Sri Sorbh Narayan Singh,
Hazaribagh
Sadar 40 4.650
2 Hazaribag Hon'ble Sri Teklal Mahto, Mandu Mandu 10 0.500
3 Hazaribag Hon'ble Sri Yogendra Saw, Barkagoan Barkagaon 16 0.000
4 Hazaribag Hon'ble Sri Uma Shankar Akela, Barhi Barhi 90 12.860
5 Hazaribag Hon'ble Sri Amit Yadav, Barkatha Barkattha 36 7.200
Total 192 25.210
34. Development And Finance, Hazaribagh Development Plan 34
MASTER OF CITY PLANNING (2013-15), DEPT. OF ARCHITECTURE & REGIONAL PLANNING, IIT KHARAGPUR
Table 11.39: State Grants- MLA Scheme FY 2013-2014
Sl.No. Districtt Name of MLA
Name of
Assembly
No. of Scheme
Recommended
Estimate
Cost (Rs. In
Lakh)
1 Hazaribag
Hon'ble Sri Sorbh Narayan
Singh, H.bag
Sadar 172 171.336
2 Hazaribag
Hon'ble Sri Jay Prakash Bhai
Patel, Mandu
Mandu 239 116.610
3 Hazaribag
Hon'ble Sri Yogendra Saw,
Barkagoan
Barkagaon 198 142.625
4 Hazaribag
Hon'ble Sri Uma Shankar
Akela, Barhi
Barhi 130 163.422
5 Hazaribag
Hon'ble Sri Amit Yadav,
Barkatha
Barkattha 175 173.112
6 Hazaribag
Hon'ble Sri Binod Kumar
Singh, Bagodar
Bagodar 6 2.320
Total 920 769.425
Table 11.40: State Grants- MLA Lok Jansamridhi Scheme FY 2013-2014
Sl.No. District Name of MLA
Name of
Assembly
No. of Scheme
Recommended
Estimate
Cost (Rs. In
Lakh)
1 Hazaribag
Hon'ble Sri Sorbh Narayan
Singh, hazaribagh
Sadar 130 42.630
2 Hazaribag
Hon'ble Sri Jay Prakash Bhai
Patel, Mandu
Mandu 309 36.230
3 Hazaribag
Hon'ble Sri Yogendra Saw,
Barkagoan
Barkagaon 109 18.663
4 Hazaribag
Hon'ble Sri Uma Shankar
Akela, Barhi
Barhi 136 23.650
5 Hazaribag
Hon'ble Sri Amit Yadav,
Barkatha
Barkattha 230 21.356
6 Hazaribag
Hon'ble Sri Binod Kumar
Singh, Bagodar
Bagodar 0 0.000
Total 914 142.529
35. Development And Finance, Hazaribagh Development Plan 35
MASTER OF CITY PLANNING (2013-15), DEPT. OF ARCHITECTURE & REGIONAL PLANNING, IIT KHARAGPUR
Table 11.41: State Grants- Mukhyamantri Vikas Yojna FY 2013-2014
Sl.No. District Name of MLA
Name of
Assembly
No. of Scheme
Recommended
Estimate
Cost (Rs. In
Lakh)
1 Hazaribag
Hon'ble Sri Sorbh Narayan
Singh, Hazaribagh
Sadar 119 87.650
2 Hazaribag
Hon'ble Sri Jay Prakash Bhai
Patel, Mandu
Mandu 198 52.770
3 Hazaribag
Hon'ble Sri Yogendra Saw,
Barkagoan
Barkagaon 145 71.680
4 Hazaribag
Hon'ble Sri Uma Shankar
Akela, Barhi
Barhi 96 56.370
5 Hazaribag
Hon'ble Sri Amit Yadav,
Barkatha
Barkattha 163 94.350
Total 721 362.820
Table 11.42: State Grants- Mukhyamantri Vikas Yojna Jal Samridhi FY 2013-2014
Sl.No. District Name of MLA
Name of
Assembly
No. of Scheme
Recommended
Estimate
Cost (Rs. In
Lakh)
1 Hazaribag
Hon'ble Sri Sorbh Narayan
Singh, H.bag
Sadar 115 42.980
2 Hazaribag
Hon'ble Sri Jay Prakash Bhai
Patel, Mandu
Mandu 79 12.720
3 Hazaribag
Hon'ble Sri Yogendra Saw,
Barkagoan
Barkagaon 84 21.630
4 Hazaribag
Hon'ble Sri Uma Shankar
Akela, Barhi
Barhi 17 6.310
5 Hazaribag
Hon'ble Sri Amit Yadav,
Barkatha
Barkattha 69 12.850
Total 364 96.490
Figure 11.13: Share of Projects in MLA LAD
36. Development And Finance, Hazaribagh Development Plan 36
MASTER OF CITY PLANNING (2013-15), DEPT. OF ARCHITECTURE & REGIONAL PLANNING, IIT KHARAGPUR
Figure 11.14: Share of Projects in Mukhyamantri Vikas Yojna
61
67
41
12
20
8
27
40 54
48
3
7
15
62 12
19 25
8
1
1
23
0
20
40
60
80
2009-2010 2010-2011 2011-2012 2012-2013 2013-2014
Yearwise % fund share of project
Water Supply Road Sanitation
Construction Health Street Lights
37. Development And Finance, Hazaribagh Development Plan 37
MASTER OF CITY PLANNING (2013-15), DEPT. OF ARCHITECTURE & REGIONAL PLANNING, IIT KHARAGPUR
11.11.6.1 Comparison of Funds Received vs Fund Utilized
Figure 11.15: Grant Received vs Grant Spent
41.31
28.31 33.92
26.17
75.62
66.01 63.68
81.24
0
20
40
60
80
100
MLA CM Gen MLA Jal CM Jal
2012-2013 2013-2014
11.11.7 Inference
Mismanagement of grants and monitoring regarding projects’ targeted & achieved performance
11.11.8 Central Grants – MP LAD Scheme
Table 11.43: Details of Projects under MP LAD
YEAR
WORKS RECOMMENDED WORKS SACTIONED WORKS COMPLETED
Number Estimated Cost Number Estimated Cost Number Actual Cost
2009-2010 19 66.920 14 55.240 14 55.24
2010-2011 352 431.140 214 219.770 203 181.80
2011-2012 587 1047.210 289 366.410 246 178.50
2012-2013 65 145.000 299 506.410 185 166.34
2013-2014 179 385.000 306 531.970 38 83.54
TOTAL 1202 2075.270 1122 1679.800 686 665.420
38. Development And Finance, Hazaribagh Development Plan 38
MASTER OF CITY PLANNING (2013-15), DEPT. OF ARCHITECTURE & REGIONAL PLANNING, IIT KHARAGPUR
11.11.8.1 Project Shares under MP LAD in Various Years
Figure 11.17: Project Shares under MP LAD in Various Years
8%
61%
23%
8%
Project Share 2009-2010
19
352
587
65
14
214
289
299
14
203
162
78
0
100
200
300
400
500
600
700
(2009-10) (2010-11) (2011-12) (2012-13)
Details of the project-works-MPLAD
Works Recommended Works Sanctioned Works Completed
27%
67%
1%
2%
3% Project Share 2010-2011
Road
Water Supply
Health
Construction
Figure 11.16: Details of MP LAD
39. Development And Finance, Hazaribagh Development Plan 39
MASTER OF CITY PLANNING (2013-15), DEPT. OF ARCHITECTURE & REGIONAL PLANNING, IIT KHARAGPUR
20%
48%
6%
25%
1% Project Share 2013-2014
Inferences:
Proper financing in various sectors (economy, physical infrastructure, social infrastructure,
transportation, etc.)
Lack of basic services for urban poor & poor living conditions
Nonexistence of notified slum.
12%
40%
41%
7%
Project Share 2011-2012
54%
19%
15%
12%
Project Share 2012-2013
Road
Construction
Sanitation &
Drainange
Water Supply
40. Development And Finance, Hazaribagh Development Plan 40
MASTER OF CITY PLANNING (2013-15), DEPT. OF ARCHITECTURE & REGIONAL PLANNING, IIT KHARAGPUR
11.12NGOs IN HAZARIBAGH
Figure 11.18: NGO Details
Table 11.44: Segment wise NGO Details
Employment Environment
Human
Rights
Health
Family
welfare
Tribal
Affairs
Animal
Husbandry
Fishing MSME
Rural
development
28 26 31 30 30 10 26 26 29 16