SlideShare a Scribd company logo
1 of 45
© 2 0 2 0 S P L U N K I N C .
The Top 10
Glasstable Design
Principles to Boost
Your Career and
Your Business
In order to avoid this
Stephane Estevez
Product Marketing Director EMEA, IT Markets | Splunk
During the course of this presentation, we may make forward‐looking statements regarding
future events or plans of the company. We caution you that such statements reflect our
current expectations and estimates based on factors currently known to us and that actual
events or results may differ materially. The forward-looking statements made in the this
presentation are being made as of the time and date of its live presentation. If reviewed after
its live presentation, it may not contain current or accurate information. We do not assume
any obligation to update any forward‐looking statements made herein.
In addition, any information about our roadmap outlines our general product direction and is
subject to change at any time without notice. It is for informational purposes only, and shall
not be incorporated into any contract or other commitment. Splunk undertakes no obligation
either to develop the features or functionalities described or to include any such feature or
functionality in a future release.
Splunk, Splunk>, Data-to-Everything, D2E, and Turn Data Into Doing are trademarks and registered trademarks of Splunk Inc. in the United States
and other countries. All other brand names, product names, or trademarks belong to their respective owners. © 2020 Splunk Inc. All rights reserved.
Forward-
Looking
Statements
© 2 0 2 0 S P L U N K I N C .
TBD Product Marketing Director EMEA,
IT Markets | Splunk
Wine addict, guitar addict, product marketing addict
Stephane Estevez
Senior Sales Engineer | Splunk
xx addict, xx addict, xxxaddict
TBD
© 2 0 2 0 S P L U N K I N C .
Today’s Scope
© 2 0 2 0 S P L U N K I N C .
Deliver data and insights to every
business and IT function
Turn Data into Doing,
Everywhere in IT
© 2 0 2 0 S P L U N K I N C .
Turn Data into Doing, Everywhere in IT
See the Bigger Picture
with a unified experience for all of your teams across
all of your services, applications, and infrastructure.
Create Insights Across Silos
when you bring together data from every team and
tool to drive real-time visualizations of the metrics
and KPIs that matter most.
Empower Teams with Powerful Tools
that provide productive and efficient workspaces,
automation, and alerts, so your teams can deliver
the experiences customers demand.
Deliver data and insights to every business and IT function
© 2 0 2 0 S P L U N K I N C .
Make the Shift to Predictive IT
Find Problems Even Faster
with machine learning-powered Service Analyzer tree
to leverage the right data and determine root cause.
Solve Problems in Record Time
with Event Management to cluster events, reduce
noise, and helping the right teams focus on only what
is most important.
Predict Problems in Advance
with KPI Predictions and Predictive Cause Analysis,
trending data across services, apps, and infrastructure
so you can prevent outages before they have impact.
With Splunk ITSI, you can predict and prevent problems before they have impact
© 2 0 2 0 S P L U N K I N C .
Lack of design Applying basic design principles
If you want your career to take off, demonstrate that you
don’t need to be a data scientist to be effective. Embracing
data visualization and predictive analytics to communicate
imaginative business intelligence can propel your career.
—PwC
Glass Table Design Can Have the Same
Effect on Your Boss as on Phoebe.
“
© 2 0 2 0 S P L U N K I N C .
Data Visualization
Definition & History
© 2 0 2 0 S P L U N K I N C .
Data visualization is the practice of converting data
from raw figures into a graphical representation such
as maps, graphs, charts, and complex dashboards.”
Definition
“
© 2 0 2 0 S P L U N K I N C .
A Little Bit of History
2nd Cent CE
People start
arranging data into
tables (columns
and rows)
1160 BC
First documented data
visualization
Turin Papyrus Map
illustrates the distribution
of geological resources
and provides information
about quarrying of those
resources.
14,500 BC
First Star Map
Lascaux
painted
caves
17th Century
The idea of representing
quantitative information
graphically arise
Thank you Mr. René
Descartes, for the two-
dimensional coordinate
system for displaying
values
18th Century
Charts created
Thank you William Playfair
for exploiting the potential
of graphics for the
communication of
quantitative data.
He create a line moving up
and down from left to right
to show how values
changed through time (and
the bar and pie charts…)
©W.Playfair1786
2020+
Data Journalism,
‘Citizen Data
Scientists’…
Words meets numbers.
Complex things are
explained using simple
and engaging stories.
©Gartner
© 2 0 2 0 S P L U N K I N C .
Data Viz Becomes Mainstream
We are creating new
ways of converting
data into graphical
representations
Source : http://datavis.ca/milestones/
© 2 0 2 0 S P L U N K I N C .
How Meaningful is
Data Visualization?
© 2 0 2 0 S P L U N K I N C .
Human Cognition and Data Visualization
Data visualization has been created for human consumption,
so understanding human perception and cognition is key.
Human brains have a much harder time understanding
complex data when it is encoded in numbers and text
compared to graphics.
But human vision can “understand” an image in 13 ms and
process hit while the next image is displayed (source:
M.Potter-MIT).
Visually displayed (using graphs, shapes, color,
orientation…), data is easier to grasp and analyze, making it
faster for decision makers to find patterns, including new and
hidden, and to understand even difficult concepts.
© 2 0 2 0 S P L U N K I N C .
Time for the
Top 10 Principles
© 2 0 2 0 S P L U N K I N C .
Principle #1
Glass Tables & dashboards are not reports
© 2 0 2 0 S P L U N K I N C .
Glass Tables and Dashboards
are NOT Reports
Reports Glass Tables
Type of data As much as you can Most important data
Realtime No Yes
Presentation Detailed Consolidated
Format Static Dynamic
Allows quick action No Yes
Ease of use Complex Simple and easy
1
© 2 0 2 0 S P L U N K I N C .
Principle #2
Start with paper!
© 2 0 2 0 S P L U N K I N C .
Define your audience and understand user requirements
• What information do you need from me?
• What form do you need it in?
• What do you need or want to understand about this data?
Content
• Keep it relevant. Less really is more.
• Avoid overdesigning.
• Use iconography. Content isn’t limited to text and charts.
2 Start with Paper
© 2 0 2 0 S P L U N K I N C .
Principle #3
Colors and fonts matter
© 2 0 2 0 S P L U N K I N C .
• Stick to 1 font
• No more than 3 sizes
• Need to create visual hierarchy? Bold it or add an accent color
(if everything’s bold, nothing is)
• Use Serif fonts for body text (easier to read for longer text)
• Use sans-serif for headlines, short blocks of text
Fonts matterColors matter• Choose few and stick to them (but play with gradients)
• Leverage contrast (use the Adobe Color wheel http://color.adobe.com)
• Use color sparingly (each color serve a particular communication goal)
• Pay attention to meaning – bad kind of bad good
• Adapt colors to your audience culture
(death=black in western countries, death=white in asia)
• If using colors, make sure the background color is consistent
(make color changes more obvious)
Colors and Fonts Matter3
© 2 0 2 0 S P L U N K I N C .
Principle #4
Choose the right visualization for the right data
© 2 0 2 0 S P L U N K I N C .
Data Visualization
Not all charts are created equal.
Looking good ≠ ease of understanding.
Effective visualizations enables the audience to easily
comprehend more data in less time.
(choose the right representation of data)
4
© 2 0 2 0 S P L U N K I N C .
Visualizations
0
2
4
6
47%
29%
13%
11%
GaugesPie chartLine chart
/ Sparkline (condensed)
4.3
2.4
2
Bar chart
0
20
40
60
Stacked area
chart
Title 1 Title 2 Title 3
Item 1 Item 3 Item 5
Item 2 Item 4 Item 6
Tabular format
+
-
Best used when
exact quantities
of numbers must
be known
Not conducive to
finding trends
and comparing
sets of data
Best used when
trying to visualize
continuous data
over time
Best used when
showing
comparisons
between categories
or items in the
same category
Best used to
compare parts
to the whole
Makes
comparison of
pie slice size
difficult. Not
great if less than
3 or more than 6
categories
Best used for
showing
cumulated totals
over time via
numbers or
percentages
Best used to show a
range ideal when
you have an
absolute floor//
ceiling value
Takes valuable
space with
limited
information
(single
dimension)
Less effective then
line chart when
trying to show
trends over time
If consistent scales
on the axis aren’t
used, it might lead
to the data of a line
graph appearing
inaccurate.
Users yes tend
to focus on the
tops of each line,
leading to
misinterpreting
the patterns.
0
1
2
3
4
0 1 2 3
Scatter chart
Best for showing
the overall
relationship in a
large amount of
data
Limited to two
variables, they
are unable to
give the exact
extent of
correlation
© 2 0 2 0 S P L U N K I N C .
Visualization Tips
2.4
4.3
2
0
2
4
6
Category 1
Chart Title
Series 1 Series 2 Series 3
5.2, 16%
3.2, 10%
1.4, 4%
1.2, 4%
5, 16%4.1, 13%
0.5, 1%
8, 25%
3.4, 11%
Sales
year 1 year 2 year 3 year 4 year 5
year 6 year 7 year 8 year 9
X
X
Reduce Chart-junk and
Increase Data-to-ink Ratio
Comparison
Static
Over Time
4.3
2.4
2
Category 1
0
2
4
6
Line chartLine chart (several items)
Bar chartColumn chart
0
2
4
6
4.3
2.4
2
Pie chart
Composition
Static
Over Time
year 1 year 2 year 3 year 4
Stacked column chart Staked area chart
47%
29%
13%
11%
0
20
40
60
© 2 0 2 0 S P L U N K I N C .
Principle #5
Follow the eyes
© 2 0 2 0 S P L U N K I N C .
Follow the Eyes
But remember principle #2: Know your audience
• Some languages uses right to left scripts (Arabic, Hebrew, Kurdish…)
• Some are even more complex (flexible) like ideographic languages
(Chinese, Japanese and Korean) : they can be written left to right or
vertically top to bottom (with vertical lines proceeding from right to left),
sometimes both directions can even be combined on one page.
kindle newspaper Hardcover book mobile
• They are meant to be read from left to right
and top to bottom
5
What do they have in common?
© 2 0 2 0 S P L U N K I N C .
Principle #6
Organize content blocks
© 2 0 2 0 S P L U N K I N C .
Organize Content Blocks
Hierarchy Proximity Balance
ContrastPositionSize
Shape Color Orientation
White Space
6
© 2 0 2 0 S P L U N K I N C .
Organize Content Blocks
Hierarchy Proximity Balance
ContrastPositionSize
Shape Color Orientation
© 2 0 2 0 S P L U N K I N C .
Principle #7
The power of diagrams and flows
© 2 0 2 0 S P L U N K I N C .
Need to emphasize a new process?
Do not underestimate the power of the glass table
• Glass tables can be a good way to “push” for a new process
• Draw you process as a glass table background and add KPIs to it
• A great way to get your teams look at the process every day !
The Power of Diagrams and Flows
(Let’s do some basic internal politics  )
7
© 2 0 2 0 S P L U N K I N C .
Principle #8
Use the dramatic approach when needed
© 2 0 2 0 S P L U N K I N C .
Alerts and Dashboard
(Sometimes clean isn’t enough; a more dramatic approach is needed)
Shift the focus from the full data to changes in the most critical data points.
By pulling out the important exceptions, you can make it easier for your audience
to digest what matters and take action.
Alerts are one mechanism to turn the focus to the exceptions, outliers and
data highlights.
4 C’s:
Context:
Users need to
understand how an
alert is defined and
how it fits into the larger
picture.
Cogency:
An alerting system
needs to avoid causing
unnecessary alarm
while delivering easy-to-
understand information
that can be acted upon.
Communication:
Alerts must be
designed to effectively
capture attention and
inform.
Control:
Advanced alert
system should give
users the ability to
customize and manage
alerts.
8
© 2 0 2 0 S P L U N K I N C .
Principle #9
Use simple tools like PowerPoint (or equivalent)
and an image search engine (Google, Qwant…)
© 2 0 2 0 S P L U N K I N C .
How to Create a Background Image for Your Glass Table
Step 1: Design it in PowerPoint using Google/Qwant… or any other image search engine
Shapes and icons
Search for
PNGs —
transparent
images
(labeled for re
use or ask your
marketing team)
9
© 2 0 2 0 S P L U N K I N C .
Right click on shape
How to Create a Background Image for Your Glass Table
Step 1: Design it in PowerPoint using Google/Qwant… or any other image search engine
© 2 0 2 0 S P L U N K I N C .
How to Create a Background Image
for Your Glass Table
Delete the widgets
(will be added later on ITSI)
Export as PNG
(will be added later on ITSI as background)
© 2 0 2 0 S P L U N K I N C .
Principle #10
Be trendy
© 2 0 2 0 S P L U N K I N C .
Flat Design
Minimalist
Influenced by the International
Typographic Style and Bauhaus
Uses sans-serif typography ;)
Examples: Microsoft Metro design
language (Xbox, Office…), iOS
© 2 0 2 0 S P L U N K I N C .
“We see a growing problem with the use of color on
dashboards/glasstables these days. There’s often either too
much of it, making the dashboard visually overwhelming, or too
little of it, producing a boring dashboard. The best way to
engage users is through “colorblocking”: balancing
monochromatic background colors against bright colors
to highlight important insights or anomalies in the data.”
The exploration of taking colors that are opposites on
the color wheel and pairing them together to make
interesting and complementary color combinations.
—Wikipedia
Color-Blocking
Thank you Mr Piet Mondrian
“
© 2 0 2 0 S P L U N K I N C .
A technique likely to become more
popular in the near future
The overlapping effect consists of
colors, text or image
Overlaps can create a sense of space
and a more structured interface
Gradients add realism and depth to
the platform (feels more natural)
Landing page by Saepul Rohman
Overlapping
© 2 0 2 0 S P L U N K I N C .
99/100
12/121/1
0/52
21/21
354
1324
2546
12546
Trans/site
Paris Los Angeles Sidney Cape Town New York
0
100
200
300
400
500
600
1pm 2pm 3pm 4pm
Response time
834.3 320%
Avg response time
APIGateway
$9.5 5126%
$4.23%
-7%
128-12%
New York
Paris
Revenue Support tickets
Enterprise Service Bus
Batch
Micro-srv B
Micro-srv A
Legacy Storage
Cloud API
SAP Storage
Mainframe
© 2 0 2 0 S P L U N K I N C .
You!
Thank
© 2 0 2 0 S P L U N K I N C .
Q&A

More Related Content

What's hot

Machine Learning and Social Good
Machine Learning and Social GoodMachine Learning and Social Good
Machine Learning and Social GoodSplunk
 
Manufacturing Webinar AMS
Manufacturing Webinar AMSManufacturing Webinar AMS
Manufacturing Webinar AMSSplunk
 
Do You Really Need to Evolve From Monitoring to Observability?
Do You Really Need to Evolve From Monitoring to Observability?Do You Really Need to Evolve From Monitoring to Observability?
Do You Really Need to Evolve From Monitoring to Observability?Splunk
 
SplunkLive! Utrecht 2019: NXP
SplunkLive! Utrecht 2019: NXP SplunkLive! Utrecht 2019: NXP
SplunkLive! Utrecht 2019: NXP Splunk
 
SplunkLive! Utrecht 2019: KPN
SplunkLive! Utrecht 2019: KPN SplunkLive! Utrecht 2019: KPN
SplunkLive! Utrecht 2019: KPN Splunk
 
Extending Splunk to Business Use Cases With Automated Process Mining
Extending Splunk to Business Use Cases With Automated Process MiningExtending Splunk to Business Use Cases With Automated Process Mining
Extending Splunk to Business Use Cases With Automated Process MiningSplunk
 
Security Automation & Orchestration
Security Automation & OrchestrationSecurity Automation & Orchestration
Security Automation & OrchestrationSplunk
 
Better Threat Analytics: From Getting Started to Cloud Security Analytics and...
Better Threat Analytics: From Getting Started to Cloud Security Analytics and...Better Threat Analytics: From Getting Started to Cloud Security Analytics and...
Better Threat Analytics: From Getting Started to Cloud Security Analytics and...Splunk
 
IoT Analytics @ splunk
IoT Analytics @ splunkIoT Analytics @ splunk
IoT Analytics @ splunkSplunk
 
Splunk Artificial Intelligence & Machine Learning Webinar
Splunk Artificial Intelligence & Machine Learning WebinarSplunk Artificial Intelligence & Machine Learning Webinar
Splunk Artificial Intelligence & Machine Learning WebinarSplunk
 
The Risks and Rewards of AI
The Risks and  Rewards of AIThe Risks and  Rewards of AI
The Risks and Rewards of AISplunk
 
Three Pillars, No Answers: Helping Platform Teams Solve Real Observability Pr...
Three Pillars, No Answers: Helping Platform Teams Solve Real Observability Pr...Three Pillars, No Answers: Helping Platform Teams Solve Real Observability Pr...
Three Pillars, No Answers: Helping Platform Teams Solve Real Observability Pr...DevOps.com
 
How to justify the economic value of your data investment
How to justify the economic value of your data investmentHow to justify the economic value of your data investment
How to justify the economic value of your data investmentSplunk
 
Splunk4Leaders
Splunk4Leaders Splunk4Leaders
Splunk4Leaders Splunk
 
SplunkLive! Stockholm 2019 - Customer presentation: ISS
SplunkLive! Stockholm 2019 - Customer presentation: ISS SplunkLive! Stockholm 2019 - Customer presentation: ISS
SplunkLive! Stockholm 2019 - Customer presentation: ISS Splunk
 
.conf21 - The Best of
.conf21 - The Best of.conf21 - The Best of
.conf21 - The Best ofSplunk
 
Best Practices for Forwarder Hierarchies
Best Practices for Forwarder HierarchiesBest Practices for Forwarder Hierarchies
Best Practices for Forwarder HierarchiesSplunk
 
SplunkLive! Stockholm 2019 - Customer presentation: Norlys
SplunkLive! Stockholm 2019 - Customer presentation: Norlys SplunkLive! Stockholm 2019 - Customer presentation: Norlys
SplunkLive! Stockholm 2019 - Customer presentation: Norlys Splunk
 
Worst Splunk practices...and how to fix them
Worst Splunk practices...and how to fix them Worst Splunk practices...and how to fix them
Worst Splunk practices...and how to fix them Splunk
 
Spliunk Discovery Köln - 17-01-2020 - Intro to Security Analytics Methods
Spliunk Discovery Köln - 17-01-2020 - Intro to Security Analytics MethodsSpliunk Discovery Köln - 17-01-2020 - Intro to Security Analytics Methods
Spliunk Discovery Köln - 17-01-2020 - Intro to Security Analytics MethodsSplunk
 

What's hot (20)

Machine Learning and Social Good
Machine Learning and Social GoodMachine Learning and Social Good
Machine Learning and Social Good
 
Manufacturing Webinar AMS
Manufacturing Webinar AMSManufacturing Webinar AMS
Manufacturing Webinar AMS
 
Do You Really Need to Evolve From Monitoring to Observability?
Do You Really Need to Evolve From Monitoring to Observability?Do You Really Need to Evolve From Monitoring to Observability?
Do You Really Need to Evolve From Monitoring to Observability?
 
SplunkLive! Utrecht 2019: NXP
SplunkLive! Utrecht 2019: NXP SplunkLive! Utrecht 2019: NXP
SplunkLive! Utrecht 2019: NXP
 
SplunkLive! Utrecht 2019: KPN
SplunkLive! Utrecht 2019: KPN SplunkLive! Utrecht 2019: KPN
SplunkLive! Utrecht 2019: KPN
 
Extending Splunk to Business Use Cases With Automated Process Mining
Extending Splunk to Business Use Cases With Automated Process MiningExtending Splunk to Business Use Cases With Automated Process Mining
Extending Splunk to Business Use Cases With Automated Process Mining
 
Security Automation & Orchestration
Security Automation & OrchestrationSecurity Automation & Orchestration
Security Automation & Orchestration
 
Better Threat Analytics: From Getting Started to Cloud Security Analytics and...
Better Threat Analytics: From Getting Started to Cloud Security Analytics and...Better Threat Analytics: From Getting Started to Cloud Security Analytics and...
Better Threat Analytics: From Getting Started to Cloud Security Analytics and...
 
IoT Analytics @ splunk
IoT Analytics @ splunkIoT Analytics @ splunk
IoT Analytics @ splunk
 
Splunk Artificial Intelligence & Machine Learning Webinar
Splunk Artificial Intelligence & Machine Learning WebinarSplunk Artificial Intelligence & Machine Learning Webinar
Splunk Artificial Intelligence & Machine Learning Webinar
 
The Risks and Rewards of AI
The Risks and  Rewards of AIThe Risks and  Rewards of AI
The Risks and Rewards of AI
 
Three Pillars, No Answers: Helping Platform Teams Solve Real Observability Pr...
Three Pillars, No Answers: Helping Platform Teams Solve Real Observability Pr...Three Pillars, No Answers: Helping Platform Teams Solve Real Observability Pr...
Three Pillars, No Answers: Helping Platform Teams Solve Real Observability Pr...
 
How to justify the economic value of your data investment
How to justify the economic value of your data investmentHow to justify the economic value of your data investment
How to justify the economic value of your data investment
 
Splunk4Leaders
Splunk4Leaders Splunk4Leaders
Splunk4Leaders
 
SplunkLive! Stockholm 2019 - Customer presentation: ISS
SplunkLive! Stockholm 2019 - Customer presentation: ISS SplunkLive! Stockholm 2019 - Customer presentation: ISS
SplunkLive! Stockholm 2019 - Customer presentation: ISS
 
.conf21 - The Best of
.conf21 - The Best of.conf21 - The Best of
.conf21 - The Best of
 
Best Practices for Forwarder Hierarchies
Best Practices for Forwarder HierarchiesBest Practices for Forwarder Hierarchies
Best Practices for Forwarder Hierarchies
 
SplunkLive! Stockholm 2019 - Customer presentation: Norlys
SplunkLive! Stockholm 2019 - Customer presentation: Norlys SplunkLive! Stockholm 2019 - Customer presentation: Norlys
SplunkLive! Stockholm 2019 - Customer presentation: Norlys
 
Worst Splunk practices...and how to fix them
Worst Splunk practices...and how to fix them Worst Splunk practices...and how to fix them
Worst Splunk practices...and how to fix them
 
Spliunk Discovery Köln - 17-01-2020 - Intro to Security Analytics Methods
Spliunk Discovery Köln - 17-01-2020 - Intro to Security Analytics MethodsSpliunk Discovery Köln - 17-01-2020 - Intro to Security Analytics Methods
Spliunk Discovery Köln - 17-01-2020 - Intro to Security Analytics Methods
 

Similar to The Top 10 Glasstable Design Principles to Boost Your Career and Your Business

What is data visualization
What is data visualizationWhat is data visualization
What is data visualizationintellect808
 
Creating Effective Visuals for Teaching and Presentation
Creating Effective Visuals for Teaching and PresentationCreating Effective Visuals for Teaching and Presentation
Creating Effective Visuals for Teaching and PresentationKristen Sosulski
 
Tableau Tutorial Complete by Rohit Dubey
Tableau Tutorial Complete by Rohit DubeyTableau Tutorial Complete by Rohit Dubey
Tableau Tutorial Complete by Rohit Dubeykiranrajat
 
Making Data Meaningful
Making Data MeaningfulMaking Data Meaningful
Making Data MeaningfulAmanda Makulec
 
Excellence in visulization
Excellence in visulizationExcellence in visulization
Excellence in visulizationArchanaMani2
 
Tableau Visual Guidebook
Tableau Visual GuidebookTableau Visual Guidebook
Tableau Visual GuidebookAndy Kriebel
 
Visual Analytics in Big Data
Visual Analytics in Big DataVisual Analytics in Big Data
Visual Analytics in Big DataSaurabh Shanbhag
 
Making Data Meaningful
Making Data MeaningfulMaking Data Meaningful
Making Data MeaningfulJSI
 
Creating Functional Art in Excel
Creating Functional Art in ExcelCreating Functional Art in Excel
Creating Functional Art in ExcelAmanda Makulec
 
BigData Visualization and Usecase@TDGA-Stelligence-11july2019-share
BigData Visualization and Usecase@TDGA-Stelligence-11july2019-shareBigData Visualization and Usecase@TDGA-Stelligence-11july2019-share
BigData Visualization and Usecase@TDGA-Stelligence-11july2019-sharestelligence
 
Data visualisation
Data visualisationData visualisation
Data visualisationDivek Bhatia
 
Dashboards- Take a closer look at your data
Dashboards- Take a closer look at your dataDashboards- Take a closer look at your data
Dashboards- Take a closer look at your dataNathan Watson
 
IBM Business Analytics Dashboarding Tips > Cresco International
IBM Business Analytics Dashboarding Tips > Cresco International IBM Business Analytics Dashboarding Tips > Cresco International
IBM Business Analytics Dashboarding Tips > Cresco International Cresco International
 
Copyright © 2014 EMC Corporation. All rights reserved.Copy.docx
Copyright © 2014 EMC Corporation. All rights reserved.Copy.docxCopyright © 2014 EMC Corporation. All rights reserved.Copy.docx
Copyright © 2014 EMC Corporation. All rights reserved.Copy.docxdickonsondorris
 
The Gauge & Widget Advantage for your Dashboard
The Gauge & Widget Advantage for your DashboardThe Gauge & Widget Advantage for your Dashboard
The Gauge & Widget Advantage for your DashboardFusionCharts
 
Martin Lander 14 Resit Project – Globally Conscious Engineer .docx
Martin Lander 14  Resit Project – Globally Conscious Engineer .docxMartin Lander 14  Resit Project – Globally Conscious Engineer .docx
Martin Lander 14 Resit Project – Globally Conscious Engineer .docxinfantsuk
 

Similar to The Top 10 Glasstable Design Principles to Boost Your Career and Your Business (20)

Insights From Data Visualization - Stephen Lett (Procter & Gamble)
Insights From Data Visualization - Stephen Lett (Procter & Gamble)Insights From Data Visualization - Stephen Lett (Procter & Gamble)
Insights From Data Visualization - Stephen Lett (Procter & Gamble)
 
What is data visualization
What is data visualizationWhat is data visualization
What is data visualization
 
Design for Delight
Design for DelightDesign for Delight
Design for Delight
 
Creating Effective Visuals for Teaching and Presentation
Creating Effective Visuals for Teaching and PresentationCreating Effective Visuals for Teaching and Presentation
Creating Effective Visuals for Teaching and Presentation
 
Tableau Tutorial Complete by Rohit Dubey
Tableau Tutorial Complete by Rohit DubeyTableau Tutorial Complete by Rohit Dubey
Tableau Tutorial Complete by Rohit Dubey
 
Making Data Meaningful
Making Data MeaningfulMaking Data Meaningful
Making Data Meaningful
 
Excellence in visulization
Excellence in visulizationExcellence in visulization
Excellence in visulization
 
Tableau Visual Guidebook
Tableau Visual GuidebookTableau Visual Guidebook
Tableau Visual Guidebook
 
Visual Analytics in Big Data
Visual Analytics in Big DataVisual Analytics in Big Data
Visual Analytics in Big Data
 
DATA VISUALIZATION
DATA VISUALIZATIONDATA VISUALIZATION
DATA VISUALIZATION
 
Making Data Meaningful
Making Data MeaningfulMaking Data Meaningful
Making Data Meaningful
 
Creating Functional Art in Excel
Creating Functional Art in ExcelCreating Functional Art in Excel
Creating Functional Art in Excel
 
BigData Visualization and Usecase@TDGA-Stelligence-11july2019-share
BigData Visualization and Usecase@TDGA-Stelligence-11july2019-shareBigData Visualization and Usecase@TDGA-Stelligence-11july2019-share
BigData Visualization and Usecase@TDGA-Stelligence-11july2019-share
 
Data visualisation
Data visualisationData visualisation
Data visualisation
 
Data visualisation
Data visualisation Data visualisation
Data visualisation
 
Dashboards- Take a closer look at your data
Dashboards- Take a closer look at your dataDashboards- Take a closer look at your data
Dashboards- Take a closer look at your data
 
IBM Business Analytics Dashboarding Tips > Cresco International
IBM Business Analytics Dashboarding Tips > Cresco International IBM Business Analytics Dashboarding Tips > Cresco International
IBM Business Analytics Dashboarding Tips > Cresco International
 
Copyright © 2014 EMC Corporation. All rights reserved.Copy.docx
Copyright © 2014 EMC Corporation. All rights reserved.Copy.docxCopyright © 2014 EMC Corporation. All rights reserved.Copy.docx
Copyright © 2014 EMC Corporation. All rights reserved.Copy.docx
 
The Gauge & Widget Advantage for your Dashboard
The Gauge & Widget Advantage for your DashboardThe Gauge & Widget Advantage for your Dashboard
The Gauge & Widget Advantage for your Dashboard
 
Martin Lander 14 Resit Project – Globally Conscious Engineer .docx
Martin Lander 14  Resit Project – Globally Conscious Engineer .docxMartin Lander 14  Resit Project – Globally Conscious Engineer .docx
Martin Lander 14 Resit Project – Globally Conscious Engineer .docx
 

More from Splunk

.conf Go 2023 - Data analysis as a routine
.conf Go 2023 - Data analysis as a routine.conf Go 2023 - Data analysis as a routine
.conf Go 2023 - Data analysis as a routineSplunk
 
.conf Go 2023 - How KPN drives Customer Satisfaction on IPTV
.conf Go 2023 - How KPN drives Customer Satisfaction on IPTV.conf Go 2023 - How KPN drives Customer Satisfaction on IPTV
.conf Go 2023 - How KPN drives Customer Satisfaction on IPTVSplunk
 
.conf Go 2023 - Navegando la normativa SOX (Telefónica)
.conf Go 2023 - Navegando la normativa SOX (Telefónica).conf Go 2023 - Navegando la normativa SOX (Telefónica)
.conf Go 2023 - Navegando la normativa SOX (Telefónica)Splunk
 
.conf Go 2023 - Raiffeisen Bank International
.conf Go 2023 - Raiffeisen Bank International.conf Go 2023 - Raiffeisen Bank International
.conf Go 2023 - Raiffeisen Bank InternationalSplunk
 
.conf Go 2023 - På liv og død Om sikkerhetsarbeid i Norsk helsenett
.conf Go 2023 - På liv og død Om sikkerhetsarbeid i Norsk helsenett .conf Go 2023 - På liv og død Om sikkerhetsarbeid i Norsk helsenett
.conf Go 2023 - På liv og død Om sikkerhetsarbeid i Norsk helsenett Splunk
 
.conf Go 2023 - Many roads lead to Rome - this was our journey (Julius Bär)
.conf Go 2023 - Many roads lead to Rome - this was our journey (Julius Bär).conf Go 2023 - Many roads lead to Rome - this was our journey (Julius Bär)
.conf Go 2023 - Many roads lead to Rome - this was our journey (Julius Bär)Splunk
 
.conf Go 2023 - Das passende Rezept für die digitale (Security) Revolution zu...
.conf Go 2023 - Das passende Rezept für die digitale (Security) Revolution zu....conf Go 2023 - Das passende Rezept für die digitale (Security) Revolution zu...
.conf Go 2023 - Das passende Rezept für die digitale (Security) Revolution zu...Splunk
 
.conf go 2023 - Cyber Resilienz – Herausforderungen und Ansatz für Energiever...
.conf go 2023 - Cyber Resilienz – Herausforderungen und Ansatz für Energiever....conf go 2023 - Cyber Resilienz – Herausforderungen und Ansatz für Energiever...
.conf go 2023 - Cyber Resilienz – Herausforderungen und Ansatz für Energiever...Splunk
 
.conf go 2023 - De NOC a CSIRT (Cellnex)
.conf go 2023 - De NOC a CSIRT (Cellnex).conf go 2023 - De NOC a CSIRT (Cellnex)
.conf go 2023 - De NOC a CSIRT (Cellnex)Splunk
 
conf go 2023 - El camino hacia la ciberseguridad (ABANCA)
conf go 2023 - El camino hacia la ciberseguridad (ABANCA)conf go 2023 - El camino hacia la ciberseguridad (ABANCA)
conf go 2023 - El camino hacia la ciberseguridad (ABANCA)Splunk
 
Splunk - BMW connects business and IT with data driven operations SRE and O11y
Splunk - BMW connects business and IT with data driven operations SRE and O11ySplunk - BMW connects business and IT with data driven operations SRE and O11y
Splunk - BMW connects business and IT with data driven operations SRE and O11ySplunk
 
Splunk x Freenet - .conf Go Köln
Splunk x Freenet - .conf Go KölnSplunk x Freenet - .conf Go Köln
Splunk x Freenet - .conf Go KölnSplunk
 
Splunk Security Session - .conf Go Köln
Splunk Security Session - .conf Go KölnSplunk Security Session - .conf Go Köln
Splunk Security Session - .conf Go KölnSplunk
 
Data foundations building success, at city scale – Imperial College London
 Data foundations building success, at city scale – Imperial College London Data foundations building success, at city scale – Imperial College London
Data foundations building success, at city scale – Imperial College LondonSplunk
 
Splunk: How Vodafone established Operational Analytics in a Hybrid Environmen...
Splunk: How Vodafone established Operational Analytics in a Hybrid Environmen...Splunk: How Vodafone established Operational Analytics in a Hybrid Environmen...
Splunk: How Vodafone established Operational Analytics in a Hybrid Environmen...Splunk
 
SOC, Amore Mio! | Security Webinar
SOC, Amore Mio! | Security WebinarSOC, Amore Mio! | Security Webinar
SOC, Amore Mio! | Security WebinarSplunk
 
.conf Go 2022 - Observability Session
.conf Go 2022 - Observability Session.conf Go 2022 - Observability Session
.conf Go 2022 - Observability SessionSplunk
 
.conf Go Zurich 2022 - Keynote
.conf Go Zurich 2022 - Keynote.conf Go Zurich 2022 - Keynote
.conf Go Zurich 2022 - KeynoteSplunk
 
.conf Go Zurich 2022 - Platform Session
.conf Go Zurich 2022 - Platform Session.conf Go Zurich 2022 - Platform Session
.conf Go Zurich 2022 - Platform SessionSplunk
 
.conf Go Zurich 2022 - Security Session
.conf Go Zurich 2022 - Security Session.conf Go Zurich 2022 - Security Session
.conf Go Zurich 2022 - Security SessionSplunk
 

More from Splunk (20)

.conf Go 2023 - Data analysis as a routine
.conf Go 2023 - Data analysis as a routine.conf Go 2023 - Data analysis as a routine
.conf Go 2023 - Data analysis as a routine
 
.conf Go 2023 - How KPN drives Customer Satisfaction on IPTV
.conf Go 2023 - How KPN drives Customer Satisfaction on IPTV.conf Go 2023 - How KPN drives Customer Satisfaction on IPTV
.conf Go 2023 - How KPN drives Customer Satisfaction on IPTV
 
.conf Go 2023 - Navegando la normativa SOX (Telefónica)
.conf Go 2023 - Navegando la normativa SOX (Telefónica).conf Go 2023 - Navegando la normativa SOX (Telefónica)
.conf Go 2023 - Navegando la normativa SOX (Telefónica)
 
.conf Go 2023 - Raiffeisen Bank International
.conf Go 2023 - Raiffeisen Bank International.conf Go 2023 - Raiffeisen Bank International
.conf Go 2023 - Raiffeisen Bank International
 
.conf Go 2023 - På liv og død Om sikkerhetsarbeid i Norsk helsenett
.conf Go 2023 - På liv og død Om sikkerhetsarbeid i Norsk helsenett .conf Go 2023 - På liv og død Om sikkerhetsarbeid i Norsk helsenett
.conf Go 2023 - På liv og død Om sikkerhetsarbeid i Norsk helsenett
 
.conf Go 2023 - Many roads lead to Rome - this was our journey (Julius Bär)
.conf Go 2023 - Many roads lead to Rome - this was our journey (Julius Bär).conf Go 2023 - Many roads lead to Rome - this was our journey (Julius Bär)
.conf Go 2023 - Many roads lead to Rome - this was our journey (Julius Bär)
 
.conf Go 2023 - Das passende Rezept für die digitale (Security) Revolution zu...
.conf Go 2023 - Das passende Rezept für die digitale (Security) Revolution zu....conf Go 2023 - Das passende Rezept für die digitale (Security) Revolution zu...
.conf Go 2023 - Das passende Rezept für die digitale (Security) Revolution zu...
 
.conf go 2023 - Cyber Resilienz – Herausforderungen und Ansatz für Energiever...
.conf go 2023 - Cyber Resilienz – Herausforderungen und Ansatz für Energiever....conf go 2023 - Cyber Resilienz – Herausforderungen und Ansatz für Energiever...
.conf go 2023 - Cyber Resilienz – Herausforderungen und Ansatz für Energiever...
 
.conf go 2023 - De NOC a CSIRT (Cellnex)
.conf go 2023 - De NOC a CSIRT (Cellnex).conf go 2023 - De NOC a CSIRT (Cellnex)
.conf go 2023 - De NOC a CSIRT (Cellnex)
 
conf go 2023 - El camino hacia la ciberseguridad (ABANCA)
conf go 2023 - El camino hacia la ciberseguridad (ABANCA)conf go 2023 - El camino hacia la ciberseguridad (ABANCA)
conf go 2023 - El camino hacia la ciberseguridad (ABANCA)
 
Splunk - BMW connects business and IT with data driven operations SRE and O11y
Splunk - BMW connects business and IT with data driven operations SRE and O11ySplunk - BMW connects business and IT with data driven operations SRE and O11y
Splunk - BMW connects business and IT with data driven operations SRE and O11y
 
Splunk x Freenet - .conf Go Köln
Splunk x Freenet - .conf Go KölnSplunk x Freenet - .conf Go Köln
Splunk x Freenet - .conf Go Köln
 
Splunk Security Session - .conf Go Köln
Splunk Security Session - .conf Go KölnSplunk Security Session - .conf Go Köln
Splunk Security Session - .conf Go Köln
 
Data foundations building success, at city scale – Imperial College London
 Data foundations building success, at city scale – Imperial College London Data foundations building success, at city scale – Imperial College London
Data foundations building success, at city scale – Imperial College London
 
Splunk: How Vodafone established Operational Analytics in a Hybrid Environmen...
Splunk: How Vodafone established Operational Analytics in a Hybrid Environmen...Splunk: How Vodafone established Operational Analytics in a Hybrid Environmen...
Splunk: How Vodafone established Operational Analytics in a Hybrid Environmen...
 
SOC, Amore Mio! | Security Webinar
SOC, Amore Mio! | Security WebinarSOC, Amore Mio! | Security Webinar
SOC, Amore Mio! | Security Webinar
 
.conf Go 2022 - Observability Session
.conf Go 2022 - Observability Session.conf Go 2022 - Observability Session
.conf Go 2022 - Observability Session
 
.conf Go Zurich 2022 - Keynote
.conf Go Zurich 2022 - Keynote.conf Go Zurich 2022 - Keynote
.conf Go Zurich 2022 - Keynote
 
.conf Go Zurich 2022 - Platform Session
.conf Go Zurich 2022 - Platform Session.conf Go Zurich 2022 - Platform Session
.conf Go Zurich 2022 - Platform Session
 
.conf Go Zurich 2022 - Security Session
.conf Go Zurich 2022 - Security Session.conf Go Zurich 2022 - Security Session
.conf Go Zurich 2022 - Security Session
 

Recently uploaded

Powerpoint exploring the locations used in television show Time Clash
Powerpoint exploring the locations used in television show Time ClashPowerpoint exploring the locations used in television show Time Clash
Powerpoint exploring the locations used in television show Time Clashcharlottematthew16
 
Commit 2024 - Secret Management made easy
Commit 2024 - Secret Management made easyCommit 2024 - Secret Management made easy
Commit 2024 - Secret Management made easyAlfredo García Lavilla
 
What's New in Teams Calling, Meetings and Devices March 2024
What's New in Teams Calling, Meetings and Devices March 2024What's New in Teams Calling, Meetings and Devices March 2024
What's New in Teams Calling, Meetings and Devices March 2024Stephanie Beckett
 
Leverage Zilliz Serverless - Up to 50X Saving for Your Vector Storage Cost
Leverage Zilliz Serverless - Up to 50X Saving for Your Vector Storage CostLeverage Zilliz Serverless - Up to 50X Saving for Your Vector Storage Cost
Leverage Zilliz Serverless - Up to 50X Saving for Your Vector Storage CostZilliz
 
Developer Data Modeling Mistakes: From Postgres to NoSQL
Developer Data Modeling Mistakes: From Postgres to NoSQLDeveloper Data Modeling Mistakes: From Postgres to NoSQL
Developer Data Modeling Mistakes: From Postgres to NoSQLScyllaDB
 
SIP trunking in Janus @ Kamailio World 2024
SIP trunking in Janus @ Kamailio World 2024SIP trunking in Janus @ Kamailio World 2024
SIP trunking in Janus @ Kamailio World 2024Lorenzo Miniero
 
"ML in Production",Oleksandr Bagan
"ML in Production",Oleksandr Bagan"ML in Production",Oleksandr Bagan
"ML in Production",Oleksandr BaganFwdays
 
Connect Wave/ connectwave Pitch Deck Presentation
Connect Wave/ connectwave Pitch Deck PresentationConnect Wave/ connectwave Pitch Deck Presentation
Connect Wave/ connectwave Pitch Deck PresentationSlibray Presentation
 
Vector Databases 101 - An introduction to the world of Vector Databases
Vector Databases 101 - An introduction to the world of Vector DatabasesVector Databases 101 - An introduction to the world of Vector Databases
Vector Databases 101 - An introduction to the world of Vector DatabasesZilliz
 
Install Stable Diffusion in windows machine
Install Stable Diffusion in windows machineInstall Stable Diffusion in windows machine
Install Stable Diffusion in windows machinePadma Pradeep
 
"Debugging python applications inside k8s environment", Andrii Soldatenko
"Debugging python applications inside k8s environment", Andrii Soldatenko"Debugging python applications inside k8s environment", Andrii Soldatenko
"Debugging python applications inside k8s environment", Andrii SoldatenkoFwdays
 
Kotlin Multiplatform & Compose Multiplatform - Starter kit for pragmatics
Kotlin Multiplatform & Compose Multiplatform - Starter kit for pragmaticsKotlin Multiplatform & Compose Multiplatform - Starter kit for pragmatics
Kotlin Multiplatform & Compose Multiplatform - Starter kit for pragmaticscarlostorres15106
 
"LLMs for Python Engineers: Advanced Data Analysis and Semantic Kernel",Oleks...
"LLMs for Python Engineers: Advanced Data Analysis and Semantic Kernel",Oleks..."LLMs for Python Engineers: Advanced Data Analysis and Semantic Kernel",Oleks...
"LLMs for Python Engineers: Advanced Data Analysis and Semantic Kernel",Oleks...Fwdays
 
My Hashitalk Indonesia April 2024 Presentation
My Hashitalk Indonesia April 2024 PresentationMy Hashitalk Indonesia April 2024 Presentation
My Hashitalk Indonesia April 2024 PresentationRidwan Fadjar
 
Advanced Test Driven-Development @ php[tek] 2024
Advanced Test Driven-Development @ php[tek] 2024Advanced Test Driven-Development @ php[tek] 2024
Advanced Test Driven-Development @ php[tek] 2024Scott Keck-Warren
 
Integration and Automation in Practice: CI/CD in Mule Integration and Automat...
Integration and Automation in Practice: CI/CD in Mule Integration and Automat...Integration and Automation in Practice: CI/CD in Mule Integration and Automat...
Integration and Automation in Practice: CI/CD in Mule Integration and Automat...Patryk Bandurski
 
Search Engine Optimization SEO PDF for 2024.pdf
Search Engine Optimization SEO PDF for 2024.pdfSearch Engine Optimization SEO PDF for 2024.pdf
Search Engine Optimization SEO PDF for 2024.pdfRankYa
 
Ensuring Technical Readiness For Copilot in Microsoft 365
Ensuring Technical Readiness For Copilot in Microsoft 365Ensuring Technical Readiness For Copilot in Microsoft 365
Ensuring Technical Readiness For Copilot in Microsoft 3652toLead Limited
 
Artificial intelligence in cctv survelliance.pptx
Artificial intelligence in cctv survelliance.pptxArtificial intelligence in cctv survelliance.pptx
Artificial intelligence in cctv survelliance.pptxhariprasad279825
 
Scanning the Internet for External Cloud Exposures via SSL Certs
Scanning the Internet for External Cloud Exposures via SSL CertsScanning the Internet for External Cloud Exposures via SSL Certs
Scanning the Internet for External Cloud Exposures via SSL CertsRizwan Syed
 

Recently uploaded (20)

Powerpoint exploring the locations used in television show Time Clash
Powerpoint exploring the locations used in television show Time ClashPowerpoint exploring the locations used in television show Time Clash
Powerpoint exploring the locations used in television show Time Clash
 
Commit 2024 - Secret Management made easy
Commit 2024 - Secret Management made easyCommit 2024 - Secret Management made easy
Commit 2024 - Secret Management made easy
 
What's New in Teams Calling, Meetings and Devices March 2024
What's New in Teams Calling, Meetings and Devices March 2024What's New in Teams Calling, Meetings and Devices March 2024
What's New in Teams Calling, Meetings and Devices March 2024
 
Leverage Zilliz Serverless - Up to 50X Saving for Your Vector Storage Cost
Leverage Zilliz Serverless - Up to 50X Saving for Your Vector Storage CostLeverage Zilliz Serverless - Up to 50X Saving for Your Vector Storage Cost
Leverage Zilliz Serverless - Up to 50X Saving for Your Vector Storage Cost
 
Developer Data Modeling Mistakes: From Postgres to NoSQL
Developer Data Modeling Mistakes: From Postgres to NoSQLDeveloper Data Modeling Mistakes: From Postgres to NoSQL
Developer Data Modeling Mistakes: From Postgres to NoSQL
 
SIP trunking in Janus @ Kamailio World 2024
SIP trunking in Janus @ Kamailio World 2024SIP trunking in Janus @ Kamailio World 2024
SIP trunking in Janus @ Kamailio World 2024
 
"ML in Production",Oleksandr Bagan
"ML in Production",Oleksandr Bagan"ML in Production",Oleksandr Bagan
"ML in Production",Oleksandr Bagan
 
Connect Wave/ connectwave Pitch Deck Presentation
Connect Wave/ connectwave Pitch Deck PresentationConnect Wave/ connectwave Pitch Deck Presentation
Connect Wave/ connectwave Pitch Deck Presentation
 
Vector Databases 101 - An introduction to the world of Vector Databases
Vector Databases 101 - An introduction to the world of Vector DatabasesVector Databases 101 - An introduction to the world of Vector Databases
Vector Databases 101 - An introduction to the world of Vector Databases
 
Install Stable Diffusion in windows machine
Install Stable Diffusion in windows machineInstall Stable Diffusion in windows machine
Install Stable Diffusion in windows machine
 
"Debugging python applications inside k8s environment", Andrii Soldatenko
"Debugging python applications inside k8s environment", Andrii Soldatenko"Debugging python applications inside k8s environment", Andrii Soldatenko
"Debugging python applications inside k8s environment", Andrii Soldatenko
 
Kotlin Multiplatform & Compose Multiplatform - Starter kit for pragmatics
Kotlin Multiplatform & Compose Multiplatform - Starter kit for pragmaticsKotlin Multiplatform & Compose Multiplatform - Starter kit for pragmatics
Kotlin Multiplatform & Compose Multiplatform - Starter kit for pragmatics
 
"LLMs for Python Engineers: Advanced Data Analysis and Semantic Kernel",Oleks...
"LLMs for Python Engineers: Advanced Data Analysis and Semantic Kernel",Oleks..."LLMs for Python Engineers: Advanced Data Analysis and Semantic Kernel",Oleks...
"LLMs for Python Engineers: Advanced Data Analysis and Semantic Kernel",Oleks...
 
My Hashitalk Indonesia April 2024 Presentation
My Hashitalk Indonesia April 2024 PresentationMy Hashitalk Indonesia April 2024 Presentation
My Hashitalk Indonesia April 2024 Presentation
 
Advanced Test Driven-Development @ php[tek] 2024
Advanced Test Driven-Development @ php[tek] 2024Advanced Test Driven-Development @ php[tek] 2024
Advanced Test Driven-Development @ php[tek] 2024
 
Integration and Automation in Practice: CI/CD in Mule Integration and Automat...
Integration and Automation in Practice: CI/CD in Mule Integration and Automat...Integration and Automation in Practice: CI/CD in Mule Integration and Automat...
Integration and Automation in Practice: CI/CD in Mule Integration and Automat...
 
Search Engine Optimization SEO PDF for 2024.pdf
Search Engine Optimization SEO PDF for 2024.pdfSearch Engine Optimization SEO PDF for 2024.pdf
Search Engine Optimization SEO PDF for 2024.pdf
 
Ensuring Technical Readiness For Copilot in Microsoft 365
Ensuring Technical Readiness For Copilot in Microsoft 365Ensuring Technical Readiness For Copilot in Microsoft 365
Ensuring Technical Readiness For Copilot in Microsoft 365
 
Artificial intelligence in cctv survelliance.pptx
Artificial intelligence in cctv survelliance.pptxArtificial intelligence in cctv survelliance.pptx
Artificial intelligence in cctv survelliance.pptx
 
Scanning the Internet for External Cloud Exposures via SSL Certs
Scanning the Internet for External Cloud Exposures via SSL CertsScanning the Internet for External Cloud Exposures via SSL Certs
Scanning the Internet for External Cloud Exposures via SSL Certs
 

The Top 10 Glasstable Design Principles to Boost Your Career and Your Business

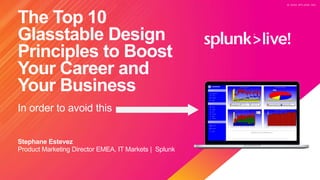
  • 1. © 2 0 2 0 S P L U N K I N C . © 2 0 2 0 S P L U N K I N C . The Top 10 Glasstable Design Principles to Boost Your Career and Your Business In order to avoid this Stephane Estevez Product Marketing Director EMEA, IT Markets | Splunk
  • 2. During the course of this presentation, we may make forward‐looking statements regarding future events or plans of the company. We caution you that such statements reflect our current expectations and estimates based on factors currently known to us and that actual events or results may differ materially. The forward-looking statements made in the this presentation are being made as of the time and date of its live presentation. If reviewed after its live presentation, it may not contain current or accurate information. We do not assume any obligation to update any forward‐looking statements made herein. In addition, any information about our roadmap outlines our general product direction and is subject to change at any time without notice. It is for informational purposes only, and shall not be incorporated into any contract or other commitment. Splunk undertakes no obligation either to develop the features or functionalities described or to include any such feature or functionality in a future release. Splunk, Splunk>, Data-to-Everything, D2E, and Turn Data Into Doing are trademarks and registered trademarks of Splunk Inc. in the United States and other countries. All other brand names, product names, or trademarks belong to their respective owners. © 2020 Splunk Inc. All rights reserved. Forward- Looking Statements © 2 0 2 0 S P L U N K I N C .
  • 3. © 2 0 2 0 S P L U N K I N C . TBD Product Marketing Director EMEA, IT Markets | Splunk Wine addict, guitar addict, product marketing addict Stephane Estevez Senior Sales Engineer | Splunk xx addict, xx addict, xxxaddict TBD
  • 4. © 2 0 2 0 S P L U N K I N C . Today’s Scope
  • 5. © 2 0 2 0 S P L U N K I N C . Deliver data and insights to every business and IT function Turn Data into Doing, Everywhere in IT
  • 6. © 2 0 2 0 S P L U N K I N C . Turn Data into Doing, Everywhere in IT See the Bigger Picture with a unified experience for all of your teams across all of your services, applications, and infrastructure. Create Insights Across Silos when you bring together data from every team and tool to drive real-time visualizations of the metrics and KPIs that matter most. Empower Teams with Powerful Tools that provide productive and efficient workspaces, automation, and alerts, so your teams can deliver the experiences customers demand. Deliver data and insights to every business and IT function
  • 7. © 2 0 2 0 S P L U N K I N C . Make the Shift to Predictive IT Find Problems Even Faster with machine learning-powered Service Analyzer tree to leverage the right data and determine root cause. Solve Problems in Record Time with Event Management to cluster events, reduce noise, and helping the right teams focus on only what is most important. Predict Problems in Advance with KPI Predictions and Predictive Cause Analysis, trending data across services, apps, and infrastructure so you can prevent outages before they have impact. With Splunk ITSI, you can predict and prevent problems before they have impact
  • 8. © 2 0 2 0 S P L U N K I N C . Lack of design Applying basic design principles If you want your career to take off, demonstrate that you don’t need to be a data scientist to be effective. Embracing data visualization and predictive analytics to communicate imaginative business intelligence can propel your career. —PwC Glass Table Design Can Have the Same Effect on Your Boss as on Phoebe. “
  • 9. © 2 0 2 0 S P L U N K I N C . Data Visualization Definition & History
  • 10. © 2 0 2 0 S P L U N K I N C . Data visualization is the practice of converting data from raw figures into a graphical representation such as maps, graphs, charts, and complex dashboards.” Definition “
  • 11. © 2 0 2 0 S P L U N K I N C . A Little Bit of History 2nd Cent CE People start arranging data into tables (columns and rows) 1160 BC First documented data visualization Turin Papyrus Map illustrates the distribution of geological resources and provides information about quarrying of those resources. 14,500 BC First Star Map Lascaux painted caves 17th Century The idea of representing quantitative information graphically arise Thank you Mr. René Descartes, for the two- dimensional coordinate system for displaying values 18th Century Charts created Thank you William Playfair for exploiting the potential of graphics for the communication of quantitative data. He create a line moving up and down from left to right to show how values changed through time (and the bar and pie charts…) ©W.Playfair1786 2020+ Data Journalism, ‘Citizen Data Scientists’… Words meets numbers. Complex things are explained using simple and engaging stories. ©Gartner
  • 12. © 2 0 2 0 S P L U N K I N C . Data Viz Becomes Mainstream We are creating new ways of converting data into graphical representations Source : http://datavis.ca/milestones/
  • 13. © 2 0 2 0 S P L U N K I N C . How Meaningful is Data Visualization?
  • 14. © 2 0 2 0 S P L U N K I N C . Human Cognition and Data Visualization Data visualization has been created for human consumption, so understanding human perception and cognition is key. Human brains have a much harder time understanding complex data when it is encoded in numbers and text compared to graphics. But human vision can “understand” an image in 13 ms and process hit while the next image is displayed (source: M.Potter-MIT). Visually displayed (using graphs, shapes, color, orientation…), data is easier to grasp and analyze, making it faster for decision makers to find patterns, including new and hidden, and to understand even difficult concepts.
  • 15. © 2 0 2 0 S P L U N K I N C . Time for the Top 10 Principles
  • 16. © 2 0 2 0 S P L U N K I N C . Principle #1 Glass Tables & dashboards are not reports
  • 17. © 2 0 2 0 S P L U N K I N C . Glass Tables and Dashboards are NOT Reports Reports Glass Tables Type of data As much as you can Most important data Realtime No Yes Presentation Detailed Consolidated Format Static Dynamic Allows quick action No Yes Ease of use Complex Simple and easy 1
  • 18. © 2 0 2 0 S P L U N K I N C . Principle #2 Start with paper!
  • 19. © 2 0 2 0 S P L U N K I N C . Define your audience and understand user requirements • What information do you need from me? • What form do you need it in? • What do you need or want to understand about this data? Content • Keep it relevant. Less really is more. • Avoid overdesigning. • Use iconography. Content isn’t limited to text and charts. 2 Start with Paper
  • 20. © 2 0 2 0 S P L U N K I N C . Principle #3 Colors and fonts matter
  • 21. © 2 0 2 0 S P L U N K I N C . • Stick to 1 font • No more than 3 sizes • Need to create visual hierarchy? Bold it or add an accent color (if everything’s bold, nothing is) • Use Serif fonts for body text (easier to read for longer text) • Use sans-serif for headlines, short blocks of text Fonts matterColors matter• Choose few and stick to them (but play with gradients) • Leverage contrast (use the Adobe Color wheel http://color.adobe.com) • Use color sparingly (each color serve a particular communication goal) • Pay attention to meaning – bad kind of bad good • Adapt colors to your audience culture (death=black in western countries, death=white in asia) • If using colors, make sure the background color is consistent (make color changes more obvious) Colors and Fonts Matter3
  • 22. © 2 0 2 0 S P L U N K I N C . Principle #4 Choose the right visualization for the right data
  • 23. © 2 0 2 0 S P L U N K I N C . Data Visualization Not all charts are created equal. Looking good ≠ ease of understanding. Effective visualizations enables the audience to easily comprehend more data in less time. (choose the right representation of data) 4
  • 24. © 2 0 2 0 S P L U N K I N C . Visualizations 0 2 4 6 47% 29% 13% 11% GaugesPie chartLine chart / Sparkline (condensed) 4.3 2.4 2 Bar chart 0 20 40 60 Stacked area chart Title 1 Title 2 Title 3 Item 1 Item 3 Item 5 Item 2 Item 4 Item 6 Tabular format + - Best used when exact quantities of numbers must be known Not conducive to finding trends and comparing sets of data Best used when trying to visualize continuous data over time Best used when showing comparisons between categories or items in the same category Best used to compare parts to the whole Makes comparison of pie slice size difficult. Not great if less than 3 or more than 6 categories Best used for showing cumulated totals over time via numbers or percentages Best used to show a range ideal when you have an absolute floor// ceiling value Takes valuable space with limited information (single dimension) Less effective then line chart when trying to show trends over time If consistent scales on the axis aren’t used, it might lead to the data of a line graph appearing inaccurate. Users yes tend to focus on the tops of each line, leading to misinterpreting the patterns. 0 1 2 3 4 0 1 2 3 Scatter chart Best for showing the overall relationship in a large amount of data Limited to two variables, they are unable to give the exact extent of correlation
  • 25. © 2 0 2 0 S P L U N K I N C . Visualization Tips 2.4 4.3 2 0 2 4 6 Category 1 Chart Title Series 1 Series 2 Series 3 5.2, 16% 3.2, 10% 1.4, 4% 1.2, 4% 5, 16%4.1, 13% 0.5, 1% 8, 25% 3.4, 11% Sales year 1 year 2 year 3 year 4 year 5 year 6 year 7 year 8 year 9 X X Reduce Chart-junk and Increase Data-to-ink Ratio Comparison Static Over Time 4.3 2.4 2 Category 1 0 2 4 6 Line chartLine chart (several items) Bar chartColumn chart 0 2 4 6 4.3 2.4 2 Pie chart Composition Static Over Time year 1 year 2 year 3 year 4 Stacked column chart Staked area chart 47% 29% 13% 11% 0 20 40 60
  • 26. © 2 0 2 0 S P L U N K I N C . Principle #5 Follow the eyes
  • 27. © 2 0 2 0 S P L U N K I N C . Follow the Eyes But remember principle #2: Know your audience • Some languages uses right to left scripts (Arabic, Hebrew, Kurdish…) • Some are even more complex (flexible) like ideographic languages (Chinese, Japanese and Korean) : they can be written left to right or vertically top to bottom (with vertical lines proceeding from right to left), sometimes both directions can even be combined on one page. kindle newspaper Hardcover book mobile • They are meant to be read from left to right and top to bottom 5 What do they have in common?
  • 28. © 2 0 2 0 S P L U N K I N C . Principle #6 Organize content blocks
  • 29. © 2 0 2 0 S P L U N K I N C . Organize Content Blocks Hierarchy Proximity Balance ContrastPositionSize Shape Color Orientation White Space 6
  • 30. © 2 0 2 0 S P L U N K I N C . Organize Content Blocks Hierarchy Proximity Balance ContrastPositionSize Shape Color Orientation
  • 31. © 2 0 2 0 S P L U N K I N C . Principle #7 The power of diagrams and flows
  • 32. © 2 0 2 0 S P L U N K I N C . Need to emphasize a new process? Do not underestimate the power of the glass table • Glass tables can be a good way to “push” for a new process • Draw you process as a glass table background and add KPIs to it • A great way to get your teams look at the process every day ! The Power of Diagrams and Flows (Let’s do some basic internal politics  ) 7
  • 33. © 2 0 2 0 S P L U N K I N C . Principle #8 Use the dramatic approach when needed
  • 34. © 2 0 2 0 S P L U N K I N C . Alerts and Dashboard (Sometimes clean isn’t enough; a more dramatic approach is needed) Shift the focus from the full data to changes in the most critical data points. By pulling out the important exceptions, you can make it easier for your audience to digest what matters and take action. Alerts are one mechanism to turn the focus to the exceptions, outliers and data highlights. 4 C’s: Context: Users need to understand how an alert is defined and how it fits into the larger picture. Cogency: An alerting system needs to avoid causing unnecessary alarm while delivering easy-to- understand information that can be acted upon. Communication: Alerts must be designed to effectively capture attention and inform. Control: Advanced alert system should give users the ability to customize and manage alerts. 8
  • 35. © 2 0 2 0 S P L U N K I N C . Principle #9 Use simple tools like PowerPoint (or equivalent) and an image search engine (Google, Qwant…)
  • 36. © 2 0 2 0 S P L U N K I N C . How to Create a Background Image for Your Glass Table Step 1: Design it in PowerPoint using Google/Qwant… or any other image search engine Shapes and icons Search for PNGs — transparent images (labeled for re use or ask your marketing team) 9
  • 37. © 2 0 2 0 S P L U N K I N C . Right click on shape How to Create a Background Image for Your Glass Table Step 1: Design it in PowerPoint using Google/Qwant… or any other image search engine
  • 38. © 2 0 2 0 S P L U N K I N C . How to Create a Background Image for Your Glass Table Delete the widgets (will be added later on ITSI) Export as PNG (will be added later on ITSI as background)
  • 39. © 2 0 2 0 S P L U N K I N C . Principle #10 Be trendy
  • 40. © 2 0 2 0 S P L U N K I N C . Flat Design Minimalist Influenced by the International Typographic Style and Bauhaus Uses sans-serif typography ;) Examples: Microsoft Metro design language (Xbox, Office…), iOS
  • 41. © 2 0 2 0 S P L U N K I N C . “We see a growing problem with the use of color on dashboards/glasstables these days. There’s often either too much of it, making the dashboard visually overwhelming, or too little of it, producing a boring dashboard. The best way to engage users is through “colorblocking”: balancing monochromatic background colors against bright colors to highlight important insights or anomalies in the data.” The exploration of taking colors that are opposites on the color wheel and pairing them together to make interesting and complementary color combinations. —Wikipedia Color-Blocking Thank you Mr Piet Mondrian “
  • 42. © 2 0 2 0 S P L U N K I N C . A technique likely to become more popular in the near future The overlapping effect consists of colors, text or image Overlaps can create a sense of space and a more structured interface Gradients add realism and depth to the platform (feels more natural) Landing page by Saepul Rohman Overlapping
  • 43. © 2 0 2 0 S P L U N K I N C . 99/100 12/121/1 0/52 21/21 354 1324 2546 12546 Trans/site Paris Los Angeles Sidney Cape Town New York 0 100 200 300 400 500 600 1pm 2pm 3pm 4pm Response time 834.3 320% Avg response time APIGateway $9.5 5126% $4.23% -7% 128-12% New York Paris Revenue Support tickets Enterprise Service Bus Batch Micro-srv B Micro-srv A Legacy Storage Cloud API SAP Storage Mainframe
  • 44. © 2 0 2 0 S P L U N K I N C . You! Thank
  • 45. © 2 0 2 0 S P L U N K I N C . Q&A

Editor's Notes

  1. William Playfair (22 September 1759 – 11 February 1823), a Scottish engineer and political economist, served as a secret agent on behalf of Great Britain during its war with France.[1] The founder of graphical methods of statistics,[2] Playfair invented several types of diagrams: in 1786 the line, area and bar chart of economic data, and in 1801 the pie chart and circle graph, used to show part-whole relations.[3] As secret agent, Playfair reported on the French Revolution and organized a clandestine counterfeiting operation in 1793 to collapse the French currency.
  2. Data visualization has been created for human consumption, so understanding human perception and cognition is key (perception, attention, learning, memory, concept formation, problem solving…). Simple fact: Human brains have a much harder time understanding complex data when it is encoded in numbers and text compared to graphics, but human vision can “understand” an image in 13 ms and process hit while the next image is displayed (source: M.Potter-MIT) Visually displayed (using graphs, shapes, color, orientation…), data is easier to grasp and analyze, making it faster for decision makers to find patterns, including new and hidden, and to understand even difficult concepts.
  3. Choosing the wrong chart type, or defaulting to the most common type of data visualization could confuse users or lead to data misinterpretation. A graph might look great, but that doesn’t mean it presents information in a way that can be easily understood and analysed. And there’s nothing more frustrating than staring at a chart wondering what you’re supposed to get out of it.
  4. In today’s day and age, people have plenty of options for what to consume and how to consume it. Whether they use a Kindle, a newspaper, or a hardcover book, these platforms all have one thing in common, at least in North America: They are meant to be read from left to right and top to bottom. While this remains an important point for desktop dashboard design, it’s even more essential for mobile. Place the most important details from top left to bottom right. This is where the user’s eyes will naturally start, so get them on the right track Right to left started being popularized the use of stone tablets. People throughout history, broadly speaking, have been more right-handed. When a right-handed person takes a chisel and hammer to a stone,  he tends to hold the chisel with his left hand and hammer with his right. So it makes sense to move from right to left (RTL). Later, when paper became a more popular medium for writing, people started preferring LTR because writing RTL increases smudging. 
  5. One of the most subtle yet essential dashboard guidelines, this principle boils down to balance. White space – also referred to as negative space – is the area of blankness between elements featured on a dashboard design.
  6. Context : An alert is commonly defined by the following factors: metric (e.g. revenue), dimension (e.g. time), delta (e.g month over month change), scope (e.g. Northeast region, Service line), threshold (e.g. increase or decrease of 10%). Cogency: (pertinence) Is the alert actionable? In the best cases, alerts should point users to both the drivers of the alert and the actions that can address the situation, Are the alerts so granular and/or frequently triggered that users will get alert fatigue? Excessive use of alerts will undermining their credibility Communication:Is the alert placed in context? Does the sophistication of your alerts match the sophistication of your audience? Control: Can the user identify the important alerts for them, and avoid the others?
  7. The International Typographic Style, also known as the Swiss Style, is a graphic design style that emerged in Russia, the Netherlands, and Germany in the 1920s and was further developed by designers in Switzerland during the 1950s.[1] The International Typographic Style has had profound influence on graphic design as a part of the modernist movement. It emphasizes cleanness, readability, and objectivity.[