Case for STEM Education in the US (39 characters
•
35 likes•6,068 views

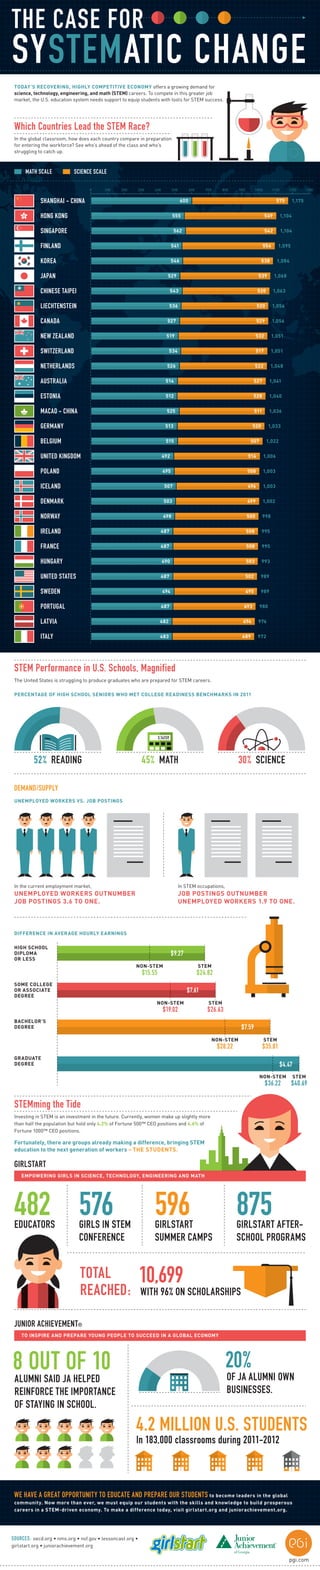
STEM - or science, technology, engineering and math - is the key to success for our global future. Today's recovering, highly competitive economy is in desperate need of STEM careers. Which countries lead the STEM race? How is the U.S. performing compared to the leaders? And who's rising to the challenge of equipping future generations? This infographic by PGi, a global leader in collaboration and virtual meetings, reveals the dangers of overlooking this looming threat and how we can stem the tide for global leadership in STEM education and economies.
Recommended

Recommended
More Related Content
Similar to Case for STEM Education in the US (39 characters
Similar to Case for STEM Education in the US (39 characters (20)
More from PGi
More from PGi (20)
Case for STEM Education in the US (39 characters
- 1. THE CASE FOR SYSTEMATIC CHANGE TODAY’S RECOVERING, HIGHLY COMPETITIVE ECONOMY offers a growing demand for science, technology, engineering, and math (STEM) careers. To compete in this greater job market, the U.S. education system needs support to equip students with tools for STEM success. Which Countries Lead the STEM Race? In the global classroom, how does each country compare in preparation for entering the workforce? See who’s ahead of the class and who’s struggling to catch up. MATH SCALE SCIENCE SCALE 0 100 200 300 400 500 600 SHANGHAI - CHINA 700 800 900 1000 1100 600 1200 575 1300 1,175 HONG KONG 555 549 1,104 SINGAPORE 562 542 1,104 FINLAND 541 554 1,095 KOREA 546 538 1,084 JAPAN 529 539 1,068 CHINESE TAIPEI 543 520 1,063 LIECHTENSTEIN 536 520 1,056 CANADA 527 529 1,056 NEW ZEALAND 519 532 1,051 517 1,051 522 1,048 SWITZERLAND 534 NETHERLANDS 526 AUSTRALIA 514 527 1,041 ESTONIA 512 528 1,040 MACAO - CHINA 525 511 1,036 520 1,033 GERMANY 513 BELGIUM 515 507 1,022 UNITED KINGDOM 492 514 1,006 POLAND 495 508 1,003 ICELAND 507 496 1,003 DENMARK 503 499 1,002 NORWAY 498 500 998 IRELAND 487 508 995 FRANCE 487 508 995 HUNGARY 490 503 993 UNITED STATES 487 502 989 SWEDEN 494 495 989 PORTUGAL 487 493 980 LATVIA 482 494 976 ITALY 483 489 972 STEM Performance in U.S. Schools, Magnified The United States is struggling to produce graduates who are prepared for STEM careers. PERCENTAGE OF HIGH SCHOOL SENIORS WHO MET COLLEGE READINESS BENCHMARKS IN 2011 3.14159 52% READING 45% MATH 30% SCIENCE DEMAND/SUPPLY UNEMPLOYED WORKERS VS. JOB POSTINGS In the current employment market, In STEM occupations, UNEMPLOYED WORKERS OUTNUMBER JOB POSTINGS 3.6 TO ONE. JOB POSTINGS OUTNUMBER UNEMPLOYED WORKERS 1.9 TO ONE. DIFFERENCE IN AVERAGE HOURLY EARNINGS HIGH SCHOOL DIPLOMA OR LESS $9.27 NON-STEM STEM $15.55 SOME COLLEGE OR ASSOCIATE DEGREE $24.82 $7.61 NON-STEM $19.02 STEM $26.63 BACHELOR’S DEGREE $7.59 NON-STEM $28.22 STEM $35.81 GRADUATE DEGREE $4.47 NON-STEM $36.22 STEM $40.69 STEMming the Tide Investing in STEM is an investment in the future. Currently, women make up slightly more than half the population but hold only 4.2% of Fortune 500™ CEO positions and 4.6% of Fortune 1000™ CEO positions. Fortunately, there are groups already making a difference, bringing STEM education to the next generation of workers – THE STUDENTS. GIRLSTART EMPOWERING GIRLS IN SCIENCE, TECHNOLOGY, ENGINEERING AND MATH 482 576 EDUCATORS 596 GIRLS IN STEM CONFERENCE GIRLSTART SUMMER CAMPS 875 GIRLSTART AFTERSCHOOL PROGRAMS 10,699 TOTAL REACHED: WITH 96% ON SCHOLARSHIPS JUNIOR ACHIEVEMENT® TO INSPIRE AND PREPARE YOUNG PEOPLE TO SUCCEED IN A GLOBAL ECONOMY 8 OUT JAOF 10 ALUMNI SAID HELPED 20% OF JA ALUMNI OWN BUSINESSES. REINFORCE THE IMPORTANCE OF STAYING IN SCHOOL. 4.2 MILLION U.S. STUDENTS In 183,000 classrooms during 2011-2012 WE HAVE A GREAT OPPORTUNITY TO EDUCATE AND PREPARE OUR STUDENTS to become leaders in the global community. Now more than ever, we must equip our students with the skills and knowledge to build prosperous careers in a STEM-driven economy. To make a difference today, visit girlstart.org and juniorachievement.org. SOURCES: oecd.org • nms.org • nsf.gov • lessoncast.org • girlstart.org • juniorachievement.org pgi.com