Product Market Study - ICT Market in Thailand (2012)
paper_Measuring the Efficiency and Productivity Change of APEC Mobile Telecommunications Firm
1. 1
Measuring the Efficiency and Productivity Change of APEC
Mobile Telecommunications Firm
Ya-Ting Chao1
Abstract
The Asia-Pacific Economic Cooperation (APEC) mobile operators play an
influential and fundamental role in global telecommunications industry and show
pretty well performances both in penetration and growth of mobile subscribers. This
study is to measure the efficiency and productivity change of 28 APEC’s mobile
operators during the time period of 2003 to 2008, using the DEA and Malmquist
index approaches. Two output variables are operating revenue and number of mobile
subscribers, and three input variables are number of employees, total assets and
capital expenditures. The empirical results of the DEA model show that three
operators, KDDI, Telkomsel and Smart Communication, were fully efficient with all
the values of TE, PTE and SE equal to 1. But, Telstra, Rogers Wireless, Bell Wireless,
Verizon Wireless and AT&T Mobility were the ones with the technical efficiency of
less than 0.6 on average. It is found that operators with large revenues do not
necessarily achieve high efficiency. In particular, these operators, as the leading role
in the telecommunication industry, have to develop pioneering technologies on
services and applications and provide new network systems ahead of their rivals.
Therefore, these might bring the inefficiency to large operators. Next, the results of
Malmquist productivity index show that productivity increased by 5.5% between 2003
and 2008 or about 1.1% per year. This growth is due primarily to improvements in
technical efficiency rather than innovation.
Keywords: Efficiency, Productivity change, APEC mobile operator
1. Introduction
1.1 Background and motivation
Productive efficiency is a measure relating a quantity or quality of output to the
inputs required to produce it. In nowadays competitive environment, measuring
productive efficiency helps a firm or an organization to know how to improve its
capability in the process of producing and to find the way to use its resources and
inputs more efficiently. In addition, the productivity measures are generally regarded
as a more reliable indicator of industry performance than profitability (Madden and
Savage, 1999). Extensive researches have measure the productivity and efficiency of
firms in diverse fields. In particular, the liberalization and privatization in global
telecommunications markets in the last two decades have attracted academician
attention on the productive efficiency in telecommunications.
Various methodologies have been used to measure the efficiency and
productivity change, including the conventional growth-accounting approach, total
factor productivity (TFP) measurement, the Divisia aggregation method, the
Malmquist index of TFP, data envelopment analysis (DEA), and other measurements.
For instance, Calabrese, Campisi and Mancuso (2002) examined the productivity
growth in the telecommunications industries of 13 OECD countries during 1979 to
1988 by the Malmquist TFP index, revealing that technical change was the most
1
Institute of Telecommunications Management, National Cheng Kung University, Tainan 70101,
Taiwan (E-mail: vivian0326@yahoo.com.tw).
2. 2
important factor for the TFP growth. Uri (2000) examined the productivity growth of
19 local exchange carriers (LECs) in the United States during 1988 to 1998 by the
growth accounting and Malmquist index, and concluded that the productivity growth
was primarily due to the innovation rather than the improvements in efficiency. Tsai,
Chen and Tzeng (2006) adopted traditional DEA, A&P efficiency measure and
efficiency achievement measure to discover the productivity ranking of 39 leading
telecommunication operators in Forbes 2000. The results indicated that Asia-Pacific
telecom operators have better productivity efficiency than those in Europe and
America.
The Asia-Pacific Economic Cooperation (APEC) has a great influence on the
world’s economical growth and development. APEC’s mobile operators play an
influential and fundamental role in global telecommunication industry. Mobile
operators currently face fierce challenges from different industries and international
competition. For instance, entering WTO is a significant step towards the further
development and reform of a country’s mobile market. The commitments to join the
WTO have rendered investment environment more suitable for international
investments in this sensitive field. The restrictions of foreign-capital investment on
telecommunication operators have been lifted due to the WTO's protocol. Foreign
mobile operators bring positive effects of raising funds and equipment/technology
upgrade in these countries by entering the domestic market.2
In addition, the merger
and alliance between operators enhance the business competitiveness. Accordingly,
mobile operators are able to upgrade the telecommunications systems and provide
better services. On the other hand, to pursue a faster bandwidth and full coverage, a
new generation of mobile systems has a much shorter life cycle. In sum, mobile
operators bear higher infrastructure costs and mobile market becomes increasingly
competitive. Therefore, to find a suitable way to measure the operator's the efficiency
and productivity change is thus important.
1.2 Development of mobile telecommunications in APEC
Global economy stably developed from 2004 to 2008 with a growth rate of
around 4.0%. However, the subprime mortgage crisis from the U.S. seriously struck
various countries resulting in global financial downturn. The emerging economies in
Asia, especially China, India and Russia, were still strong with high growth rates and
played the role of a driving engine for the global economy. APEC, established in 1989,
is the premier forum for promoting economic growth, cooperation, trade and
investment in the Asia Pacific region. The 21 members in APEC, accounted for
40.5% of the world's population, approximately have 54.2% (28.6 trillion) of world
gross domestic product (GDP) and 43.7% of world trade volume in 2007 (APEC,
2008). The average economic growth rate from 2000 to 2007 in the APEC was 4.71%,
higher than the global value of 3.2% (The World Bank, 2009).
According to International Telecommunication Union (ITU, 2009), the number
of global mobile subscribers has reached to 4 billion in 2008, with the penetration rate
of 59.34 percent in the world's population of 6.77 billion. It reveals that mobile
services significantly affect human being’s life and technology, and bring enormous
2
Take Vietnam as an example. “WTO accession will lure foreign investors to telecom market”, the
statement made by the Post and Telematics Minister in 2009. Vietnam's telecom and information
technology sectors have many opportunities for development, especially in drawing foreign investment,
after the country joined the WTO, that almost US$2 billion from foreign enterprises have been invested
in telecom services.
3. 3
economic benefits and communicating convenience. The main mobile systems
adopted include global system for mobile communications (GSM), general packet
radio service (GPRS) and enhance data GSM environment (EDGE) system with 3
billion subscribers and 78 percent of market share. The first generation (1G) analog
system is fast diminishing with only 1 million subscribers left in the advanced mobile
phone system (AMPS), total access communication system (TACS) and Nordic
mobile telephony 450/900 (NMT450/900). The second generation (2G) system is also
decreasing and being replaced by the third generation (3G) services. The wideband
code division multiple access (WCDMA) and high speed packet access network
(HSPA) systems have 315 million subscribers with 8.2 percent of market share
because of better service quality and download speeding.
Mobile telecommunications industry in the APEC shows pretty well
performances both in penetration and growth of mobile subscribers. The APEC
mobile penetration rate in 2008 was 90.46 percent, a 31 percent higher than the one in
the global market. Although major APEC members have low growth rate in
subscribers due to the saturated markets, the growth rate of 26.73% on average from
2003 to 2008 still surpassed the world’s value of 23.2%.
There are eight members in APEC which mobile penetration rate are fully
saturated: Hong Kong, Singapore, Russia, Thailand, Taiwan, New Zealand, Australia
and Malaysia with the respective penetration rates of 162.9, 138.15, 132.61, 118.04,
110.31, 109.22, 104.96 and 100.41 (ITU, 2009). In particular, Japan and Korea are the
most well developed in the mobile service market, and their mobile broadband
penetration rates were 56.8 and 48.58 in 2007, ranking in the world's top two. Japan,
Korea, Taiwan, Hong Kong and Singapore are currently facing an issue in mobile
services that their markets almost reach to the status of full saturation. As a result,
these mobile operators focus on upgrading the mobile systems and the revenue growth
in mobile data services. Given that the HSPA, a 3.5 generation service (3.5G), is of
almost the full coverage in these countries, mobile operators and information and
computer technology (ICT) companies work together to promote mobile data services
with mobile Internet device (MID). For example, netbook3
boosts the demand for
subscribers’ second phone number and stimulates the revenue in mobile data services.
The mobile penetration rate in the U.S. was 86.79 in 2008. In accordance with
Forbes 2000 (2009), American Telephone & Telegraph (AT&T) and Verizon
Communications are ranked as the first and third largest telecommunications
operators in the world based on a mix of four metrics: sales, profit, assets and market
value, indicating that the U.S. operators have determinable power in the global market.
Mobile penetration rate in North America was about 75.65 percent in 2008. As
compared with the markets in other APEC’s regions, the ratio of owing the second
phone number is relatively low. Consequently, the strategies for these mobile
operators are to increase wireless terminal connections for each user and to promote
the demand of mobile broadband service.
There are two generations of commercial mobile service systems used in the
APEC nowadays, including the 2G and the 3G. The GSM and cdmaOne are the two
main systems in the 2G services. The 2G standard allows a maximum data rate of 9.6
kbps, which is possible to transmit voice and low volume digital data, for example,
3
A netbook is a laptop computer designed for wireless communication and access to the Internet. It
ranges in size from below 5 inches to over 13, typically weighs 2 to 3 pounds and is often significantly
cheaper than general purpose laptops.
4. 4
short message service (SMS) or multimedia message service (MMS). The WCDMA
and CDMA2000 1X are the two main systems in the 3G services. The 3G standard
increases the transmission rate up to 2 mega bit per second (Mbps), which is
compatible with all mobile systems in the world and with the 2G networks. Due to its
high data transmission rate, the 3G system is able to provide multimedia services,
such as video transmission, video conferencing, and high-speed Internet access, and is
widely applied to the other aspects of the daily life. Their extended versions (3.5G)
are the HSPA and CDMA2000 1x EV-DO.
The major mobile system adopted in Asian markets is GSM, which accounted for
the market share of 76.2 percent in 2008 (MIC, 2009). The other system technologies
by subscriber share are cdmaOne and CDMA 2000 1X (12 percent), WCDMA and
HSPA (7.4 percent), and CDMA2000 1x EV-DO (3.7 percent). SK Telecom and
Korea Telecom Freetel (KTF) in Korea actively deploy WCDMA and HSDPA
networks, as well as advocating the user to switch CDMA2000 1X system to
WCDMA and HSDPA systems. So, the CDMA users in Asia are expected to slowly
decrease in the future. The unique system, TD-SCDMA, offered by China Mobile in
China, has grown in a tardy pace, because of its incomplete industry chain and
communication quality. There were only 330,000 subscribers by the end of 2008. The
main mobile system in North America markets is still the GSM, which accounted for
the market share of 31.1 percent in 2008. The other system technologies by subscriber
share are cdmaOne and CDMA 2000 1X (29.3 percent), and CDMA2000 1x EV-DO
(21.2 percent) (MIC, 2009). The future technology developed by Verizon Wireless
and Telecom Mobile(T-Mobile) in the U.S., and Telus and Bell in Canada are moving
towards long term evolution (LTE), the fourth generation (4G) system.
Mobile service, being needed in our daily lives, has enormous impacts on world
economy. Mobile services connect and communicate with people anytime and
anywhere. The revenues of world mobile communication have steadily increased,
reaching the total values of US 1,391 billion in 2008 (MIC, 2009). In 2007, global
revenue (692 billion) of mobile service surpassed that (647 billion) of fixed-line
service. Mobile service continually grows because of the newly developing markets
and the various contents in 3G service. Undoubtedly, mobile service plays the
mainstream role now and will do so in the future.
1.3 Research objective
The purpose of this study is to measure the efficiency and productivity change of
28 mobile operators during the time period of 2003 to 2008, using the DEA and
Malmquist index approaches. The operators are Telstra, Optus, CSL, NTT DoCoMo,
KDDI, SK Telecom (SKT), KTF, Celcom, Telecom New Zealand, SingTel,
Chunghwa Telecom (CHT), Taiwan Mobile (TMB), AIS, Total Access
Communication (DTAC), Mobile TeleSystems (MTS), Vimpelcom, Verizon Wireless,
AT&T Mobility, Telkomsel, Indosat, China Mobile, China Unicom, Smart
Communication, Globe Telecom, Rogers Wireless, Bell Wireless, Telcel, Movistar.
There are two output variables and three input variables adopted in this study. Two
output variables are revenue and number of mobile subscribers, and three input
variables are number of employees, total assets and capital expenditures, as
commonly adopted in the literature.
2. Literature Review
Most state-owned telecommunications operators worldwide experienced
5. 5
competitive changes through the deregulation and the privatization in the market.
Traditional rate of return regulation was replaced with new price cap regulations. The
digital convergence and liftoff of international investment restriction in
telecommunications make the market fiercely competitive from all aspects. The
productivity and efficiency are important for telecommunication operators. With the
knowledge of the strength and weakness, the operators are able to modify their
managerial strategies to increase the efficiency and to achieve higher profits. The
issue of measuring productivity and efficiency of an industry is crucial to both the
economic theorist and the economic policy maker (Farrell, 1957).
In the last two decades, there has been a growing interest in measuring the
efficiency of telecommunications companies due to academic interest and to
regulatory purposes. For example, Tsai, Chen and Tzeng (2006) adopted traditional
DEA, Andersen and Petersen (A&P) efficiency measure and efficiency achievement
measure to discover the productivity ranking of 39 leading telecommunication
operators in Forbes 2000. The results indicated that Asia-Pacific telecom operators
have better productivity efficiency than those in Europe and America. Lam and Shiu
(2008) applied the DEA approach to measure the productivity performance of China’s
telecommunications sector at the provincial level from 2003 to 2005. The results
indicated that the efficiency scores for different provinces and regions are diverse. For
instance, provinces and municipalities in the eastern region have achieved higher
levels of technical efficiency than those in the central and western regions. Also, the
differences in efficiency scores are mainly due to the differences in the operating
environments of different provinces, rather than the efficiency performance of
telecommunications enterprises. Yang and Chang (2009) used the DEA window
analysis to examine the efficiency for Taiwan’s mobile firms between 2001 and 2005.
The results showed that the acquisitions did help Taiwan Mobile and Far Eastone
Telecom to improve their scale efficiencies but worsened pure technical efficiency in
the short term. Also, Chunghwa Telecom did maintain its pure technical efficiency
within a marginal variability, which implies that it might manage the resources in a
more stable way. Finally, Liao and González (2009) applied partial factor productivity
and the DEA to investigate the efficiency of mobile operators in BRICs (i.e., Brazil,
Russia, India and China) during 2002 to 2006. They found that the two leading
Brazilian mobile operators, Vivo and TIM, are fully efficient, but Indian mobile
operators are the least efficient among BRICs operators.
Some researchers were interested in measuring the productivity growth to
compare with competing operators. Lee, Park and Oh (2000) analyzed and compared
the efficiency change of Korean Telecom (KT) before and after the introduction of
both domestic and foreign competition by Partial productivity and Malmquist index
methodology. The empirical results revealed that the overall efficiency of KT
significantly improved due to the improvement of the allocative efficiency. The
improvement of technical efficiency, however, was not significant due to hothouse
competition and excessive regulation of government on corporate governance of KT.
The study provided some insightful policy implications. Market condition needs to be
more competitive, eliminating entry barriers and deregulating price regulation. The
regulatory agency has to provide operators with the autonomy of management such as
strategic marketing, diverse tariff and new services for consumer utility in order to
accomplish the results of privatization and deregulation. Uri (2000, 2002) measure the
productivity change of 19 local exchange carriers (LECs) in the United States and
analyzed whether price cap, one popular incentive regulation plan, resulted in an
6. 6
increase in efficiency. Both studies used the same techniques, Malmquist index
approach and conventional-growth accounting approach. However, the outcomes were
somewhat different due to differences in the output variables and slight difference in
the periods under study. Uri (2000) concluded that efficiency improved as a whole,
but Uri (2002) indicated that in the aggregate there was virtually no change in
efficiency. Incentive regulation was designed to promote efficiency. Thus, Uri (2000)
suggested that the implementation of price cap was a success, while Uri (2002)
implied that incentive regulation does not appear to have been successful. Further, Uri
(2001) also measured the impact of price caps on productive efficiency, but used DEA
methodology instead of Malmquist index approach. The results showed that there was
no identifiable improvement in the aggregate LECs efficiency between 1988 and 1998.
Calabrese, Campisi and Mancuso (2002) analyzed the evolution of labor and total
factor productivity in the telecommunications industries of 13 OECD countries by
using DEA , Malmquist TFP index and α, β convergence techniques. The paper also
explored the existence of convergence in both labor and total factor productivity
among the 13 telecom industries by means of a cross-section technique α and
β-convergence. The studied revealed that two convergence tests implied no significant
evidence. Finally, Lam and Lam (2005) adopted both the growth accounting approach
and the Divisia aggregation method to estimate the total factor productivity (TFP)
growth of the Hong Kong Telephone Company (HKTC) during 1964 to 1998. The
TFP of HKTC was estimated to be from 2.31% to 3.56% per year in the study period.
The above studies of efficiency and productivity can be found that the DEA and
Malmquist index approach were used more frequent than other methodologies for the
evaluation of business performance. Unlike the SFA, the DEA and Malmquist
approaches do not have to involve the detailed operational revenue/cost information
and are feasible to be adopted in the current study. In particular, telecommunications
operators are reluctant to publicize revenue/cost data due to the fierce competition in
the market. As resulted, extensive studies obtained the needed data from the available
published information such as the annual reports of operators and surveys of
governments.
3. Research Methodology
3.1 Data envelopment analysis
The data envelopment analysis (DEA) approach is a non-parametric technique,
which is based on linear programming, for measuring and evaluating the relative
efficiencies of a set of entities with common inputs and outputs. It combines multiple
outputs and inputs to construct a single measure of relative efficiency across similar
organizational units, which are regarded as DMU. The characteristic of DEA is that it
treats each DMU individually and estimates the weighs for the inputs and outputs that
maximize the DMU's efficiency. It is unlike regression approaches in which the same
weights are applied to all DMUs to produce one output measure; therefore, it can
avoid the subjective deviations. Further, the advantage of DEA over other forms of
production or cost efficiency measurement is that the prior assumption of the
production function is not required while using DEA. The DEA can establish an
efficiency frontier which consists of the efficient DMUs with the optimal levels of
outputs for given levels of inputs, and evaluates DMU’s efficiency relative to the
frontier. The DMU on the efficiency frontier is considered efficient if its outputs are
optimal for its inputs in comparison with the inputs and outputs of all comparable
DMUs. On contrast, the DMU placed inside the frontier is considered inefficient.
7. 7
DEA was first introduced by Charnes, Cooper and Rhodes (1978), known as the CCR
model, as a generalization of efficiency proposed by Farrell (1957). We assume that
there are n DMUs, and each DMU has m inputs to produce s output. This model
measures the relative efficiency ratio of a given DMU (ho) by the sum of its weighted
outputs to the sum of its weighted inputs. It can be formulated as follows, known as
input-oriented CCR model:
1
1
max
s
r ror
o m
i ioi
u y
h
v x
=
=
=
∑
∑
(1)
subject to
1
1
1
s
r rjr
m
i iji
u y
v x
=
=
≤
∑
∑
,
, 0, 1, , , 1, , , 1, ,r iu v i m j n r s≥= = =
where ho is the efficiency ratio of the DMUo; vi, ur are virtual multipliers (weights) for
the ith input and the rth output, respectively; m is the number of inputs, s is the
number of outputs and n is the number of DMUs; xio is the value of the input i for
DMUo, yro is the value of the output r for DMUo.
The equation (1) is fractional programming and has an infinite number of
solutions. It can be solved by adding an additional constraint 1
1
m
i ioi
v x=
=∑ . The form
then converts to the multiplier form of the DEA LP problem:
1
max
s
o r ror
h ym=
= ∑ (2)
subject to
1 1
0, for 1, ,
s m
r rj i ijr i
y v x j nm= =
− ≤ =∑ ∑ ,
1
1
m
i ioi
v x=
=∑ ,
, 0, for 1, , 1, ,iv i m r sγm ε≥ > = =>> .
To reflect the transformation, the variables from (u, v) has been replaced by (μ, ν).
ε is a non-Archimedean quantity defined to be smaller than any positive real number.
The dual form of equation (2) can be written as an equivalent envelopment form as
follows:
( )1 1
min
m s
o o ii r
h s sγθ ε − +
= =
=− +∑ ∑ (3)
subject to
1
for 1, ,
n
ij j i ioj
x s x i mλ θ−
=
+= =∑ ,
1
for 1, ,
n
rj j roj
y s y r sγλ +
=
−= =∑ ,
, , 0, >0, 1, ,j i rs s j nλ ε− +
≥ => .
where θo is the proportion of DMUo’s inputs needed to produce a quantity of outputs
equivalent to its benchmarked DMUs identified and weighted by the λj. si
-
and sr
+
are
the slack variables of input and output respectively. λj is a (n × 1) column vector of
constants and can indicate benchmarked DMUs of DMUo. If ho
*
= 1 is meant efficient
and ho
*
< 1 is meant inefficient where the symbol “*
” represents the optimal value.
However, the CCR model is calculated with the constant returns to scale (CRS)
8. 8
assumption. This assumption is not supportable in imperfectly competitive markets.
The BCC model proposed by Banker, Charnes and Cooper (1984) modifies the CCR
model by allowing variable returns to scale (VRS). The multiplier form of the BCC
model can be formulated as follows:
1
max
s
o r ro or
h y um=
= −∑ (4)
subject to
1 1
0 for 1, ,
s m
j i ij oi
y v x u j nγ γγ
m= =
− − ≤ =∑ ∑
1
1
m
i ioi
v x=
=∑
, 0 1, , 1, , free in signi ov for i m r s ugm e≥ > = =>>
where uo is an indicator of returns to scale for BCC model. Increasing returns to scale
for the DMUo if uo* < 0, decreasing returns to scale if uo* > 0 and constant
returns to scale if uo* = 0. We can also obtain the dual BCC model by adding the
constraint 1
1
n
jj
λ=
=∑ , the dual form of equation (4) can be formulated as follows:
( )1 1
min
m s
o o i ri r
h s sθ ε − +
= =
=− +∑ ∑ (5)
subject to
1
for 1, ,
n
ij j i ioj
x s x i mλ θ−
=
+= =∑ ,
+
1
= for 1, ,
n
j j oj
y s y r sγ γ γλ=
− =∑
1
1
n
jj
λ=
=∑ ,
, , 0, 0, for 1,j i rs s j nλ ε− +
≥ > =>
The Overall Technical Efficiency (OTE) from CCR model can be decomposed
into Pure Technical Efficiency (PTE) and Scale Efficiency (SE). The PTE can be
obtained from BCC model. We can measure the SE for a DMUo by using CCR and
BCC model as follow:
SE OTE PTE= (6)
If the ratio is equal to 1 then a DMUo is scale efficient, otherwise if the ratio is less
than one then a DMUo is scale inefficient.
Therefore, this study used the input-oriented CCR model and BCC model to
obtain the above-mentioned values of efficiency. The input-oriented model measures
how much less input might be saved to produce the same amount of output, and
output-oriented model measures how much more output might be produced by using
the same amount of input. This study considers the input-oriented because the outputs
of the telecommunications industry may be driven by the market factors and
competition, which beyond the control of the companies, whereas the companies may
have a better control over the inputs.
3.2 Malmquist productivity index
Malmquist index was first presented in consumer theory by Malmquist (1953),
who earlier constructed the quantity index as ratios of Shephard’s (1953) distance
function in consumer theory context and later for productivity analysis by Caves,
Christensen and Diewert (1982). Malmquist productivity index (MPI) presented by
Färe et al. (1992) is used to distinguish between changes in efficiency (catch-up) and
9. 9
changes in the production frontier (technical change or innovation) under constant
returns to scale (CRS) condition. In Färe, Grosskopf, Norris and Zhang (1994), the
catch-up component can be further decomposed into pure technical efficiency change
and scale efficiency change under variable returns to scale (VRS) condition. The
Malmquist index can be used to measure the productivity growth and technical
change in target achievement for an individual operational unit between periods as
improved efficiency relative to the benchmark frontier.
The MPI is defined to use the distance functions, and consider in time period t
that firms use inputs t n
X R+∈ to produce outputs t m
Y R+∈ . The production
technology in period t may be defined as }{( , ),t t
T X Y X can produce Y= .
According to Shephard (1970), the input/output distance function of a vector
( , )t t
X Y is:
{ }0 ( , ) inf ( , / ) for 1,2,3,...,t t t t t t
D X Y X Y T t Tθ θ= = ∈ =
The output distance function evaluates the ratio of t
Y , the maximum output under the
fixed input t
X and production technology t
T . A value of one will be obtained from
the distance function if Y is on the efficient frontier. Caves et al. (1982) defined the
Malmquist index of productivity change between time period t (base year) and time
period t+1 (final year), relative to the technology level at time period t:
( )
( )
1 1
0
0
0
,
,
t t t
t
t t t
D X Y
M
D X Y
+ +
=
Similarly, the Malmquist index of productivity change relative to technology at time
t+1 can be defined as
( )
( )
1 1 1
01
0 1
0
,
,
t t t
t
t t t
D X Y
M
D X Y
+ + +
+
+
=
In order to avoid choosing an arbitrary benchmark, Färe et al. (1992) used the
geometric mean of t
M and 1t
M +
to represent the MPI
1 1
1 2
1 1 1 1 1
0 0
1
0 0
( , , , | )
( , | ) () , |
( , | ) ( , | )
t t t t
o
t t t t t t
t t t t t t
M X Y X Y CRS
D X Y CRS D X Y CRS
D X Y CRS D X Y CRS
+ +
+ + + + +
+
=
⋅
.
This index is the geometric mean of two input-based Malmquist TFP indices.
(1) If 0M > 1, a positive Tfpch from period t to period t+1.
(2) If 0M < 1, a negative Tfpch from period t to period t+1.
According to Färe et al. (1992), the Malmquist Tfpch index can be decomposed
into technical change (Techch) and efficiency change (Effch), thus the equation can
be rewritten as:
1 1
0
1 1 1 1 1
0 0 0
1 1 1 1
0 0 0
( , , , | )
( , | ) ( , | ) ( , | )
( , | ) ( , | ) ( , | )
t t t t
t t t t t t t t t
t t t t t t t t t
M X Y X Y CRS
D X Y CRS D X Y CRS D X Y CRS
D X Y CRS D X Y CRS D X Y CRS
+ +
+ + + + +
+ + + +
=
⋅
10. 10
( )
( )
1 1 1
0
0
,
( )
,
t t t
t t t
D X Y CRS
Effch CRS
D X Y CRS
+ + +
=
1 1
0
1 1 1 1
0 0
( , | ) ( , | )
( )
( , | ) ( , | )
t t t t t t
o
t t t t t t
D X Y CRS D X Y CRS
Techch CRS
D X Y CRS D X Y CRS
+ +
+ + + +
= ⋅
The term Effch, also known as the “catching up index”, measures the changes in
relative position of a DMU to the production frontier between time period t and t+1
under CRS technology. Effch evaluates the efficiency of managerial manners or
decisions
(1) If Effch > 1, the managerial efficiency improved.
(2) If Effch < 1, the managerial efficiency worsen.
The term Techch, also known as “frontier productivity index”, shows the relative
distance between the frontiers and measures the change of frontiers between two
periods. It is therefore sometimes referred to as the technical change effect. Techch
measures the technical change of each DMU by calculating the geometric mean of the
technical change from t to t+1 on different input invested.
(1) If Techch > 1, the technology progressed.
(2) If Techch < 1, the technology regressed.
It is straightforward to relax the CRS assumption and assume VRS. Following Färe,
Grosskopf and Lovell (1994), the efficiency change under CRS can be further
decomposed into scale efficiency and pure technical efficiency under VRS.
( )
( )
1 1 1
0
0
,
( )
,
t t t
t t t
D X Y VRS
Pech VRS
D X Y VRS
+ + +
=
( ) ( )
( ) ( )
1 1 1 1 1 1
0 0
0 0
, ,
( )
, ,
t t t t t t
t t t t t t
D X Y CRS D X Y VRS
Sech VRS
D X Y CRS D X Y CRS
+ + + + + +
=
(1) If Pech(VRS) > 1, the efficiency improved.
(2) If Pech(VRS) < 1, the efficiency worsen.
(3) If Sech > 1, the DMU gets much closer to CRS, and its optimal productive scale
size in long-term from period t to period t+1.
(4) If Sech < 1, the DMU gets much far away from CRS and its optimal productive
scale size in long-term from period t to period t+1.
To sum up, the MPI can be decomposed into pure technical efficiency (Pech),
scale efficiency (Sech) and technical change (Techch). Their relations are summarized
as follow:
( )1 1
, , , ( ) ( )
( ) ( )
t t t t
iM Y X Y X Effch CRS Techch CRS
Pech VRS Sech Techch CRS
+ +
= ×
= × ×
3.3 Input and output variables
To examine an operator’s efficiency, many studies used total revenue
(Pentzaropoulos and Giokas, 2002; Lam and Lam, 2005; Tsai, Chen and Tzeng, 2006;
11. 11
Liao and González, 2009) and number of calls or minute of calls (Uri, 2000, 2001 and
2002) as the output variables. Nevertheless, both number of calls and minute of calls
are unavailable for most of the operators studied in the current analysis. Total
revenues and subscribers are the most frequently used output variables in the related
studies and they indicate the operating strengths and scales of an operator. Every
mobile telecommunications operator needs sufficiently large amounts of revenues and
subscribers to maintain its service operation of any scale. Subscribers of a mobile
operator are the number of users who use its mobile services. Total revenues of an
operator, defined as the operating revenues earned from the charge for these services,
reflect the technology-variation characteristics of mobile operator and, in particular,
the development of mobile market. However, not all of the operators would be willing
to publish their detailed revenues due to the fierce competition in the market; hence,
this study uses operating revenues (y1) and mobile subscribers (y2) as output variables
instead. As for input variables, the number of employees (x1), total assets (x2) and
capital expenditures (x3) are chosen in the study. Number of employees is referred to
as the manpower employed by mobile operators or by the mobile segment of
integrated business operators. It increases along with the operation scale of an
operator and it is an important input for mobile service provision. Without an
appropriate allocation of resources, redundant employees become burdens in
operator’s expenditure. Total assets are defined as the summation of current assets,
fixed assets, long-term investment, intangible assets and other investment in wireless
segment. Capital expenditures are the total expenditures for the purchases of property,
plant and equipment, intangible assets and other assets in one year of the wireless
segment. Capital expenditures, used as investments, are fundamental to mobile
communication industry and significantly affect call quality such as coverage of
services, transmission speed, and network capacity. With more investments an
operator can expand its system and improve its service, resulting high quality of
services in turn attracts more subscribers and increases its revenues. Therefore, the
number of employees (x1), total asset (x2) and capital expenditures (x3) are used as
input variables in the DEA and Malmquist index.
4. Empirical Results
4.1 Data collection
The study analyzes 28 major mobile operators in APEC: Telstra and Optus in
Australia; Bell Wireless and Rogers Wireless in Canada; China Mobile and China
Unicom in China; CSL in Hong Kong; NTT DoCoMo and KDDI in Japan; SK
Telecom and KT Freetel in Korea; Celcom in Malaysia; America Movil’s Telcel and
Telefonica’s Movistar in Mexico; Telkomsel and Indosat in Indonesia; New Zealand
Telecom in New Zealand; SingTel in Singapore; Smart Communications and Globe
Telecom in Philippines; MTS and VimpelCom in Russia; Chunghwa Telecom (CHT)
and Taiwan Mobile (TMB) in Taiwan; Advanced Info Service (AIS) and Total Access
Communication (DTAC) in Thailand; Verizon Wireless and AT&T Mobility in the
U.S.
12. 12
The operating and financial data was mainly obtained from these operators’
annual reports and the surveys released from telecommunications authorities and
associations. The units of currencies of these data are transferred into US dollars by
using the exchange rates announced by the Federal Reserve Bank of New York on the
last business day of the fiscal years. It is noticeable that a fiscal year for the operators
in Japan, Singapore and Optus in Australia ends on March 31 and for Telstra in
Australia ends on June 30. Most importantly, in order to measure the efficiency of
operators exclusively for mobile services, the data of integrated business operators
which operate both fixed-line and mobile businesses used in this study were
calculated by mobile revenue proportion of total telecommunications revenue.
4.2 Efficiency comparison
In this section, the values of technical efficiency (TE) and pure technical
efficiency (PTE) are calculated. Then scale efficiency (SE), returns to scale and
frequency of occurrence are obtained. The TE in the CCR model for each DMU can
be decomposed into PTE and SE. Returns to scale address the input and output
decisions of an operator. Constant return to scale (CRS) occurs when scale efficiency
is equal to 1, which implies that operator’s production is under the optimal level and a
proportionate increase in inputs increases output by the same proportion. A number of
factors including, for example, imperfect competition and regulation, may cause
suboptimal production.
If scale efficiency is less than one, there is scale inefficiency due to increasing
return to scale or decreasing return to scale. When it is increasing returns to scale,
operator should increase its input resource, such as raising number of employees
and/or capital expenditures, to move into constant return to scale region; contrariwise
in decreasing returns to scale. Frequency of occurrence refers to the frequencies with
which fully efficient operators appear in the reference sets of the remaining mobile
carriers. These fully efficient operators could be considered as the benchmarks and
they are useful as good examples of efficiency improvement for inefficient ones.
The average efficiency for the APEC mobile operators during 2003-2008 is in
Tables 1. First of all, three operators, Telkomsel, KDDI and Smart Communication,
were fully efficient with all the values of TE, PTE and SE equal to 1 throughout the
study period. This reveals that the usage of inputs and operating scale for these
operators were well performed as compared to the mobile operators in APEC. The
two economies, Indonesia and Philippines, have showed moderate developments in
the last decade with the economic growths of 3.1% and 4.3% on average (The World
Bank, 2009), even though they suffered from local political turbulence.4
However,
Indonesian mobile market experienced a fast expanding phase during 2003 to 2008
4
Since the end of the New Order government in 1999, terrorism has become the most serious issue in Indonesia.
Many bombing attacks occurred during 2003 to nowadays. For example, blasts on the tourist island of Bali had
killed 202 people, and a powerful bomb exploded near the Australian embassy in central Jakarta killing 10
Indonesians and wounding more than 100 in 2004. Besides, there were some independent movements, such as
the free Aceh movement. They were a separatist group seeking independence for the Aceh region of Sumatra and
fought against Indonesian government forces in the Aceh insurgency from 1976 to 2005, costing over 15,000
lives.
Terrorism in the Philippines is conflicts based on political issues conducted by rebel organizations against
the Philippine government, its citizens and supporters. Most terrorism in the country is conducted by Islamic
terrorist groups. There were some attacked activities. For example, “Davao international airport bombing”, a
homemade bomb exploded at the Davao international airport killing at least 21 and wounding at least 146 in
2003 and “Valentine’s day bombings”, three bomb attacks took place in Makati city, killing up to 8 people and
injuring dozens, possibly up to 150.
13. 13
and its penetration rate rose from 8.7% to 61.8%. Telkomsel had drastic increases in
subscriber and revenue with the respective growth rates of 580% and 155%. Similarly,
Smart Communication expanded its subscriber and revenue with the growth rates of
172 % and 70%, respectively. Contrarily to these two operators, KDDI only had
moderate increases in asset, capital expenditure and employee by 34%, 131% and
36%, respectively. But, its revenue and subscriber increased by 70% and 74%,
respectively. Hence, KDDI was identified as principal benchmarks within the current
set of operators and had the highest frequency of occurrence in 2003, 2004, 2006 and
2007. To produce the same amount of output, these three operators used relatively few
inputs because of the adoptions of efficient managerial strategies and resource
allocation. Therefore, they were efficient for the six consecutive years.
In addition, Optus, KTF, China Unicom, SingTel, CHT and TWM demonstrated
full efficiency in four or five years during 2003 to 2008. China Unicom was fully
efficient during 2003 to 2007 and had the highest frequency of occurrence in 2004
and 2005. China Unicom, providing mobile services in most provinces in Mainland
China, is the first NASDAQ-listed China telecommunications company that went
public in 2004. Its operating performance was steadily well during 2003 to 2007 with
the 78% increases both in revenue and subscriber. Its inputs of asset, capital
expenditure and employee showed moderate increases with 17%, 108% and 70%,
respectively. It is noticeable that, in 2008, its CDMA businesses were split and
merged into China Telecom, resulting in a sharp decrease of 18% in subscriber. At the
same time, because of its infrastructure investment in the WCDMA system of 3G
service, asset increased by 60%, capital expenditure increased by 122%, and
employee increased by 9.5%. Hence, technical efficiency of China Unicom in 2008
drastically deteriorated to 0.522. Next, KTF was identified as principal benchmarks in
2004, 2005, 2006, and 2008, and its efficiency scores were steadily high. The reason
was that Korea and Japan pioneer global mobile markets with technology progress in
CDMA2000 1x EV-DO and with versatile multimedia services.
On the other hand, Telstra, Rogers Wireless, Bell Wireless, Verizon Wireless and
AT&T Mobility were the ones with the technical efficiency of less than 0.6 on
average during 2003 to 2008. In particular, Telstra had the lowest efficiency of 0.531
on average. Telstra’s inputs of asset, capital expenditure and employee increased by
66.22%, 74.27% and 55.56%, but its revenue and subscriber only increased by
23.89% and 42.11%. Rogers Wireless and Bell Wireless, the largest two mobile
operators in Canada, showed relatively low efficiency in operating performance. For
instance, Roger Wireless’ inputs of asset, capital expenditure and employee grew by
183.98%, 138.07% and 136.99%, respectively. Similar cases applied to AT&T
Mobility and Verizon Wireless in the U.S., in which AT&T Mobility’s inputs of asset,
capital expenditure and employee grew by 339.34%, 296.87% and 88.57%,
respectively.
In sum, these five less efficient operators all faced the same three market
conditions: widespread territory with sparse population, market saturation and fierce
competition. First; as a widespread territory, there are some possible reasons to drive
operators operating inefficient. For example, the investment on a vast geographic
market territory was costly. Also, the network upgrade and service operation were
restricted in widespread territories with sparse population, making the rate of return
on investment to be low. Second, full or close to full saturation did not provide
enough incentive drives for the growth in revenue and subscriber. Mobile penetrations
in Australia, Canada and the U.S. were 104.9%, 64.5% and 86.8% in 2008,
14. 14
respectively. Finally, fierce competition between operators also drove down the
markup of mobile services. In addition, it induced a great pressure on lowering the
tariffs but increasing the investment in employee input and system/equipment upgrade
in order to maintain the cutting-edge advantage in the telecommunications market.
Hence, there incurred a significant impact on service revenues of telecommunications
operators. Consequently, the increase in service revenues driven by remarkable
increase of mobile subscribers in recent years cannot be offset by the reduction in
profit margin.
Table 1 Average efficiency for the APEC mobile operators during 2003-2008
Member DMU
Technical
efficiency
(CCR)
Pure
technical
efficiency
(BCC)
Scale
efficiency
Frequency
of
occurrence
Australia
Telstra 0.531 0.534 0.994 0.000
Optus 0.946 0.968 0.977 4.667
Indonesia
Telkomsel 1.000 1.000 1.000 7.333
Indosat 0.601 0.674 0.890 0.000
Hong Kong CSL 0.763 0.898 0.845 1.000
Japan
NTT DoCoMo 0.870 1.000 0.870 0.000
KDDI 1.000 1.000 1.000 13.167
Korea
SKT 0.939 0.969 0.970 2.000
KTF 1.000 1.000 1.000 3.167
Malaysia Celcom 0.613 0.648 0.946 0.000
New
Zealand
Telecom New
Zealand
0.737 0.997 0.739 0.000
China
China Mobile 0.660 1.000 0.660 0.000
China Unicom 0.920 0.981 0.932 9.000
Singapore SingTel 0.985 1.000 0.985 4.333
Taiwan
CHT 0.963 0.965 0.997 3.667
TMB 0.991 1.000 0.991 3.667
Thailand
AIS 0.835 0.858 0.973 1.000
DTAC 0.761 0.841 0.905 0.000
Philippines
Smart
Communication
1.000 1.000 1.000 4.333
Globe Telecom 0.888 0.959 0.923 1.667
Russian
MTS 0.836 0.855 0.978 0.000
Vimpelcom 0.723 0.732 0.988 0.000
Canada
Rogers Wireless 0.568 0.607 0.940 0.000
Bell Wireless 0.593 0.648 0.927 0.000
Mexico
Telcel 0.879 0.927 0.948 0.333
Movistar 0.687 0.825 0.826 0.000
U.S.
Verizon Wireless 0.550 0.832 0.650 0.333
AT&T Mobility 0.584 0.927 0.636 0.000
15. 15
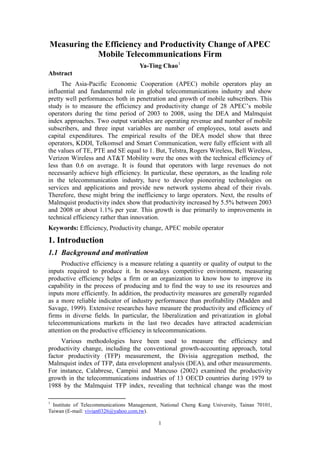
4.3 Productivity change comparison
In this section, the changes in productivity of APEC mobile operators over the
period 2003-2008 are computed by the Malmquist index. The software adopted is the
DEAP. The average values of technical change (Techch), efficiency change (Effch),
pure efficiency change (Pech), scale change (Sech), and total factor productivity
change (Tfpch) for each operator are reported in Table 2. The results of the analysis
indicate that the productivity for all the operators increased by 5.5% on average
(Tfpch = 1.055) during 2003 to 2008, equivalently about 1.1% per year. This growth
is due primarily to improvements in efficiency (Effch = 1.055) rather than innovation
(Techch = 1).
Of all the 28 operators in the APEC, 20 operators (Telstra, Optus, CSL, NTT
DoCoMo, KDDI, SKT, Telecom New Zealand, SingTel, CHT, DTAC, Vimpelcom,
AT&T Mobility, Telekomsel, Indosat, China Mobile, Smart Communication, Globe
Telecom, Rogers Wireless, Bell Wireless and Movistar) were operating efficiently as
measured by technical efficiency change relative to a constant return to scale
technology during 2003 to 2008. Of these 20 operators, 3 operators (Telstra, Optus
and CSL) displayed a constant technical efficiency change equal to 1. In contrast, the
efficiency of 8 operators (KTF, Celcom, TMB, AIS, MTS, Verizon Wireless, China
Unicom, Telcel) slightly declined. Smart Communication is the one of the highest
efficiency change of 1.801 on average. This large improvement in technical efficiency
by 80.1% was primarily driven by the 172% increase in subscriber during 2003 to
2008. Its marketing strategy of “Talk ‘N Text (TNT)” that offers unlimited calls
within the network increased its subscriber base by 17.3% from 2007 to 2008.
Technical change (Techch) displayed a substantial variability among the APEC
operators during 2003 to 2008, ranging from the value of 21.2 % (equivalently, 4.24
% annually for TMB) to that of -20.1 % (equivalently, -4.02 % annually for Globe
Telecom). Much of this variability is a reflection of the types of service being
provided, customer requirements, and competitive pressures in various market
segments to innovate. Finally, Smart Communication had the highest productivity
change of 1.918 during the study period (equivalently, 18.36% annually). But, Celcom
is the operator with the worst productivity change of only 0.77.
16. 16
Table 2 Malmquist index of average annual productivity change for APEC
mobile operators during the time period of 2003–2008
Member DMU Effch1
Techch2
Pech3
Sech4
Tfpch5
Australia
Telstra 1.000 0.904 1.000 1.000 0.904
Optus 1.000 1.032 1.000 1.000 1.032
Indonesia
Telkomsel 1.172 0.910 1.199 0.978 1.066
Indosat 1.488 0.939 1.325 1.123 1.398
Hong
Kong
CSL
1.000 1.041 1.000 1.000 1.041
Japan
NTT DoCoMo 1.067 0.938 0.988 1.080 1.001
KDDI 1.152 0.902 1.150 1.002 1.039
Korea
SKT 1.206 0.982 1.239 0.974 1.184
KTF 0.905 0.968 0.953 0.950 0.876
Malaysia Celcom 0.774 0.995 1.060 0.730 0.770
New
Zealand
Telecom New
Zealand
1.145 1.119 1.000 1.145 1.281
China
China Mobile 1.028 0.922 1.085 0.948 0.947
China Unicom 0.912 0.946 0.790 1.155 0.863
Singapore SingTel 1.078 0.844 1.000 1.078 0.910
Taiwan
CHT 1.004 1.019 1.000 1.004 1.023
TMB 0.749 1.212 0.852 0.879 0.908
Thailand
AIS 0.872 1.177 0.973 0.897 1.027
DTAC 1.116 0.941 1.000 1.116 1.051
Philippines
Smart
Communication
1.801 1.065 1.277 1.410 1.918
Globe Telecom 1.036 0.799 1.024 1.012 0.827
Russian
MTS 0.845 1.140 1.000 0.845 0.963
Vimpelcom 1.109 1.168 1.000 1.109 1.295
Canada
Rogers Wireless 1.167 1.065 1.050 1.112 1.244
Bell Wireless 1.007 1.061 1.001 1.006 1.068
Mexico
Telcel 0.966 0.853 0.919 1.051 0.824
Movistar 1.463 0.922 1.150 1.272 1.348
U.S.A.
Verizon Wireless 0.990 1.122 1.000 0.990 1.111
AT&T Mobility 1.012 1.193 1.000 1.012 1.207
Average 1.055 1.000 1.031 1.023 1.055
Note: 1. “Effch” is technical efficiency change relative to constant returns to scale technology.
2. “Techch” is technological change.
3. “Pech” is pure technical efficiency change (i.e., relative to a variable returns to scale
technology).
4. “Sech” is scale efficiency change.
5. “Tfpch” is the Malmquist index measuring total factor productivity (TFP) change.
5. Concluding Remarks
The existing efficiency and productivity studies on telecommunications industry
mainly analyzed fixed-line operators or integrated operators (see, for example, Lee,
Park and Oh, 2000; Uri, 2000 and 2002; Facanha and Resende, 2004; Lam and Lam,
2005; Tsai, Chen and Tzeng, 2006), but few focused on mobile operators or mobile
sector of integrated operators. This study has analyzed the relative efficiency,
productivity growth of 28 mobile operators in APEC over the time period of 2003 to
17. 17
2008 using the methodologies of DEA and Malmquist index. This study provides one
contribution to the existing literature. There are sufficient DMUs used in this
cross-country and cross-period study, i.e., 28 APEC mobile operators for the research
period of six years, as compared to the related studies. A large number of 168 DMUs
used in the analysis are to provide the results with higher discriminating power.5
The
objects of telecommunications studies on efficiency measurement and productivity
growth can approximately be divided into two categories: (1) single operator for a
period of time and/or its regional operating centers at a particular time when
experiencing different types of regulations, business reform and liberalization
(Sueyoshi, 1998; Giokas and Pentzaropoulos, 2000; Lam and Lam, 2005); (2)
multiple operators at a particular time and/or for a period of time when comparing
them from international perspective or overall telecommunications industry of
countries (Tsai, Chen and Tzeng, 2006; Lam and Shiu, 2008; Sastry, 2009; Yang and
Chang, 2009). There are some limitations within this literature. The former one did
not compare the object with other competing operators, and the latter one did not
consider factors such as national development, mobile communication technology and
application, market size, cultural, and usage habit of mobile services. Further, some
studies compared mobile operators with integrated service operators (Tsai, Chen and
Tzeng, 2006), and thus, the results might have possible bias.
The empirical results of this study can be summarized by the following two parts.
In the DEA model, three operators, KDDI, Telkomsel and Smart Communication,
were fully efficient with all the values of TE, PTE and SE equal to 1 throughout the
study period. This result is supported by those in Tsai, Chen and Tzeng (2006) and
Liao and Lin (2008), in which KDDI was also found to be efficient among leading
telecom operators in Forbes 2000 in 2003 and among Japan’s and Korea’s markets
during 2002 to 2006, respectively. On the other hand, Telstra, Rogers Wireless, Bell
Wireless, Verizon Wireless and AT&T Mobility were the ones with the technical
efficiency of less than 0.6 on average during 2003 to 2008. Similarly, Tsai, Chen and
Tzeng (2006) found that AT&T Mobility and Bell Wireless were inefficient operators
among leading telecom operators in Forbes 2000. Noticeable, Telstra was the least
efficient operators in this study but performed fully efficiently in the study of Tsai,
Chen and Tzeng (2006). The difference lied on that mobile segment of Telstra was
analyzed in this study and its integrated services were analyzed in Tsai, Chen and
Tzeng (2006).
In addition, operators in the market with vast geographic territory, such as MTS
and Vimpelcom in Russia, Rogers Wireless and Bell Wireless in Canada, Verizon
Wireless and AT&T Mobility in U.S. were usually inefficient. Labor redundancy and
input misallocation were the main factors attributing efficiency deterioration. This
study also finds that operators with large revenues do not necessarily achieve high
efficiency. In particular, these operators, as the leading role in the telecommunication
industry, have to develop pioneering technologies on services and applications and
provide new network systems ahead of their rivals. Therefore, these actions might
bring the inefficiency to large operators. This result is supported by those in
Pentzaropoulos and Giokas (2002), Finnish operator, Sonera Telecom, was more
efficient than British Telcom and France Telecom. For instance, the revenue scales of
Verizon Wireless and AT&T Mobility are the largest among 28 mobile operators in
5
For example, an important experienced rule of thumb when using DEA, is that the number of DMUs
is at least twice the sum of the number of inputs and that number plus outputs. Otherwise, the model
may produce numerous relatively efficient units and decrease discriminating power.
18. 18
this study, but they revealed inefficient performance, which were only higher than
Telstra.
In the Malmquist productivity index, the results showed that productivity
increased by 5.5% between 2003 and 2008 or about 1.1% per year. This growth is due
primarily to improvements in technical efficiency rather than innovation. This result is
different from Uri (2002), in which overall productivity of 19 LECs in the United
States increased primarily due to technology innovation. The reason may lie on the
differences in variable selection in the analyses. Total revenues and subscribers were
used as output variables in this study, and volumes of different services (e.g., local call,
intrastate call and interstate call) were used as output variables in Uri (2002).
Further, of all the 28 operators in the study, 20 operators (Telstra, Optus, CSL,
NTT DoCoMo, KDDI, SKT, Telecom New Zealand, SingTel, CHT, DTAC,
Vimpelcom, AT&T Mobility, Telekomsel, Indosat, China Mobile, Smart
Communication, Globe Telecom, Rogers Wireless, Bell Wireless and Movistar) were
operating efficiently as measured by technical efficiency change relative to a constant
return to scale technology during 2003 to 2008. Of these 20 operators, 3 operators
(Telstra, Optus and CSL) displayed a constant efficiency change equal to 1. In
contrast, the efficiency of remaining 8 operators (KTF, Celcom, TMB, AIS, MTS,
Verizon Wireless, China Unicom and Telcel) slightly declined.
References
1. AIS (2009), “Annual reports 2003-2008”, available at: http://investor.ais.co.th/
AricleListAISIRNews.aspx?mid=77
2. America Movil (2009), “Annual reports 2003-2008”, available at: http://www.
americamovil.com/
3. American Telephone & Telegraph (AT&T) (2009), “Annual reports 2003-2008”,
available at: http://www.att.com/gen/ investor-relations?pid=5691
4. Asia-Pacific Economic Cooperation (APEC) (2008), available at:
http://www.apec.org/
5. Banker, R.D., Charnes, A. and Cooper, W.W. (1984), “Some models for
estimating technical and scale inefficiencies in data envelopment analysis”,
Management Science, Vol. 30, No. 9, pp. 1078-1092.
6. Bell Canada Enterprise (2009), “Annual reports 2003-2008”, available at:
http://www.bce.ca/en/investors/financialperformance/annualreporting
7. Beeline (2009), “Annual reports 2003-2008”, available at: http://www.vimpelcom.
com/investor/reports.wbp
8. Business Monitor International Ltd. (2009), “United States telecommunications
report Q3 2009”, available at: http://www.businessmonitor.com/
9. Calabrese, A., Campisi, D., and Mancuso, P. (2002), “Productivity change in the
telecommunications industries of 13 OECD countries”, International Journal of
Business and Economics, Vol. 1, No. 3, pp. 209-223.
10. Caves, D., Christensen, L., and Diewert, W. (1982). “The economic theory of
index numbers and the measurement of input, output, and productivity”,
Econometrica, Vol. 50, No. 6, pp. 1393-1414.
11. Charnes, A., Cooper, W.W., and Rhodes, E. (1978), “Measuring the efficiency of
19. 19
decision making units”, European Journal of Operations Research, Vol. 2, No. 6,
pp. 429-446.
12. China Mobile (2009), “Annual reports 2003-2008”, available at: http://www.
chinamobileltd.com/ir.php?menu=3
13. China Unicom (2009), “Annual reports 2003-2008”, available at: http://www.
chinaunicom.com.hk/tc/investor/ir_report.html
14. Chunghwa Telecom (CHT) (2009), “Annual reports 2003-2008”, available at:
http://www.cht.com.tw/
15. CSL (2009), “Annual reports 2003-2008”, available at: http://telstra.com/index.
jsp?SMIDENTITY=NO
16. DeCarlo, S. (2009). “The world's biggest public companies”, Forbes Asia, Vol. 5,
No. 7, April 27, pp. 34-35, available at:
http://www.forbes.com/lists/2009/18/global-09_ The-Global-2000_Rank.html
17. Facanha, L.O. and Resende, M. (2004), “Price cap regulation, incentives and
quality: The case of Brazilian telecommunications”, International Journal of
Production Economics, Vol. 92, No. 2, pp. 133-144.
18. Färe, R., Grosskopf, S., Lindgren, B., and Roos, P. (1992), “Productivity changes
in Swedish pharmacies 1980-1989: A non-parametric approach”, Journal of
Productivity Analysis, Vol. 3, No. 1-2, pp. 85–101.
19. Färe, R., Grosskopf, S., Norris, M., and Zhang, Z. (1994), “Productivity growth,
technical progress and efficiency change in industrialized countries,” American
Economic Review, Vol. 84, No. 1, pp. 66-83.
20. Farrell, M.J. (1957), “The measurement of productive efficiency”, Journal of the
Royal Statistical Society, Vol. 120, No. 3, pp. 253-290.
21. Giokas, D.I. and Pentzaropoulos, G.C. (2000), “Evaluation productivity efficiency
in telecommunications: Evidence from Greece”, Telecommunications Policy, Vol.
24, No. 8-9, pp. 781-794.
22. Globe Telecom (2009), “Annual reports 2003-2008”, available at:
http://site.globe.com.
ph/about_globe/about_us/investor_relations/reports?sid=S3uSN8uxpRYAABxH2J
YAAACce
23. Indian Council for Research on International Economic Relations (ICRIER)
(2009), “India: The impact of mobile phones”, available at:
http://www.icrier.org/page.asp? MenuID=5&SubCatId=174&SubSubCatId=663
24. Indosat (2009), “Annual reports 2003-2008”, available at:
http://www.indosat.com/ Investor_Relations
25. Internation Telecommunication Union (ITU) (2009), “Mobile celluar
subscriptions 2003-2008”, available at: http://www.itu.int/ITU-D/ict/index.html
26. Kokusai Denshin Denwa Inc (KDDI) (2009), “Annual reports 2003-2008”,
available at: http://www.kddi.com/English/corporate/ir/library/annual_report/
index.html
27. Korea Telecom Freetel (KTF) (2009), “Annual reports 2003-2008”, available at:
http://www.kt.com/eng/index.jsp
20. 20
28. Lam, P.L. and Lam, T. (2005), “Total factor productivity measures for Hong Kong
telephone”, Telecommunications Policy, Vol. 9, No. 1, pp. 53-68.
29. Lam, P.L. and Shiu, A. (2008), “Productivity analysis of the telecommunications
sector in China”, Telecommunications Policy, Vol. 32, No. 8, pp. 559-571.
30. Lee, Y.Y., Park, Y.T. and Oh, H.S. (2000), “The impact of competition on the
efficiency of public enterprise: The case of Korea Telecom”, Asia Pacific Journal
of Management, Vol. 17, No. 3, pp. 423-442.
31. LG Telecom (2009), “Annual reports 2003-2008”, available at:
http://www.lgtelecom. com/
32. Liao, C.H., and González, B.D. (2009), “Comparing operational efficiency of
mobile operators in Brazil, Russia, India and China”, China and World Economy,
Vol. 17, No. 5, pp. 104-120.
33. Liao, C.H., and Lin, H.Y. (2008), “Measuring operational efficiency of mobile
operators in Japan and Korea”, mimeograph.
34. Madden, G. and Savage, S.J. (1999), “Telecommunications productivity, catch-up
and innovation”, Telecommunications Policy, Vol. 23, No. 1, pp. 65-81.
35. Malmquist, S. (1953). “Index numbers and indifference curves”, Trabajos de
Estatistica, Vol.4, No. 1, pp.209-242.
36. Market Intelligence Center (MIC) (2008), “The analysis of mobile communication
market in Taiwan, China, Japan and Korea in first quarter of 2008”, available at:
http://mic.iii.org.tw/intelligence/.
37. Market Intelligence Center (MIC) (2009), “The prediction of worldwide mobile
subscribers of 2006-2013”, available at: http://mic.iii.org.tw/intelligence/.
38. Megafon (2009), “Annual reports 2003-2008”, available at: http://eng.megafon.ru/
company/invest/statements/
39. Nippon Telegraph and Telephone DoCoMo (NTT DoCoMo) (2009), “Annual
reports 2003-2008”, available at:
http://www.nttdocomo.co.jp/english/corporate/ir/library/ annual/index.html
40. Mobile TeleSystems (MTS) (2009), “Annual reports 2003-2008”, available at:
http://www.mtsgsm.com/ resources/annual_reports/
41. Pentzaropoulos, G.C. and Giokas, D.I. (2002), “Comparing the operational
efficiency of the main European telecommunications organizations: A quantitative
analysis”, Telecommunications Policy, Vol. 26, No. 11, pp. 595-606.
42. Philippine Long Distance Telephone (PLDT) (2009), “Annual reports 2003-2008”,
available at: http://www.pldt.com.ph/investor/Pages/AnnualReport.aspx
43. PMR (2008), “Russia’s mobile telephony market still on course for steady
growth”, available at: http://www.pmrpublications.com/
44. Rogers Wireless (2009), “Annual reports 2003-2008”, available at:
http://www.rogers.com/web/Rogers.portal?_nfpb=true&_windowLabel=investor_
1_1&investor_1_1_actionOverride=%252Fportlets%252Fconsumer%252Finvesto
r%252FshowLandingPageAction&_pageLabel=IR_LANDING
45. Sastry, P. (2009), “Identifying leaders and laggards -A method and application to
US local telephone companies”, Telecommunications Policy, Vol. 33, No. 3-4, pp.
21. 21
146-163.
46. Shephard, R. W. (1953), Cost and Production Functions, Princeton: Princeton
University Press.
47. SinTel (2009), “Annual reports 2003-2008”, available at:
http://info.singtel.com/node/ 1788
48. SK Telecom (2009), “Annual reports 2003-2008”, available at: http://www.
sktelecom.com/eng/
49. Softbank Mobile (2009), “Annual reports 2003-2008”, available at: http://www.
softbankmobile.co.jp/en/info/finance/report/index.html
50. Sprint Nextel (2009), “Annual reports 2003-2008”, available at: http://investors.
sprint.com/phoenix.zhtml?c=127149&p=irol-reportsannual
51. Sueyoshi, T. (1998), “Privatization of Nippon Telegraph and Telephone: Was it a
good decision?”, European Journal of Operational Research, Vol. 107, No. 1, pp.
45-61.
52. Telekom Malaysia (2009), “Annual reports 2003-2008”, available at: http://www.
tm.com.my/about-tm/investor-relations/annual-reports/Pages/AnnualReport.aspx
53. Telecommunications Carriers Association (TCA) (2009), available at: http://www.
tca.or.jp/english/
54. Telecom New Zealand (2009), “Annual reports 2003-2008”, available at:
http://www. telecom.co.nz/homepage
55. Telefonica (2009), “Annual reports 2003-2008”, available at:
http://www.telefonica.
com/en/about_telefonica/html/publicaciones/informesanuales.shtml
56. Telekomsel (2009), “Annual reports 2003-2008”, available at:
http://www.telkomsel. com/web/annual_report
57. Telus Wireless (2009), “Annual reports 2003-2008”, available at:
http://about.telus. com/
58. Taiwan Mobile (TMB) (2009), “Annual reports 2003-2008”, available at:
http://www. taiwanmobile.com/
59. Telstra (2009), “Annual reports 2003-2008”, available at:
http://www.telstra.com.au/
60. The World Bank (2009), “World development report 2009”, available at:
http://www.worldbank.org/
61. Total Access Communication (DTAC) (2009), “Annual reports 2003-2008”,
available at: http://www.dtac.co.th/tha/ir /index_en.html
62. Tsai, H.C., Chen, C.M., and Tzeng, G.H. (2006), “The comparative productivity
efficiency for global telecoms”, International Journal of Production Economics,
Vol. 103, No. 2, pp. 509-526.
63. Uri, N.D. (2000), “Measuring productivity change in telecommunications”,
Telecommunications Policy, Vol. 24, No. 5, pp. 439-452.
64. Uri, N.D. (2001), “Measuring the impact of price caps on productive efficiency in
telecommunications in the United States,” The Engineering Economist, Vol. 46,
22. 22
No. 2, pp. 81-115.
65. Uri, N.D. (2002), “The measurement of the change in productivity in
telecommunications”, Telecommunications Systems, Vol. 20, No. 3, pp. 177-194.
66. Verizon Wireless (2009), “Annual reports 2003-2008”, available at: http://investor.
verizon.com/financial/quarterly/index.aspx
67. Vimpelcom (2009), “Annual reports 2003-2008”, available at:
http://www.vimpelcom. com/investor/reports.wbp
68. Yang, H.H. and Chang, C.Y. (2009), “Using DEA window analysis to measure
efficiencies of Taiwan’s integrated telecommunication firms”,
Telecommunications Policy, Vol. 33, No. 1-2, pp. 98-108.