
Empfohlen
Empfohlen
Weitere ähnliche Inhalte
Ähnlich wie Predicting Production Outages with Micro-Metrics
Ähnlich wie Predicting Production Outages with Micro-Metrics (20)
Mehr von Tier1 app
Mehr von Tier1 app (19)
Kürzlich hochgeladen
Kürzlich hochgeladen (20)
Predicting Production Outages with Micro-Metrics
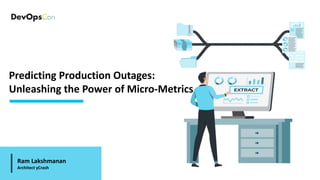
- 1. Predicting Production Outages: Unleashing the Power of Micro-Metrics Ram Lakshmanan Architect yCrash
- 3. 3 Memory of Healthy Application - Full Garbage Collection Event
- 4. 4 Acute Memory Leak - Full Garbage Collection Event
- 5. 5 Memory Leak - Full Garbage Collection Event
- 6. GC Throughput Micrometric Source: Garbage Collection Log
- 7. 7 What is GC Throughput? Amount of time application spends in processing customer transactions vs Amount of time application spends in processing garbage collection activity
- 8. 1. GC Log 10. netstat 12. vmstat 2. Thread Dump 9. dmesg 3. Heap Dump 6. ps 8. Disk Usage 5. top 13. iostat 11. ping 14. Kernel Params 15. App Logs 16. metadata 4. Heap Substitute 7. top -H 8 Open-source script: https://github.com/ycrash/yc-data-script 360° Troubleshooting artifacts
- 10. Application Architecture JDBC SOAP MainFrame REST Server Thread Pool Application Server HTTP(S) request 10
- 11. Application Architecture JDBC SOAP MainFrame REST Server Thread Pool Application Server HTTP(S) request 11
- 12. Threads with identical Stack trace Micrometric Source: Thread Dump
- 13. 13 Case Study Backend Slowdown in a Major Financial Institution in N. America
- 15. What Causes CPU to Spike? 15
- 16. top –H –p <PROCESS_ID>’ Secrete Option: 16 We all might have used ‘top’
- 17. Thread Level CPU consumption Micrometric Source: top –H –p <PROCESS_ID>
- 18. Case Study Major Trading app in N. America https://blog.fastthread.io/2020/04/23/troubleshooting-cpu-spike-in-a-major-trading-application/ 18
- 20. public void synchronized getData() { doSomething(); } Thread 1 Thread 2 Thread 1 BLOCKED THREADS Concurrency Problem 20
- 21. BLOCKED state threads Micrometric Source: Thread Dump
- 22. Case Study Major Leisure Travel Service Provider https://blog.ycrash.io/2022/03/09/java-uuid-generation-performance-impact/ 22
- 23. Predicting Poor Response Time
- 24. What is Garbage? HTTP Request Objects Memory Garbage 24
- 25. 25 3-4 Decades ago Developer Writes code to Manually evict Garbage JVM Automatically evicts Garbage Now How are objects Garbage Collected? Evolution: Manual -> Automatic
- 26. 26 Automatic GC sounds good right? Yes, but for GC pauses CPU consumption
- 27. 27 Application suffering from Consecutive Full GCs
- 28. 28 Long GC Pause Duration
- 29. GC Pause Time Micrometric Source: Garbage Collection Log
- 31. My App yCrash agent yCrash Server Container/Machine 1 Every 3 minutes Micro-Metrics* are captured 2 Metrics are transmitted 4 If problem forecasted, 360 ° data capture is triggered 3 ML, Patterns applied on the Micro-Metrics Cloud/On-premise 31 Micro-Metrics * 1. Garbage Collection Log 2. Thread Dump + top –H 3. Application Log Micro-Metrics Monitoring Architecture
- 32. 1. GC Log 10. netstat 12. vmstat 2. Thread Dump 9. dmesg 3. Heap Dump 6. ps 8. Disk Usage 5. top 13. iostat 11. ping 14. Kernel Params 15. App Logs 16. metadata 4. Heap Substitute 7. top -H 32 Open-source script: https://github.com/ycrash/yc-data-script 360° Troubleshooting artifacts
- 33. Ram Lakshmanan ram@tier1app.com @tier1app https://www.linkedin.com/company/ycrash This deck will be published in: https://blog.ycrash.io If you want to learn more … 33 THANK YOU FRIENDS
Hinweis der Redaktion
- http://localhost:8080/yc-report.jsp?ou=SAP&de=198.134.23.1&app=yc&ts=2023-06-11T22-56-32
- http://localhost:8080/yc-report.jsp?ou=SAP&de=32.123.89.12&app=yc&ts=2023-06-11T23-54-10
- http://localhost:8080/yc-report.jsp?ou=SAP&de=90.21.123.19&app=yc&ts=2023-12-03T19-11-33