SlideShare ist ein Scribd-Unternehmen logo
1 von 11
Downloaden Sie, um offline zu lesen
Real Estate Development Financial Model
Author: Imran Almaleh
Date: August 23, 2014
Jumeirah Village Circle, Dubai
Phone: (971) 52 940 6601
Email: imranalmaleh@gmail.com
Summary
The purpose of this spreadsheet model is to determine the financial feasibility of a development project of
the subject property for a 10 year holding period. The uncertainty in this model lies in the many construction
& economic factors. The most important assumptions in this analysis are the Net Operating Income
assumptions (Annual Gross Rent, Vacany, and Operating Expenses) and the Cap Rates. Special attention
should be given to these assumptions.
Keywords: Real Estate, Property Valuation, Dubai
Project Overview
PROJECT SUMMARY
Project Discription: A multi-story Mix use retail/residential building in JVC
Building Uses:
Retail 6,050 SqFt 10%
Multi-Family Residential 54,450 SqFt 90%
Total Gross Square Footage: 60,500 SqFt
Site size: 24,200 SqFt
Floor-Area Ratio (FAR) 2.5 :1
Total Project Budget 18,847,691 Dhs
Sources & Uses of Funds
Sources Amount %Own. Uses Amount
Investors Equity 10,000,000 53% Land Costs 14,200,000
Developer Equity 8,847,691 47% Hard Construction Cost 1,786,800
Tenant Improvements 1,000,000
Soft Costs 1,555,101
Contengency 305,790
Total 18,847,691 Total 18,847,691
Investor Returns
NPV IRR
1 Year (4,095,880) -0.3%
5 Year 1,739,942 11.9%
10 Year 6,980,295 14.6%
Cash Flow Projection Model Formating
Red Requires further attention
Depreciation Period (whole project) 30 years Blue Input cells
Green Cells linked to another sheet
Black Cells containing a title or calculation on the same sheet
Year number
Design &
Construction 1
Design &
Construction 2
Design &
Construction 3 1 2 3 4 5 6 7 8 9 10
Year 2015 2016 2017 2018 2019 2020 2021 2022 2023 2024 2025 2026 2027
Income
Gross Operating Income 3,416,405 3,518,897 3,624,464 3,733,198 3,845,194 3,960,550 4,079,366 4,201,747 4,327,800 4,457,634
Operating Expences (Paid by tenents)
Retail Tenents 88,580 90,352 92,159 94,002 95,882 97,800 99,756 101,751 103,786 105,862
Residential Tenents 2,001,332 2,041,358 2,082,186 2,123,829 2,166,306 2,209,632 2,253,825 2,298,901 2,344,879 2,391,777
Total - - - 5,506,317 5,650,607 5,798,809 5,951,029 6,107,382 6,267,981 6,432,947 6,602,399 6,776,465 6,955,272
Expenses
Construction Costs (2,323,845) (1,394,307) (929,538)
Land Cost (14,200,000)
Operating Expenses (2,089,912) (2,131,710) (2,174,344) (2,217,831) (2,262,188) (2,307,432) (2,353,580) (2,400,652) (2,448,665) (2,497,638)
Draw Against Investors Equity 10,000,000
Draw Against Developers Equity 6,523,845 1,394,307 929,538
Total - - - (2,089,912) (2,131,710) (2,174,344) (2,217,831) (2,262,188) (2,307,432) (2,353,580) (2,400,652) (2,448,665) (2,497,638)
Net Cash Flow - - - 3,416,405 3,518,897 3,624,464 3,733,198 3,845,194 3,960,550 4,079,366 4,201,747 4,327,800 4,457,634
Depritiation (628,256) (628,256) (628,256) (628,256) (628,256) (628,256) (628,256) (628,256) (628,256) (628,256)
Net Profit - - - 2,788,149 2,890,641 2,996,208 3,104,942 3,216,938 3,332,293 3,451,110 3,573,491 3,699,543 3,829,377
Building Mix Model Formating
Red Requires further attention
Blue Input cells
Green Cells linked to another sheet
Black Cells containing a title or calculation on the same sheet
Retail area 6,050 SqFt
Residential area 54,450 SqFt
total 60,500 SqFt
Retail Size (SqFt) % Allocation # of Shops Total Area Rent (Dhs) Total Rent
Shop style A 500 45% 5 2,500 65,000 325,000
Shop style B 1100 55% 3 3,300 125,000 375,000
Total 100% 8 5,800 190,000 700,000
Aditional Area (SqFt) 250
Residential Size (SqFt) % Allocation # of Units Total Area Rent (Dhs) Total Rent
Studio 500 15% 16 8,000 47,000 752,000
1 BHK 1 BR 800 20% 13 10,400 60,000 780,000
1 BHK 2 BR 850 10% 6 5,100 64,000 384,000
2 BHK 1 BR 950 25% 14 13,300 67,000 938,000
2 BHK 2 BR 1100 20% 9 9,900 71,000 639,000
3 BHK 2 BR 1600 10% 3 4,800 78,000 234,000
Total 100% 61 51,500 387,000 3,727,000
Aditional Area (SqFt) 2,950
Rent Per SqFt 77.26
Retail 115.70 Dhs
Residential 68.45 Dhs
Investor Returns Model Formating
Red Requires further attention
Blue Input cells
Green Cells linked to another sheet
Black Cells containing a title or calculation on the same sheet
Year Developers Equity Investors Equity Net Profit
Total Profit -
Sale at year 1
Total Profit -
Sale at year 5
Total Profit -
Sale at year 10
Design & Construction 1 (6,523,845) (10,000,000) - (16,523,845) (16,523,845) (16,523,845)
Design & Construction 2 (1,394,307) - - (1,394,307) (1,394,307) (1,394,307)
Design & Construction 3 (929,538) - - (929,538) (929,538) (929,538)
1 2,788,149 18,706,065 2,788,149 2,788,149
2 2,890,641 2,890,641 2,890,641
3 2,996,208 2,996,208 2,996,208
4 3,104,942 3,104,942 3,104,942
5 3,216,938 24,926,734 3,216,938
6 3,332,293 3,332,293
7 3,451,110 3,451,110
8 3,573,491 3,573,491
9 3,699,543 3,699,543
10 3,829,377 35,189,303
IRR and NPV Calculations
IRR Sell at Year 1 -0.3%
Sell at Year 5 11.9%
Sell at Year 10 14.6%
NPV at 10% Sell at Year 1 (4,095,880)
Sell at Year 5 1,739,942
Sell at Year 10 6,980,295
Invester Return Assuming Sale At Year 1 At Year 5 At Year 10
Net Operating Income 1,326,493 1,583,006 1,959,995
Terminal Cap Rate 8.00% 7.0% 6.0%
Fair Market Value 16,581,163 22,614,371 32,666,589
Cost of Sale 4% 663,247 904,575 1,306,664
Sale Price Realized 15,917,916 21,709,796 31,359,925
Project Equity 15,917,916 21,709,796 31,359,925
ROI
Investors 84% 115% 166%
Developers 84% 115% 166%
Operating Income Model Formating
Red Requires further attention
Blue Input cells
Green Cells linked to another sheet
Rentable SqFt Factor 85% Black Cells containing a title or calculation on the same sheet
Retail Rent/SqFt Rentable SqFt Annual Rent
115.70 5142.5 595,000
Vacancy 5% (29,750)
Gross Operating income 565,250
Residential Rent/SqFt Rentable SqFt Annual Rent
68.45 46282.5 3,167,950
Vacancy 10% (316,795)
Gross Operating income 2,851,155
Total 3,416,405 Dhs
Operating Income Forecast 1 2 3 4 5 6 7 8 9 10
Retail 595,000 612,850 631,236 650,173 669,678 689,768 710,461 731,775 753,728 776,340
Residential 3,167,950 3,262,989 3,360,878 3,461,704 3,565,556 3,672,522 3,782,698 3,896,179 4,013,064 4,133,456
Retail - Loss to Vacancy (29,750) (30,643) (31,562) (32,509) (33,484) (34,488) (35,523) (36,589) (37,686) (38,817)
Residential - Loss to Vacancy (316,795) (326,299) (336,088) (346,170) (356,556) (367,252) (378,270) (389,618) (401,306) (413,346)
Total 3,416,405 3,518,897 3,624,464 3,733,198 3,845,194 3,960,550 4,079,366 4,201,747 4,327,800 4,457,634
Rent Growth 3%
Retail Tenant Costs Model Formating
Red Requires further attention
Blue Input cells
Green Cells linked to another sheet
Black Cells containing a title or calculation on the same sheet
Year Rent Utilities Other OpEx Total tenent costs Utilities + Othet OpEx
1 595,000 38,517 50,063 683,580 88,580
2 612,850 39,288 51,064 703,202 90,352
3 631,236 40,073 52,085 723,394 92,159
4 650,173 40,875 53,127 744,175 94,002
5 669,678 41,692 54,190 765,560 95,882
6 689,768 42,526 55,273 787,568 97,800
7 710,461 43,377 56,379 810,217 99,756
8 731,775 44,244 57,507 833,526 101,751
9 753,728 45,129 58,657 857,514 103,786
10 776,340 46,032 59,830 882,202 105,862
Total 7,790,937 969,928
NPV of Payments for 10 years (in year 0) 3,274,984
Retail tenent Discount Factor 11%
Utilities Growth rate 2%
Other Operating Expenses growth rate 2%
Utilities & Operating Expences / Year / SqFt
Energy 5.3
Water 0.65
Wastewater 0.56
Other Utilities 0.98
Total Utilities 7.49
Repairs & Maintenance 1.7
Security 0.5
Garage Operations 0.9
Management fee 0.4
Real Estate Taxes (5% of Rent) 5.79
Insurance 0.45
Total Operating Expenses 9.74
Total Costs 17.23
Residential Tenent Costs Model Formating
Red Requires further attention
Blue Input cells
Green Cells linked to another sheet
Black Cells containing a title or calculation on the same sheet
Year Rent Utilities Other OpEx Total tenent costs Utilities + Othet OpEx
1 3,167,950 254,091 1,747,241 5,169,282 2,001,332
2 3,262,989 259,173 1,782,186 5,304,347 2,041,358
3 3,360,878 264,356 1,817,829 5,443,064 2,082,186
4 3,461,704 269,643 1,854,186 5,585,534 2,123,829
5 3,565,556 275,036 1,891,270 5,731,862 2,166,306
6 3,672,522 280,537 1,929,095 5,882,154 2,209,632
7 3,782,698 286,148 1,967,677 6,036,523 2,253,825
8 3,896,179 291,871 2,007,031 6,195,080 2,298,901
9 4,013,064 297,708 2,047,171 6,357,943 2,344,879
10 4,133,456 303,662 2,088,115 6,525,233 2,391,777
Total 58,231,021 21,914,025
NPV of Payments for 10 years (in year 0) 26,346,207
Residential tenent Discount Factor 10%
Utilities Growth rate 2%
Other Operating Expenses growth rate 2%
Utilities & Operating Expences / Year / SqFt
Energy 4.8
Water 0.15
Wastewater 0.06
Other Utilities 0.48
Total Utilities 5.49
Repairs & Maintenance 2.2
Security 1
Garage Operations 1.4
Management fee 0.9
Real Estate Taxes (5% of Rent) 31.30
Insurance 0.95
Total Operating Expenses 37.75
Total Costs 43.24
Costruction Costs Schedule Model Formating
Red Requires further attention
Blue Input cells
Gross Development Value 39,182,000 Dhs Green Cells linked to another sheet
Rental Value (/Year) 4,310,020 Dhs Black Cells containing a title or calculation on the same sheet
Item Value Discription
Land Value 14,200,000 Dhs
Hard Costs
Building Costs (/SqFt) 18.6 1,125,300 Dhs
Landscaping 121,500 Dhs
Other external costs 180,000 Dhs
Site Clearance 120,000 Dhs
Site Preparation 240,000 Dhs
Total Hard Costs 1,786,800 Dhs
Soft Costs
Architects 10% 112,530 % of building cost
Quantity Surveyors 5% 56,265 % of building cost
Legal Fees on sale 2% 783,640 % of Gross Development Value
Legal Fees on letting 2% 86,200.40 % of rent
Letting Agents 2% 86,200.40 % of rent
Civil Engineers 5% 56,265 % of building cost
Planning Permission 60,000 Dhs
Building Regulations 30,000
Total Soft Costs 1,271,101 Dhs
Other Costs
Contingencies 10% 305,790 % of Construction costs and fees
Total Contingencies 305,790 Dhs
Tenent Improvements 1,000,000 Dhs
Legal Fees on site purchase 2% 284,000 % Land Value
Total Costs 18,847,691 Dhs
Year number Design & Construction 1 Design & Construction 2 Design & Construction 3
Year 2015 2016 2017
% Costs Allocation 50% 30% 20%
Total construction Costs 2,323,845 1,394,307 929,538 4,647,691
Total
Risiduale Land Valuation Model Formating
Red Requires further attention
Blue Input cells
Green Cells linked to another sheet
Black Cells containing a title or calculation on the same sheet
Cap Rate 12%
Operating Income (1st Year) 3,416,405
Gross Development Value 28,470,042
Hard Costs
Building Costs 1,125,300
Landscaping 121,500
Other external costs 180,000
Site Clearance 120,000
Site Preparation 240,000
Total Hard Costs 1,786,800
Soft Costs
Architects 112,530
Quantity Surveyors 56,265
Legal Fees on sale 783,640
Legal Fees on letting 86,200
Letting Agents 86,200
Civil Engineers 56,265
Planning Permission 60,000
Building Regulations 30,000
Total Soft Costs 1,271,101
Other Costs
Contingencies 305,790
Tenent Improvements 1,000,000
Total Other Costs 1,305,790
Develper Profit at 0.2 20% 5,694,008
Total Construction Costs 10,057,699
Availiable for land 18,412,342
Legal Fees on site purchase 284,000
Risidual Land Value 18,128,342 Dhs
Land Selling Price 14,200,000 Dhs
Sensitivity analysis Model Formating
Red Requires further attention
Blue Input cells
Green Cells linked to another sheet
Black Cells containing a title or calculation on the same sheet
Cap rate and Terminal CF impact on Equity
Cost of Sale 4%
Base Cap rate 6% 1,788,835 1,844,160 1,901,195 1,959,995 2,018,795 2,079,359 2,141,740
Base Terminal CF 1,959,995 5.5% 31,359,925 32,329,820 33,329,711 34,360,527 35,391,343 36,453,083 37,546,676
Change Factor 3% 5.6% 30,419,128 31,359,925 32,329,820 33,329,711 34,329,603 35,359,491 36,420,275
5.8% 29,506,554 30,419,128 31,359,925 32,329,820 33,299,714 34,298,706 35,327,667
6.0% 28,621,357 29,506,554 30,419,128 31,359,925 32,300,723 33,269,745 34,267,837
6.2% 27,787,725 28,647,139 29,533,133 30,446,529 31,359,925 32,300,723 33,269,745
6.4% 26,978,374 27,812,757 28,672,945 29,559,737 30,446,529 31,359,925 32,300,723
6.6% 26,192,596 27,002,676 27,837,811 28,698,774 29,559,737 30,446,529 31,359,925
Standard Deviation 2,700,457 Dhs
Range 11,354,079 Dhs
Equity Value
Terminal Cash flow
TerminalCapRate

Weitere ähnliche Inhalte

Was ist angesagt?

introduction to commercial real estate development
introduction to commercial real estate developmentintroduction to commercial real estate development
introduction to commercial real estate developmentPMILebanonChapter
 
Real Estate Development Business Plan
Real Estate Development Business PlanReal Estate Development Business Plan
Real Estate Development Business Plankambanis
 
What You Really Need to Know about Commercial Real Estate Underwriting
What You Really Need to Know about Commercial Real Estate UnderwritingWhat You Really Need to Know about Commercial Real Estate Underwriting
What You Really Need to Know about Commercial Real Estate UnderwritingColleen Beck-Domanico
 
Fundamental Skills for Real Estate Development Professionals I – Financial An...
Fundamental Skills for Real Estate Development Professionals I – Financial An...Fundamental Skills for Real Estate Development Professionals I – Financial An...
Fundamental Skills for Real Estate Development Professionals I – Financial An...Virtual ULI
 
FIDIC SIlver Book in Power Projects
FIDIC SIlver Book in Power ProjectsFIDIC SIlver Book in Power Projects
FIDIC SIlver Book in Power ProjectsFrancis Ho
 
Residential Land Development Process
Residential Land Development ProcessResidential Land Development Process
Residential Land Development ProcessDuncan Smith
 
Highest and best use 2015
Highest and best use   2015Highest and best use   2015
Highest and best use 2015Tim Wilmath
 
Project management
Project managementProject management
Project managementAidiel Azhar
 
REAL ESTATE REGULATORY AUTHORITY (RERA) ACT 2016
REAL ESTATE REGULATORY AUTHORITY (RERA) ACT 2016REAL ESTATE REGULATORY AUTHORITY (RERA) ACT 2016
REAL ESTATE REGULATORY AUTHORITY (RERA) ACT 2016Khyati Tewari
 
Contracts & Claims Management Workshop (Session-1)
Contracts & Claims Management Workshop (Session-1)Contracts & Claims Management Workshop (Session-1)
Contracts & Claims Management Workshop (Session-1)Tahir B Mirza
 
Principles of Valuation
Principles of ValuationPrinciples of Valuation
Principles of ValuationGeetShah8
 
City report - Bangalore Office Market - Q3 2010
City report - Bangalore Office Market - Q3 2010City report - Bangalore Office Market - Q3 2010
City report - Bangalore Office Market - Q3 2010BNP Paribas Real Estate
 
Contract Specifications, Bidding and Contractor Selection for Capital Replace...
Contract Specifications, Bidding and Contractor Selection for Capital Replace...Contract Specifications, Bidding and Contractor Selection for Capital Replace...
Contract Specifications, Bidding and Contractor Selection for Capital Replace...Kipcon Inc.
 
Impact of the Real Estate (Regulation and Development) Act, 2016 - Sandeep Jh...
Impact of the Real Estate (Regulation and Development) Act, 2016 - Sandeep Jh...Impact of the Real Estate (Regulation and Development) Act, 2016 - Sandeep Jh...
Impact of the Real Estate (Regulation and Development) Act, 2016 - Sandeep Jh...Sandeep Jhunjhunwala
 

Was ist angesagt? (20)

introduction to commercial real estate development
introduction to commercial real estate developmentintroduction to commercial real estate development
introduction to commercial real estate development
 
Real Estate Development Business Plan
Real Estate Development Business PlanReal Estate Development Business Plan
Real Estate Development Business Plan
 
What You Really Need to Know about Commercial Real Estate Underwriting
What You Really Need to Know about Commercial Real Estate UnderwritingWhat You Really Need to Know about Commercial Real Estate Underwriting
What You Really Need to Know about Commercial Real Estate Underwriting
 
Fundamental Skills for Real Estate Development Professionals I – Financial An...
Fundamental Skills for Real Estate Development Professionals I – Financial An...Fundamental Skills for Real Estate Development Professionals I – Financial An...
Fundamental Skills for Real Estate Development Professionals I – Financial An...
 
FIDIC SIlver Book in Power Projects
FIDIC SIlver Book in Power ProjectsFIDIC SIlver Book in Power Projects
FIDIC SIlver Book in Power Projects
 
Residential Land Development Process
Residential Land Development ProcessResidential Land Development Process
Residential Land Development Process
 
Highest and best use 2015
Highest and best use   2015Highest and best use   2015
Highest and best use 2015
 
Project management
Project managementProject management
Project management
 
Construction Planning
Construction PlanningConstruction Planning
Construction Planning
 
Epc contractor
Epc contractorEpc contractor
Epc contractor
 
REAL ESTATE REGULATORY AUTHORITY (RERA) ACT 2016
REAL ESTATE REGULATORY AUTHORITY (RERA) ACT 2016REAL ESTATE REGULATORY AUTHORITY (RERA) ACT 2016
REAL ESTATE REGULATORY AUTHORITY (RERA) ACT 2016
 
Epc contracts.
Epc contracts.Epc contracts.
Epc contracts.
 
Contracts & Claims Management Workshop (Session-1)
Contracts & Claims Management Workshop (Session-1)Contracts & Claims Management Workshop (Session-1)
Contracts & Claims Management Workshop (Session-1)
 
Rera act
Rera actRera act
Rera act
 
Principles of Valuation
Principles of ValuationPrinciples of Valuation
Principles of Valuation
 
City report - Bangalore Office Market - Q3 2010
City report - Bangalore Office Market - Q3 2010City report - Bangalore Office Market - Q3 2010
City report - Bangalore Office Market - Q3 2010
 
Contract Specifications, Bidding and Contractor Selection for Capital Replace...
Contract Specifications, Bidding and Contractor Selection for Capital Replace...Contract Specifications, Bidding and Contractor Selection for Capital Replace...
Contract Specifications, Bidding and Contractor Selection for Capital Replace...
 
Real estate
Real estateReal estate
Real estate
 
Impact of the Real Estate (Regulation and Development) Act, 2016 - Sandeep Jh...
Impact of the Real Estate (Regulation and Development) Act, 2016 - Sandeep Jh...Impact of the Real Estate (Regulation and Development) Act, 2016 - Sandeep Jh...
Impact of the Real Estate (Regulation and Development) Act, 2016 - Sandeep Jh...
 
FIDIC 2017 Yellow and Silver in EPC and PPP Contracts
FIDIC 2017 Yellow and Silver in EPC and PPP ContractsFIDIC 2017 Yellow and Silver in EPC and PPP Contracts
FIDIC 2017 Yellow and Silver in EPC and PPP Contracts
 

Ähnlich wie Real Estate Development - Financial Model

The watergate confidential
The watergate confidentialThe watergate confidential
The watergate confidentialHaris Memon
 
Fixed Capital Analysis PowerPoint Presentation Slides
Fixed Capital Analysis PowerPoint Presentation SlidesFixed Capital Analysis PowerPoint Presentation Slides
Fixed Capital Analysis PowerPoint Presentation SlidesSlideTeam
 
Assignment - Financial Appraisal
Assignment - Financial AppraisalAssignment - Financial Appraisal
Assignment - Financial AppraisalKai Yun Pang
 
Spdr debunking-5-common-gold-misconceptions
Spdr debunking-5-common-gold-misconceptionsSpdr debunking-5-common-gold-misconceptions
Spdr debunking-5-common-gold-misconceptionsZewoMaluk
 
CHRSA P&L
CHRSA P&LCHRSA P&L
CHRSA P&Lmmazner
 
2016 ULI Hines Student Competition Pro Forma_v11
2016 ULI Hines Student Competition  Pro Forma_v112016 ULI Hines Student Competition  Pro Forma_v11
2016 ULI Hines Student Competition Pro Forma_v11Miguel A. Garcia
 
Viability Session 2: The role of viability in plan-making and development man...
Viability Session 2: The role of viability in plan-making and development man...Viability Session 2: The role of viability in plan-making and development man...
Viability Session 2: The role of viability in plan-making and development man...PAS_Team
 
alltel 4q05supplement
alltel  4q05supplementalltel  4q05supplement
alltel 4q05supplementfinance27
 
Williams sonoma model
Williams sonoma model Williams sonoma model
Williams sonoma model Trishala Rasya
 
Webcast 2Q17
Webcast 2Q17Webcast 2Q17
Webcast 2Q17Localiza
 
November 2016-digital-realty-company-overview-(1)
November 2016-digital-realty-company-overview-(1)November 2016-digital-realty-company-overview-(1)
November 2016-digital-realty-company-overview-(1)ir_digitalrealty
 
TMUS ICM November 2020 update 11.9.20
TMUS ICM November 2020 update 11.9.20TMUS ICM November 2020 update 11.9.20
TMUS ICM November 2020 update 11.9.20thomas paulson
 
January 2017 digital realty company overview
January 2017 digital realty company overviewJanuary 2017 digital realty company overview
January 2017 digital realty company overviewir_digitalrealty
 
alltel 3Q06_InvestorSupplementa
alltel  3Q06_InvestorSupplementaalltel  3Q06_InvestorSupplementa
alltel 3Q06_InvestorSupplementafinance27
 
FINALANALYSTPRESENTATION30092014.pptx
FINALANALYSTPRESENTATION30092014.pptxFINALANALYSTPRESENTATION30092014.pptx
FINALANALYSTPRESENTATION30092014.pptxSumit133807
 
Webcast - 2Q18
Webcast - 2Q18Webcast - 2Q18
Webcast - 2Q18Localiza
 
alltel 3Q05_Supplemental
alltel  3Q05_Supplementalalltel  3Q05_Supplemental
alltel 3Q05_Supplementalfinance27
 

Ähnlich wie Real Estate Development - Financial Model (20)

The watergate confidential
The watergate confidentialThe watergate confidential
The watergate confidential
 
Fixed Capital Analysis PowerPoint Presentation Slides
Fixed Capital Analysis PowerPoint Presentation SlidesFixed Capital Analysis PowerPoint Presentation Slides
Fixed Capital Analysis PowerPoint Presentation Slides
 
Assignment - Financial Appraisal
Assignment - Financial AppraisalAssignment - Financial Appraisal
Assignment - Financial Appraisal
 
Larsen & toubro.ppt_25
Larsen & toubro.ppt_25Larsen & toubro.ppt_25
Larsen & toubro.ppt_25
 
Spdr debunking-5-common-gold-misconceptions
Spdr debunking-5-common-gold-misconceptionsSpdr debunking-5-common-gold-misconceptions
Spdr debunking-5-common-gold-misconceptions
 
CHRSA P&L
CHRSA P&LCHRSA P&L
CHRSA P&L
 
2016 ULI Hines Student Competition Pro Forma_v11
2016 ULI Hines Student Competition  Pro Forma_v112016 ULI Hines Student Competition  Pro Forma_v11
2016 ULI Hines Student Competition Pro Forma_v11
 
Viability Session 2: The role of viability in plan-making and development man...
Viability Session 2: The role of viability in plan-making and development man...Viability Session 2: The role of viability in plan-making and development man...
Viability Session 2: The role of viability in plan-making and development man...
 
alltel 4q05supplement
alltel  4q05supplementalltel  4q05supplement
alltel 4q05supplement
 
Williams sonoma model
Williams sonoma model Williams sonoma model
Williams sonoma model
 
De assignment
De assignmentDe assignment
De assignment
 
Webcast 2Q17
Webcast 2Q17Webcast 2Q17
Webcast 2Q17
 
November 2016-digital-realty-company-overview-(1)
November 2016-digital-realty-company-overview-(1)November 2016-digital-realty-company-overview-(1)
November 2016-digital-realty-company-overview-(1)
 
TMUS ICM November 2020 update 11.9.20
TMUS ICM November 2020 update 11.9.20TMUS ICM November 2020 update 11.9.20
TMUS ICM November 2020 update 11.9.20
 
January 2017 digital realty company overview
January 2017 digital realty company overviewJanuary 2017 digital realty company overview
January 2017 digital realty company overview
 
alltel 3Q06_InvestorSupplementa
alltel  3Q06_InvestorSupplementaalltel  3Q06_InvestorSupplementa
alltel 3Q06_InvestorSupplementa
 
FINALANALYSTPRESENTATION30092014.pptx
FINALANALYSTPRESENTATION30092014.pptxFINALANALYSTPRESENTATION30092014.pptx
FINALANALYSTPRESENTATION30092014.pptx
 
Tegtora final
Tegtora finalTegtora final
Tegtora final
 
Webcast - 2Q18
Webcast - 2Q18Webcast - 2Q18
Webcast - 2Q18
 
alltel 3Q05_Supplemental
alltel  3Q05_Supplementalalltel  3Q05_Supplemental
alltel 3Q05_Supplemental
 

Mehr von Imran Almaleh

Intel Corporation - investment report
Intel Corporation -  investment reportIntel Corporation -  investment report
Intel Corporation - investment reportImran Almaleh
 
Intel - stock valuation and analysis model - imran almaleh
Intel - stock valuation and analysis model - imran almalehIntel - stock valuation and analysis model - imran almaleh
Intel - stock valuation and analysis model - imran almalehImran Almaleh
 
Doing international trade - imran almaleh
Doing international trade - imran almalehDoing international trade - imran almaleh
Doing international trade - imran almalehImran Almaleh
 
The origins of everything
The origins of everythingThe origins of everything
The origins of everythingImran Almaleh
 
Contrarian investment strategies in the developing markets - Imran Almaleh
Contrarian investment strategies in the developing markets - Imran AlmalehContrarian investment strategies in the developing markets - Imran Almaleh
Contrarian investment strategies in the developing markets - Imran AlmalehImran Almaleh
 
EMAAR Properties - Company Profile
EMAAR Properties - Company ProfileEMAAR Properties - Company Profile
EMAAR Properties - Company ProfileImran Almaleh
 
Basics of Technical Analysis - Picking stocks in the market Part 3
Basics of Technical Analysis - Picking stocks in the market Part 3Basics of Technical Analysis - Picking stocks in the market Part 3
Basics of Technical Analysis - Picking stocks in the market Part 3Imran Almaleh
 
Basics of Technical Analysis - Picking stocks in the market Part 2
Basics of Technical Analysis - Picking stocks in the market Part 2Basics of Technical Analysis - Picking stocks in the market Part 2
Basics of Technical Analysis - Picking stocks in the market Part 2Imran Almaleh
 
Basics of Technical Analysis - Picking stocks in the market Part 1
Basics of Technical Analysis - Picking stocks in the market Part 1Basics of Technical Analysis - Picking stocks in the market Part 1
Basics of Technical Analysis - Picking stocks in the market Part 1Imran Almaleh
 
Financial markets - Imran Almaleh
Financial markets - Imran AlmalehFinancial markets - Imran Almaleh
Financial markets - Imran AlmalehImran Almaleh
 
Venture capital 101 - Imran Almaleh
Venture capital 101 - Imran AlmalehVenture capital 101 - Imran Almaleh
Venture capital 101 - Imran AlmalehImran Almaleh
 

Mehr von Imran Almaleh (11)

Intel Corporation - investment report
Intel Corporation -  investment reportIntel Corporation -  investment report
Intel Corporation - investment report
 
Intel - stock valuation and analysis model - imran almaleh
Intel - stock valuation and analysis model - imran almalehIntel - stock valuation and analysis model - imran almaleh
Intel - stock valuation and analysis model - imran almaleh
 
Doing international trade - imran almaleh
Doing international trade - imran almalehDoing international trade - imran almaleh
Doing international trade - imran almaleh
 
The origins of everything
The origins of everythingThe origins of everything
The origins of everything
 
Contrarian investment strategies in the developing markets - Imran Almaleh
Contrarian investment strategies in the developing markets - Imran AlmalehContrarian investment strategies in the developing markets - Imran Almaleh
Contrarian investment strategies in the developing markets - Imran Almaleh
 
EMAAR Properties - Company Profile
EMAAR Properties - Company ProfileEMAAR Properties - Company Profile
EMAAR Properties - Company Profile
 
Basics of Technical Analysis - Picking stocks in the market Part 3
Basics of Technical Analysis - Picking stocks in the market Part 3Basics of Technical Analysis - Picking stocks in the market Part 3
Basics of Technical Analysis - Picking stocks in the market Part 3
 
Basics of Technical Analysis - Picking stocks in the market Part 2
Basics of Technical Analysis - Picking stocks in the market Part 2Basics of Technical Analysis - Picking stocks in the market Part 2
Basics of Technical Analysis - Picking stocks in the market Part 2
 
Basics of Technical Analysis - Picking stocks in the market Part 1
Basics of Technical Analysis - Picking stocks in the market Part 1Basics of Technical Analysis - Picking stocks in the market Part 1
Basics of Technical Analysis - Picking stocks in the market Part 1
 
Financial markets - Imran Almaleh
Financial markets - Imran AlmalehFinancial markets - Imran Almaleh
Financial markets - Imran Almaleh
 
Venture capital 101 - Imran Almaleh
Venture capital 101 - Imran AlmalehVenture capital 101 - Imran Almaleh
Venture capital 101 - Imran Almaleh
 

Kürzlich hochgeladen

Financial analysis on Risk and Return.ppt
Financial analysis on Risk and Return.pptFinancial analysis on Risk and Return.ppt
Financial analysis on Risk and Return.ppttadegebreyesus
 
Amil Baba In Pakistan amil baba in Lahore amil baba in Islamabad amil baba in...
Amil Baba In Pakistan amil baba in Lahore amil baba in Islamabad amil baba in...Amil Baba In Pakistan amil baba in Lahore amil baba in Islamabad amil baba in...
Amil Baba In Pakistan amil baba in Lahore amil baba in Islamabad amil baba in...amilabibi1
 
fca-bsps-decision-letter-redacted (1).pdf
fca-bsps-decision-letter-redacted (1).pdffca-bsps-decision-letter-redacted (1).pdf
fca-bsps-decision-letter-redacted (1).pdfHenry Tapper
 
Stock Market Brief Deck FOR 4/17 video.pdf
Stock Market Brief Deck FOR 4/17 video.pdfStock Market Brief Deck FOR 4/17 video.pdf
Stock Market Brief Deck FOR 4/17 video.pdfMichael Silva
 
NO1 Certified kala jadu karne wale ka contact number kala jadu karne wale bab...
NO1 Certified kala jadu karne wale ka contact number kala jadu karne wale bab...NO1 Certified kala jadu karne wale ka contact number kala jadu karne wale bab...
NO1 Certified kala jadu karne wale ka contact number kala jadu karne wale bab...Amil baba
 
The Core Functions of the Bangko Sentral ng Pilipinas
The Core Functions of the Bangko Sentral ng PilipinasThe Core Functions of the Bangko Sentral ng Pilipinas
The Core Functions of the Bangko Sentral ng PilipinasCherylouCamus
 
(办理学位证)加拿大萨省大学毕业证成绩单原版一比一
(办理学位证)加拿大萨省大学毕业证成绩单原版一比一(办理学位证)加拿大萨省大学毕业证成绩单原版一比一
(办理学位证)加拿大萨省大学毕业证成绩单原版一比一S SDS
 
Unveiling Business Expansion Trends in 2024
Unveiling Business Expansion Trends in 2024Unveiling Business Expansion Trends in 2024
Unveiling Business Expansion Trends in 2024Champak Jhagmag
 
The AES Investment Code - the go-to counsel for the most well-informed, wise...
The AES Investment Code -  the go-to counsel for the most well-informed, wise...The AES Investment Code -  the go-to counsel for the most well-informed, wise...
The AES Investment Code - the go-to counsel for the most well-informed, wise...AES International
 
原版1:1复刻温哥华岛大学毕业证Vancouver毕业证留信学历认证
原版1:1复刻温哥华岛大学毕业证Vancouver毕业证留信学历认证原版1:1复刻温哥华岛大学毕业证Vancouver毕业证留信学历认证
原版1:1复刻温哥华岛大学毕业证Vancouver毕业证留信学历认证rjrjkk
 
BPPG response - Options for Defined Benefit schemes - 19Apr24.pdf
BPPG response - Options for Defined Benefit schemes - 19Apr24.pdfBPPG response - Options for Defined Benefit schemes - 19Apr24.pdf
BPPG response - Options for Defined Benefit schemes - 19Apr24.pdfHenry Tapper
 
AnyConv.com__FSS Advance Retail & Distribution - 15.06.17.ppt
AnyConv.com__FSS Advance Retail & Distribution - 15.06.17.pptAnyConv.com__FSS Advance Retail & Distribution - 15.06.17.ppt
AnyConv.com__FSS Advance Retail & Distribution - 15.06.17.pptPriyankaSharma89719
 
government_intervention_in_business_ownership[1].pdf
government_intervention_in_business_ownership[1].pdfgovernment_intervention_in_business_ownership[1].pdf
government_intervention_in_business_ownership[1].pdfshaunmashale756
 
Economic Risk Factor Update: April 2024 [SlideShare]
Economic Risk Factor Update: April 2024 [SlideShare]Economic Risk Factor Update: April 2024 [SlideShare]
Economic Risk Factor Update: April 2024 [SlideShare]Commonwealth
 
2024 Q1 Crypto Industry Report | CoinGecko
2024 Q1 Crypto Industry Report | CoinGecko2024 Q1 Crypto Industry Report | CoinGecko
2024 Q1 Crypto Industry Report | CoinGeckoCoinGecko
 
GOODSANDSERVICETAX IN INDIAN ECONOMY IMPACT
GOODSANDSERVICETAX IN INDIAN ECONOMY IMPACTGOODSANDSERVICETAX IN INDIAN ECONOMY IMPACT
GOODSANDSERVICETAX IN INDIAN ECONOMY IMPACTharshitverma1762
 
Role of Information and technology in banking and finance .pptx
Role of Information and technology in banking and finance .pptxRole of Information and technology in banking and finance .pptx
Role of Information and technology in banking and finance .pptxNarayaniTripathi2
 
212MTAMount Durham University Bachelor's Diploma in Technology
212MTAMount Durham University Bachelor's Diploma in Technology212MTAMount Durham University Bachelor's Diploma in Technology
212MTAMount Durham University Bachelor's Diploma in Technologyz xss
 
magnetic-pensions-a-new-blueprint-for-the-dc-landscape.pdf
magnetic-pensions-a-new-blueprint-for-the-dc-landscape.pdfmagnetic-pensions-a-new-blueprint-for-the-dc-landscape.pdf
magnetic-pensions-a-new-blueprint-for-the-dc-landscape.pdfHenry Tapper
 

Kürzlich hochgeladen (20)

Financial analysis on Risk and Return.ppt
Financial analysis on Risk and Return.pptFinancial analysis on Risk and Return.ppt
Financial analysis on Risk and Return.ppt
 
Amil Baba In Pakistan amil baba in Lahore amil baba in Islamabad amil baba in...
Amil Baba In Pakistan amil baba in Lahore amil baba in Islamabad amil baba in...Amil Baba In Pakistan amil baba in Lahore amil baba in Islamabad amil baba in...
Amil Baba In Pakistan amil baba in Lahore amil baba in Islamabad amil baba in...
 
Monthly Economic Monitoring of Ukraine No 231, April 2024
Monthly Economic Monitoring of Ukraine No 231, April 2024Monthly Economic Monitoring of Ukraine No 231, April 2024
Monthly Economic Monitoring of Ukraine No 231, April 2024
 
fca-bsps-decision-letter-redacted (1).pdf
fca-bsps-decision-letter-redacted (1).pdffca-bsps-decision-letter-redacted (1).pdf
fca-bsps-decision-letter-redacted (1).pdf
 
Stock Market Brief Deck FOR 4/17 video.pdf
Stock Market Brief Deck FOR 4/17 video.pdfStock Market Brief Deck FOR 4/17 video.pdf
Stock Market Brief Deck FOR 4/17 video.pdf
 
NO1 Certified kala jadu karne wale ka contact number kala jadu karne wale bab...
NO1 Certified kala jadu karne wale ka contact number kala jadu karne wale bab...NO1 Certified kala jadu karne wale ka contact number kala jadu karne wale bab...
NO1 Certified kala jadu karne wale ka contact number kala jadu karne wale bab...
 
The Core Functions of the Bangko Sentral ng Pilipinas
The Core Functions of the Bangko Sentral ng PilipinasThe Core Functions of the Bangko Sentral ng Pilipinas
The Core Functions of the Bangko Sentral ng Pilipinas
 
(办理学位证)加拿大萨省大学毕业证成绩单原版一比一
(办理学位证)加拿大萨省大学毕业证成绩单原版一比一(办理学位证)加拿大萨省大学毕业证成绩单原版一比一
(办理学位证)加拿大萨省大学毕业证成绩单原版一比一
 
Unveiling Business Expansion Trends in 2024
Unveiling Business Expansion Trends in 2024Unveiling Business Expansion Trends in 2024
Unveiling Business Expansion Trends in 2024
 
The AES Investment Code - the go-to counsel for the most well-informed, wise...
The AES Investment Code -  the go-to counsel for the most well-informed, wise...The AES Investment Code -  the go-to counsel for the most well-informed, wise...
The AES Investment Code - the go-to counsel for the most well-informed, wise...
 
原版1:1复刻温哥华岛大学毕业证Vancouver毕业证留信学历认证
原版1:1复刻温哥华岛大学毕业证Vancouver毕业证留信学历认证原版1:1复刻温哥华岛大学毕业证Vancouver毕业证留信学历认证
原版1:1复刻温哥华岛大学毕业证Vancouver毕业证留信学历认证
 
BPPG response - Options for Defined Benefit schemes - 19Apr24.pdf
BPPG response - Options for Defined Benefit schemes - 19Apr24.pdfBPPG response - Options for Defined Benefit schemes - 19Apr24.pdf
BPPG response - Options for Defined Benefit schemes - 19Apr24.pdf
 
AnyConv.com__FSS Advance Retail & Distribution - 15.06.17.ppt
AnyConv.com__FSS Advance Retail & Distribution - 15.06.17.pptAnyConv.com__FSS Advance Retail & Distribution - 15.06.17.ppt
AnyConv.com__FSS Advance Retail & Distribution - 15.06.17.ppt
 
government_intervention_in_business_ownership[1].pdf
government_intervention_in_business_ownership[1].pdfgovernment_intervention_in_business_ownership[1].pdf
government_intervention_in_business_ownership[1].pdf
 
Economic Risk Factor Update: April 2024 [SlideShare]
Economic Risk Factor Update: April 2024 [SlideShare]Economic Risk Factor Update: April 2024 [SlideShare]
Economic Risk Factor Update: April 2024 [SlideShare]
 
2024 Q1 Crypto Industry Report | CoinGecko
2024 Q1 Crypto Industry Report | CoinGecko2024 Q1 Crypto Industry Report | CoinGecko
2024 Q1 Crypto Industry Report | CoinGecko
 
GOODSANDSERVICETAX IN INDIAN ECONOMY IMPACT
GOODSANDSERVICETAX IN INDIAN ECONOMY IMPACTGOODSANDSERVICETAX IN INDIAN ECONOMY IMPACT
GOODSANDSERVICETAX IN INDIAN ECONOMY IMPACT
 
Role of Information and technology in banking and finance .pptx
Role of Information and technology in banking and finance .pptxRole of Information and technology in banking and finance .pptx
Role of Information and technology in banking and finance .pptx
 
212MTAMount Durham University Bachelor's Diploma in Technology
212MTAMount Durham University Bachelor's Diploma in Technology212MTAMount Durham University Bachelor's Diploma in Technology
212MTAMount Durham University Bachelor's Diploma in Technology
 
magnetic-pensions-a-new-blueprint-for-the-dc-landscape.pdf
magnetic-pensions-a-new-blueprint-for-the-dc-landscape.pdfmagnetic-pensions-a-new-blueprint-for-the-dc-landscape.pdf
magnetic-pensions-a-new-blueprint-for-the-dc-landscape.pdf
 

Real Estate Development - Financial Model

  • 1. Real Estate Development Financial Model Author: Imran Almaleh Date: August 23, 2014 Jumeirah Village Circle, Dubai Phone: (971) 52 940 6601 Email: imranalmaleh@gmail.com Summary The purpose of this spreadsheet model is to determine the financial feasibility of a development project of the subject property for a 10 year holding period. The uncertainty in this model lies in the many construction & economic factors. The most important assumptions in this analysis are the Net Operating Income assumptions (Annual Gross Rent, Vacany, and Operating Expenses) and the Cap Rates. Special attention should be given to these assumptions. Keywords: Real Estate, Property Valuation, Dubai
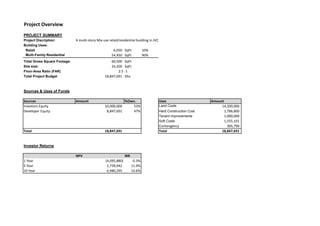
  • 2. Project Overview PROJECT SUMMARY Project Discription: A multi-story Mix use retail/residential building in JVC Building Uses: Retail 6,050 SqFt 10% Multi-Family Residential 54,450 SqFt 90% Total Gross Square Footage: 60,500 SqFt Site size: 24,200 SqFt Floor-Area Ratio (FAR) 2.5 :1 Total Project Budget 18,847,691 Dhs Sources & Uses of Funds Sources Amount %Own. Uses Amount Investors Equity 10,000,000 53% Land Costs 14,200,000 Developer Equity 8,847,691 47% Hard Construction Cost 1,786,800 Tenant Improvements 1,000,000 Soft Costs 1,555,101 Contengency 305,790 Total 18,847,691 Total 18,847,691 Investor Returns NPV IRR 1 Year (4,095,880) -0.3% 5 Year 1,739,942 11.9% 10 Year 6,980,295 14.6%
  • 3. Cash Flow Projection Model Formating Red Requires further attention Depreciation Period (whole project) 30 years Blue Input cells Green Cells linked to another sheet Black Cells containing a title or calculation on the same sheet Year number Design & Construction 1 Design & Construction 2 Design & Construction 3 1 2 3 4 5 6 7 8 9 10 Year 2015 2016 2017 2018 2019 2020 2021 2022 2023 2024 2025 2026 2027 Income Gross Operating Income 3,416,405 3,518,897 3,624,464 3,733,198 3,845,194 3,960,550 4,079,366 4,201,747 4,327,800 4,457,634 Operating Expences (Paid by tenents) Retail Tenents 88,580 90,352 92,159 94,002 95,882 97,800 99,756 101,751 103,786 105,862 Residential Tenents 2,001,332 2,041,358 2,082,186 2,123,829 2,166,306 2,209,632 2,253,825 2,298,901 2,344,879 2,391,777 Total - - - 5,506,317 5,650,607 5,798,809 5,951,029 6,107,382 6,267,981 6,432,947 6,602,399 6,776,465 6,955,272 Expenses Construction Costs (2,323,845) (1,394,307) (929,538) Land Cost (14,200,000) Operating Expenses (2,089,912) (2,131,710) (2,174,344) (2,217,831) (2,262,188) (2,307,432) (2,353,580) (2,400,652) (2,448,665) (2,497,638) Draw Against Investors Equity 10,000,000 Draw Against Developers Equity 6,523,845 1,394,307 929,538 Total - - - (2,089,912) (2,131,710) (2,174,344) (2,217,831) (2,262,188) (2,307,432) (2,353,580) (2,400,652) (2,448,665) (2,497,638) Net Cash Flow - - - 3,416,405 3,518,897 3,624,464 3,733,198 3,845,194 3,960,550 4,079,366 4,201,747 4,327,800 4,457,634 Depritiation (628,256) (628,256) (628,256) (628,256) (628,256) (628,256) (628,256) (628,256) (628,256) (628,256) Net Profit - - - 2,788,149 2,890,641 2,996,208 3,104,942 3,216,938 3,332,293 3,451,110 3,573,491 3,699,543 3,829,377
  • 4. Building Mix Model Formating Red Requires further attention Blue Input cells Green Cells linked to another sheet Black Cells containing a title or calculation on the same sheet Retail area 6,050 SqFt Residential area 54,450 SqFt total 60,500 SqFt Retail Size (SqFt) % Allocation # of Shops Total Area Rent (Dhs) Total Rent Shop style A 500 45% 5 2,500 65,000 325,000 Shop style B 1100 55% 3 3,300 125,000 375,000 Total 100% 8 5,800 190,000 700,000 Aditional Area (SqFt) 250 Residential Size (SqFt) % Allocation # of Units Total Area Rent (Dhs) Total Rent Studio 500 15% 16 8,000 47,000 752,000 1 BHK 1 BR 800 20% 13 10,400 60,000 780,000 1 BHK 2 BR 850 10% 6 5,100 64,000 384,000 2 BHK 1 BR 950 25% 14 13,300 67,000 938,000 2 BHK 2 BR 1100 20% 9 9,900 71,000 639,000 3 BHK 2 BR 1600 10% 3 4,800 78,000 234,000 Total 100% 61 51,500 387,000 3,727,000 Aditional Area (SqFt) 2,950 Rent Per SqFt 77.26 Retail 115.70 Dhs Residential 68.45 Dhs
  • 5. Investor Returns Model Formating Red Requires further attention Blue Input cells Green Cells linked to another sheet Black Cells containing a title or calculation on the same sheet Year Developers Equity Investors Equity Net Profit Total Profit - Sale at year 1 Total Profit - Sale at year 5 Total Profit - Sale at year 10 Design & Construction 1 (6,523,845) (10,000,000) - (16,523,845) (16,523,845) (16,523,845) Design & Construction 2 (1,394,307) - - (1,394,307) (1,394,307) (1,394,307) Design & Construction 3 (929,538) - - (929,538) (929,538) (929,538) 1 2,788,149 18,706,065 2,788,149 2,788,149 2 2,890,641 2,890,641 2,890,641 3 2,996,208 2,996,208 2,996,208 4 3,104,942 3,104,942 3,104,942 5 3,216,938 24,926,734 3,216,938 6 3,332,293 3,332,293 7 3,451,110 3,451,110 8 3,573,491 3,573,491 9 3,699,543 3,699,543 10 3,829,377 35,189,303 IRR and NPV Calculations IRR Sell at Year 1 -0.3% Sell at Year 5 11.9% Sell at Year 10 14.6% NPV at 10% Sell at Year 1 (4,095,880) Sell at Year 5 1,739,942 Sell at Year 10 6,980,295 Invester Return Assuming Sale At Year 1 At Year 5 At Year 10 Net Operating Income 1,326,493 1,583,006 1,959,995 Terminal Cap Rate 8.00% 7.0% 6.0% Fair Market Value 16,581,163 22,614,371 32,666,589 Cost of Sale 4% 663,247 904,575 1,306,664 Sale Price Realized 15,917,916 21,709,796 31,359,925 Project Equity 15,917,916 21,709,796 31,359,925 ROI Investors 84% 115% 166% Developers 84% 115% 166%
  • 6. Operating Income Model Formating Red Requires further attention Blue Input cells Green Cells linked to another sheet Rentable SqFt Factor 85% Black Cells containing a title or calculation on the same sheet Retail Rent/SqFt Rentable SqFt Annual Rent 115.70 5142.5 595,000 Vacancy 5% (29,750) Gross Operating income 565,250 Residential Rent/SqFt Rentable SqFt Annual Rent 68.45 46282.5 3,167,950 Vacancy 10% (316,795) Gross Operating income 2,851,155 Total 3,416,405 Dhs Operating Income Forecast 1 2 3 4 5 6 7 8 9 10 Retail 595,000 612,850 631,236 650,173 669,678 689,768 710,461 731,775 753,728 776,340 Residential 3,167,950 3,262,989 3,360,878 3,461,704 3,565,556 3,672,522 3,782,698 3,896,179 4,013,064 4,133,456 Retail - Loss to Vacancy (29,750) (30,643) (31,562) (32,509) (33,484) (34,488) (35,523) (36,589) (37,686) (38,817) Residential - Loss to Vacancy (316,795) (326,299) (336,088) (346,170) (356,556) (367,252) (378,270) (389,618) (401,306) (413,346) Total 3,416,405 3,518,897 3,624,464 3,733,198 3,845,194 3,960,550 4,079,366 4,201,747 4,327,800 4,457,634 Rent Growth 3%
  • 7. Retail Tenant Costs Model Formating Red Requires further attention Blue Input cells Green Cells linked to another sheet Black Cells containing a title or calculation on the same sheet Year Rent Utilities Other OpEx Total tenent costs Utilities + Othet OpEx 1 595,000 38,517 50,063 683,580 88,580 2 612,850 39,288 51,064 703,202 90,352 3 631,236 40,073 52,085 723,394 92,159 4 650,173 40,875 53,127 744,175 94,002 5 669,678 41,692 54,190 765,560 95,882 6 689,768 42,526 55,273 787,568 97,800 7 710,461 43,377 56,379 810,217 99,756 8 731,775 44,244 57,507 833,526 101,751 9 753,728 45,129 58,657 857,514 103,786 10 776,340 46,032 59,830 882,202 105,862 Total 7,790,937 969,928 NPV of Payments for 10 years (in year 0) 3,274,984 Retail tenent Discount Factor 11% Utilities Growth rate 2% Other Operating Expenses growth rate 2% Utilities & Operating Expences / Year / SqFt Energy 5.3 Water 0.65 Wastewater 0.56 Other Utilities 0.98 Total Utilities 7.49 Repairs & Maintenance 1.7 Security 0.5 Garage Operations 0.9 Management fee 0.4 Real Estate Taxes (5% of Rent) 5.79 Insurance 0.45 Total Operating Expenses 9.74 Total Costs 17.23
  • 8. Residential Tenent Costs Model Formating Red Requires further attention Blue Input cells Green Cells linked to another sheet Black Cells containing a title or calculation on the same sheet Year Rent Utilities Other OpEx Total tenent costs Utilities + Othet OpEx 1 3,167,950 254,091 1,747,241 5,169,282 2,001,332 2 3,262,989 259,173 1,782,186 5,304,347 2,041,358 3 3,360,878 264,356 1,817,829 5,443,064 2,082,186 4 3,461,704 269,643 1,854,186 5,585,534 2,123,829 5 3,565,556 275,036 1,891,270 5,731,862 2,166,306 6 3,672,522 280,537 1,929,095 5,882,154 2,209,632 7 3,782,698 286,148 1,967,677 6,036,523 2,253,825 8 3,896,179 291,871 2,007,031 6,195,080 2,298,901 9 4,013,064 297,708 2,047,171 6,357,943 2,344,879 10 4,133,456 303,662 2,088,115 6,525,233 2,391,777 Total 58,231,021 21,914,025 NPV of Payments for 10 years (in year 0) 26,346,207 Residential tenent Discount Factor 10% Utilities Growth rate 2% Other Operating Expenses growth rate 2% Utilities & Operating Expences / Year / SqFt Energy 4.8 Water 0.15 Wastewater 0.06 Other Utilities 0.48 Total Utilities 5.49 Repairs & Maintenance 2.2 Security 1 Garage Operations 1.4 Management fee 0.9 Real Estate Taxes (5% of Rent) 31.30 Insurance 0.95 Total Operating Expenses 37.75 Total Costs 43.24
  • 9. Costruction Costs Schedule Model Formating Red Requires further attention Blue Input cells Gross Development Value 39,182,000 Dhs Green Cells linked to another sheet Rental Value (/Year) 4,310,020 Dhs Black Cells containing a title or calculation on the same sheet Item Value Discription Land Value 14,200,000 Dhs Hard Costs Building Costs (/SqFt) 18.6 1,125,300 Dhs Landscaping 121,500 Dhs Other external costs 180,000 Dhs Site Clearance 120,000 Dhs Site Preparation 240,000 Dhs Total Hard Costs 1,786,800 Dhs Soft Costs Architects 10% 112,530 % of building cost Quantity Surveyors 5% 56,265 % of building cost Legal Fees on sale 2% 783,640 % of Gross Development Value Legal Fees on letting 2% 86,200.40 % of rent Letting Agents 2% 86,200.40 % of rent Civil Engineers 5% 56,265 % of building cost Planning Permission 60,000 Dhs Building Regulations 30,000 Total Soft Costs 1,271,101 Dhs Other Costs Contingencies 10% 305,790 % of Construction costs and fees Total Contingencies 305,790 Dhs Tenent Improvements 1,000,000 Dhs Legal Fees on site purchase 2% 284,000 % Land Value Total Costs 18,847,691 Dhs Year number Design & Construction 1 Design & Construction 2 Design & Construction 3 Year 2015 2016 2017 % Costs Allocation 50% 30% 20% Total construction Costs 2,323,845 1,394,307 929,538 4,647,691 Total
  • 10. Risiduale Land Valuation Model Formating Red Requires further attention Blue Input cells Green Cells linked to another sheet Black Cells containing a title or calculation on the same sheet Cap Rate 12% Operating Income (1st Year) 3,416,405 Gross Development Value 28,470,042 Hard Costs Building Costs 1,125,300 Landscaping 121,500 Other external costs 180,000 Site Clearance 120,000 Site Preparation 240,000 Total Hard Costs 1,786,800 Soft Costs Architects 112,530 Quantity Surveyors 56,265 Legal Fees on sale 783,640 Legal Fees on letting 86,200 Letting Agents 86,200 Civil Engineers 56,265 Planning Permission 60,000 Building Regulations 30,000 Total Soft Costs 1,271,101 Other Costs Contingencies 305,790 Tenent Improvements 1,000,000 Total Other Costs 1,305,790 Develper Profit at 0.2 20% 5,694,008 Total Construction Costs 10,057,699 Availiable for land 18,412,342 Legal Fees on site purchase 284,000 Risidual Land Value 18,128,342 Dhs Land Selling Price 14,200,000 Dhs
  • 11. Sensitivity analysis Model Formating Red Requires further attention Blue Input cells Green Cells linked to another sheet Black Cells containing a title or calculation on the same sheet Cap rate and Terminal CF impact on Equity Cost of Sale 4% Base Cap rate 6% 1,788,835 1,844,160 1,901,195 1,959,995 2,018,795 2,079,359 2,141,740 Base Terminal CF 1,959,995 5.5% 31,359,925 32,329,820 33,329,711 34,360,527 35,391,343 36,453,083 37,546,676 Change Factor 3% 5.6% 30,419,128 31,359,925 32,329,820 33,329,711 34,329,603 35,359,491 36,420,275 5.8% 29,506,554 30,419,128 31,359,925 32,329,820 33,299,714 34,298,706 35,327,667 6.0% 28,621,357 29,506,554 30,419,128 31,359,925 32,300,723 33,269,745 34,267,837 6.2% 27,787,725 28,647,139 29,533,133 30,446,529 31,359,925 32,300,723 33,269,745 6.4% 26,978,374 27,812,757 28,672,945 29,559,737 30,446,529 31,359,925 32,300,723 6.6% 26,192,596 27,002,676 27,837,811 28,698,774 29,559,737 30,446,529 31,359,925 Standard Deviation 2,700,457 Dhs Range 11,354,079 Dhs Equity Value Terminal Cash flow TerminalCapRate