JLL Downtown Chicago Office Market Update - Q3 2016
•
1 gefällt mir•365 views

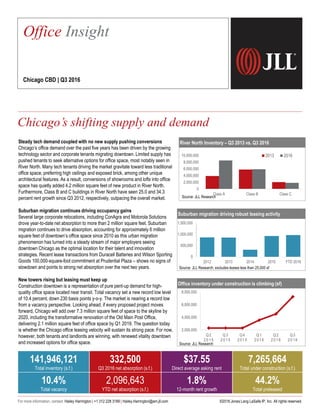
Chicago's shifting supply and demand. River North Inventory increases 4.2 million square feet of new product as tech tenant demand driving conversions to office due to limited supply.

Empfohlen
Empfohlen
Weitere ähnliche Inhalte
Was ist angesagt?
Was ist angesagt? (20)
Andere mochten auch
Andere mochten auch (15)
Ähnlich wie JLL Downtown Chicago Office Market Update - Q3 2016
Ähnlich wie JLL Downtown Chicago Office Market Update - Q3 2016 (20)
Mehr von Hailey Harrington
Mehr von Hailey Harrington (6)
Kürzlich hochgeladen
Kürzlich hochgeladen (20)
JLL Downtown Chicago Office Market Update - Q3 2016
- 1. Steady tech demand coupled with no new supply pushing conversions Chicago’s office demand over the past five years has been driven by the growing technology sector and corporate tenants migrating downtown. Limited supply has pushed tenants to seek alternative options for office space, most notably seen in River North. Many tech tenants driving the market gravitate toward less traditional office space, preferring high ceilings and exposed brick, among other unique architectural features. As a result, conversions of showrooms and lofts into office space has quietly added 4.2 million square feet of new product in River North. Furthermore, Class B and C buildings in River North have seen 25.0 and 34.3 percent rent growth since Q3 2012, respectively, outpacing the overall market. Suburban migration continues driving occupancy gains Several large corporate relocations, including ConAgra and Motorola Solutions drove year-to-date net absorption to more than 2 million square feet. Suburban migration continues to drive absorption, accounting for approximately 6 million square feet of downtown’s office space since 2010 as this urban migration phenomenon has turned into a steady stream of major employers seeing downtown Chicago as the optimal location for their talent and innovation strategies. Recent lease transactions from Duracell Batteries and Wilson Sporting Goods 100,000-square-foot commitment at Prudential Plaza – shows no signs of slowdown and points to strong net absorption over the next two years. New towers rising but leasing must keep up Construction downtown is a representation of pure pent-up demand for high- quality office space located near transit. Total vacancy set a new record low level of 10.4 percent, down 230 basis points y-o-y. The market is nearing a record low from a vacancy perspective. Looking ahead, if every proposed project moves forward, Chicago will add over 7.3 million square feet of space to the skyline by 2020, including the transformative renovation of the Old Main Post Office, delivering 2.1 million square feet of office space by Q1 2019. The question today is whether the Chicago office leasing velocity will sustain its strong pace. For now, however, both tenants and landlords are winning, with renewed vitality downtown and increased options for office space. River North Inventory – Q3 2013 vs. Q3 2016 Suburban migration driving robust leasing activity Office inventory under construction is climbing (sf) Chicago CBD | Q3 2016 Chicago’s shifting supply and demand ©2016 Jones Lang LaSalle IP, Inc. All rights reserved.For more information, contact: Hailey Harrington | +1 312 228 3189 | Hailey.Harrington@am.jll.com Office Insight 141,946,121 Total inventory (s.f.) 332,500 Q3 2016 net absorption (s.f.) $37.55 Direct average asking rent 7,265,664 Total under construction (s.f.) 10.4% Total vacancy 2,096,643 YTD net absorption (s.f.) 1.8% 12-month rent growth 44.2% Total preleased Source: JLL Research, excludes leases less than 25,000 sf Source: JLL Research Source: JLL Research 0 500,000 1,000,000 1,500,000 2012 2013 2014 2015 YTD 2016 0 2,000,000 4,000,000 6,000,000 8,000,000 10,000,000 Class A Class B Class C 2013 2016 2,000,000 4,000,000 6,000,000 8,000,000 Q 2 2 0 1 5 Q 3 2 0 1 5 Q 4 2 0 1 5 Q 1 2 0 1 6 Q 2 2 0 1 6 Q 3 2 0 1 6
- 2. Current conditions – submarket Historical leasing activity (s.f.) Source: JLL Research Source: JLL Research Total net absorption (s.f.) Source: JLL Research Total vacancy rate (%) Source: JLL Research Direct average asking rent ($ p.s.f.) Source: JLL Research 2,828,556 175,858 -2,381,109 -528,328 382,460 -29,176 620,297 1,922,389 2,308,240 2,092,643 -3,000,000 -2,000,000 -1,000,000 0 1,000,000 2,000,000 3,000,000 4,000,000 2007 2008 2009 2010 2011 2012 2013 2014 2015 YTD 2016 $31.15 $33.39 $32.34 $32.73 $32.70 $33.71 $33.64 $36.40 $36.79 $37.55 $30.00 $34.00 $38.00 2007 2008 2009 2010 2011 2012 2013 2014 2015 Q3 2016 12.0% 11.9% 15.8% 16.4% 16.1% 15.8% 15.3% 12.8% 12.4% 10.4% 8.0% 10.0% 12.0% 14.0% 16.0% 18.0% 2007 2008 2009 2010 2011 2012 2013 2014 2015 Q3 2016 Landlordleverage Tenantleverage Peaking market Falling market Bottoming market Rising market 8,749,696 8,244,478 9,515,901 9,379,466 5,924,889 0 2,000,000 4,000,000 6,000,000 8,000,000 10,000,000 2012 2013 2014 2015 YTD 2016 ©2016 Jones Lang LaSalle IP, Inc. All rights reserved.For more information, contact: Hailey Harrington | +1 312 228 3189 | Hailey.Harrington@am.jll.com West Loop Central Loop Kennedy West, East Loop River North North Michigan
- 3. Office Statistics Chicago | Q3 2016 Class Inventory (s.f.) Total net absorption (s.f.) YTD total net absorption (s.f.) YTD total net absorption (% of stock) Direct vacancy (%) Total vacancy (%) Average direct asking rent ($ p.s.f.) YTD completions (s.f.) Under construction (s.f.) West Loop Totals 46,310,916 -58,700 176,206 0.4% 10.0% 11.0% $39.65 0 3,559,664 Central Loop Totals 37,160,358 25,653 406,748 1.1% 9.3% 10.5% $36.46 0 0 East Loop Totals 24,346,395 65,682 684,387 2.8% 11.7% 12.1% $35.29 0 0 South Loop Totals 1,264,787 2,812 8,652 0.7% 12.9% 12.9% $25.29 0 2,450,000 North Michigan Avenue Totals 11,392,541 130,642 309,870 2.7% 11.2% 11.7% $36.87 0 0 River North Totals 16,243,258 165,385 525,953 3.2% 4.7% 5.1% $41.81 0 80,000 Kennedy West Totals 5,227,866 3,838 -10,521 -0.2% 9.4% 10.6% $32.15 0 1,176,000 Far West Loop Totals 1,709,818 -6,706 14,551 0.9% 11.4% 11.5% $29.95 0 0 Fulton Market Totals 2,871,567 5,985 -37,013 -1.3% 8.6% 10.6% $33.55 0 1,176,000 River West Totals 646,481 4,559 11,941 1.8% 7.7% 7.7% $31.75 0 0 CBD Totals 141,946,121 332,500 2,092,643 1.5% 9.6% 10.4% $37.55 0 7,265,664 Eastern East-West Totals 22,771,680 153,604 362,761 1.6% 14.6% 16.8% $24.58 0 0 Western East-West Totals 14,456,314 -113,269 -75,232 -0.5% 17.2% 19.4% $23.74 0 0 North (Cook County) Totals 9,716,234 -240,517 -175,582 -1.8% 16.2% 16.7% $27.88 0 0 North (Lake County) Totals 15,798,901 117,205 136,637 0.9% 20.7% 21.8% $24.51 0 0 O'Hare Totals 12,458,927 71,272 187,562 1.5% 16.5% 16.9% $24.64 0 0 Northwest Totals 26,022,860 156,358 76,957 0.3% 18.5% 19.6% $22.34 0 1,111,000 Suburbs Totals 101,224,916 144,653 513,103 0.6% 17.3% 18.6% $24.06 0 1,111,000 Chicago Totals 243,171,037 477,153 2,605,746 1.1% 12.8% 13.9% $29.96 0 8,376,664 West Loop A 29,661,434 346,198 553,378 1.9% 8.3% 9.4% $42.46 0 3,559,664 Central Loop A 10,191,682 -145,613 -49,309 -0.5% 9.1% 11.4% $40.71 0 0 East Loop A 5,511,381 14,782 305,957 5.6% 5.9% 6.0% $43.48 0 0 North Michigan Avenue A 2,871,938 4,276 84,120 2.9% 8.0% 8.0% $38.09 0 0 River North A 8,519,690 182,694 475,338 5.6% 2.8% 2.9% $48.64 0 50,000 Kennedy West A 1,072,473 -5,612 -1,802 -0.2% 2.8% 7.5% $32.03 0 0 Far West Loop A 35,462 0 21,959 61.9% 0.0% 0.0% $32.00 0 0 Fulton Market A 852,011 -5,000 -29,457 -3.5% 1.9% 7.8% $36.00 0 1,176,000 River West A 185,000 -612 5,696 3.1% 7.6% 7.6% $30.00 0 0 CBD A 57,828,598 396,725 1,367,682 2.4% 7.3% 8.3% $42.25 0 4,785,664 Eastern East-West A 9,728,397 55,283 2,920 0.0% 12.2% 15.1% $28.03 0 0 Western East-West A 5,534,716 1,012 24,036 0.4% 17.2% 20.4% $27.02 0 0 North (Cook County) A 5,446,551 -260,439 -211,346 -3.9% 20.1% 20.5% $29.39 0 0 North (Lake County) A 11,105,659 107,235 -107,640 -1.0% 21.2% 22.3% $25.14 0 0 O'Hare A 6,732,939 -13,242 11,403 0.2% 13.2% 14.0% $28.60 0 0 Northwest A 15,208,180 22,300 175,463 1.2% 9.1% 10.1% $24.47 0 1,111,000 Suburbs A 53,756,442 -87,851 -105,164 -0.2% 14.6% 16.1% $26.47 0 1,111,000 Chicago A 111,585,040 308,874 1,262,518 1.1% 10.8% 12.1% $31.98 0 5,896,664 West Loop B 14,142,482 -416,148 -432,531 -3.1% 14.5% 15.4% $34.80 0 0 Central Loop B 22,670,390 194,356 465,126 2.1% 9.3% 10.0% $34.94 0 0 East Loop B 12,342,590 27,178 261,151 2.1% 14.2% 14.8% $34.40 0 0 North Michigan Avenue B 5,946,800 106,056 171,463 2.9% 13.0% 14.0% $38.07 0 0 River North B 5,896,409 -6,650 66,792 1.1% 7.5% 8.1% $38.86 0 30,000 Kennedy West B 3,118,569 11,948 -14,627 -0.5% 10.8% 11.1% $32.43 0 0 Far West Loop B 1,230,612 -9,708 -13,616 -1.1% 9.2% 9.2% $29.78 0 0 Fulton Market B 1,517,292 16,485 -7,256 -0.5% 14.5% 15.0% $33.68 0 0 River West B 370,665 5,171 6,245 1.7% 1.1% 1.1% $20.00 0 0 CBD B 64,117,240 -83,260 517,374 0.8% 11.6% 12.4% $35.30 0 30,000 Eastern East-West B 10,550,151 85,537 315,297 3.0% 16.0% 17.9% $20.42 0 0 Western East-West B 7,835,479 -116,714 -108,245 -1.4% 17.6% 19.4% $20.57 0 0 North (Cook County) B 3,455,824 8,566 9,519 0.3% 12.1% 12.1% $23.76 0 0 North (Lake County) B 4,413,995 9,970 244,277 5.5% 20.6% 21.9% $22.86 0 0 O'Hare B 4,218,447 83,786 168,451 4.0% 22.6% 22.7% $21.45 0 0 Northwest B 9,099,934 135,178 -129,751 -1.4% 33.3% 34.4% $21.11 0 0 Suburbs B 39,573,830 206,323 499,548 1.3% 21.1% 22.4% $21.36 0 0 Chicago B 103,691,070 123,063 1,016,922 1.0% 15.3% 16.2% $27.94 0 30,000 200 E Randolph Street Chicago, IL 60601 tel +1 312 228 3189 hailey.harrington@am.jll.com 2016 Jones Lang LaSalle IP, Inc. All rights reserved. Hailey Harrington Research Manager
- 4. Chicago | Q3 2016 Class Inventory (s.f.) Total net absorption (s.f.) YTD total net absorption (s.f.) YTD total net absorption (% of stock) Direct vacancy (%) Total vacancy (%) Average direct asking rent ($ p.s.f.) YTD completions (s.f.) Under construction (s.f.) West Loop C 2,507,000 11,250 55,359 2.2% 5.1% 6.0% $32.25 0 0 Central Loop C 4,298,286 -23,090 -9,069 -0.2% 9.5% 10.9% $30.54 0 0 East Loop C 6,492,424 23,722 117,279 1.8% 12.0% 12.2% $30.71 0 0 South Loop C 1,264,787 2,812 8,652 0.7% 12.9% 12.9% $25.29 0 2,450,000 North Michigan Avenue C 2,573,803 20,310 54,287 2.1% 10.5% 10.5% $30.51 0 0 River North C 1,827,159 -10,659 -16,177 -0.9% 4.2% 5.9% $30.61 0 0 Kennedy West C 1,036,824 -2,498 5,908 0.6% 12.0% 12.2% $31.26 0 0 Far West Loop C 443,744 3,002 6,208 1.4% 18.2% 18.6% $28.83 0 0 Fulton Market C 502,264 -5,500 -300 -0.1% 2.3% 2.3% $32.10 0 0 River West C 90,816 0 0 0.0% 35.2% 35.2% $32.42 0 0 CBD C 20,000,283 19,035 207,587 1.0% 9.7% 10.4% $30.07 0 2,450,000 Eastern East-West C 2,493,132 12,784 44,544 1.8% 18.3% 19.0% $15.15 0 0 Western East-West C 1,086,119 2,433 8,977 0.8% 14.9% 14.9% $16.09 0 0 North (Cook County) C 813,859 11,356 26,245 3.2% 8.1% 10.3% $17.63 0 0 North (Lake County) C 279,247 0 0 0.0% 2.4% 2.4% N/A 0 0 O'Hare C 1,507,541 728 7,708 0.5% 13.7% 13.7% $14.61 0 0 Northwest C 1,714,746 -1,120 31,245 1.8% 23.4% 24.6% $17.90 0 0 Suburbs C 7,894,644 26,181 118,719 1.6% 16.4% 17.0% $16.70 0 0 Chicago C 27,894,927 45,216 326,306 1.2% 11.6% 12.3% $24.73 0 2,450,000 Hailey Harrington Research Manager 200 E Randolph Street Chicago, IL 60601 tel +1 312 228 3189 hailey.harrington@am.jll.com 2016 Jones Lang LaSalle IP, Inc. All rights reserved.