JLL Chicago Suburbs Office Market Update - Q3 2016
•
1 gefällt mir•96 views

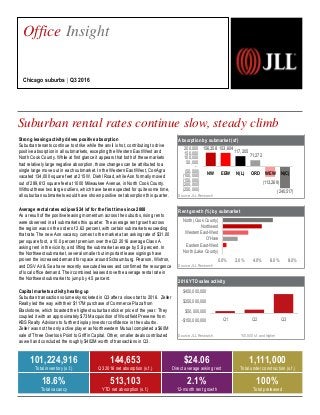
Strong leasing activity in the Chicago Suburbs drove positive absorption across all office submarkets in Q3 2016.

Empfohlen
Weitere ähnliche Inhalte
Mehr von Hailey Harrington
Mehr von Hailey Harrington (8)
Kürzlich hochgeladen
Kürzlich hochgeladen (20)
JLL Chicago Suburbs Office Market Update - Q3 2016
- 1. Absorption by submarket (sf) Source: JLL Research Rent growth (%) by submarket Source: JLL Research 2016 YTD sales activity Source: JLL Research *50,000 s.f. and higher Strong leasing activity drives positive absorption Suburban tenants continue to strike while the anvil is hot, contributing to drive positive absorption in all submarkets, excepting the Western East/West and North Cook County. While at first glance it appears that both of these markets had relatively large negative absorption, those changes can be attributed to a single large move out in each submarket. In the Western East/West, ConAgra vacated 134,000 square feet at 215 W. Diehl Road, while Aon formally moved out of 289,613 square feet at 1000 Milwaukee Avenue, in North Cook County. Without these two large outliers, which have been expected for quite some time, all suburban submarkets would have shown positive net absorption this quarter. Average rental rates eclipse $24 /sf for the first time since 2008 As a result of the positive leasing momentum across the suburbs, rising rents were observed in all submarkets this quarter. The average rent growth across the region was on the order of 2.62 percent, with certain submarkets exceeding that rate. The new Aon vacancy comes to the market at an asking rate of $31.00 per square foot, a 10.0 percent premium over the Q2 2016 average Class A asking rent in the vicinity, and lifting the submarket average by 5.8 percent. In the Northwest submarket, several smaller but important lease signings have proven the increased demand for space around Schaumburg. Pearson, Wistron, and DSV Air & Sea have recently executed leases and confirmed the resurgence of local office demand. Their combined leases drove the average rental rate in the Northwest submarket to jump by 4.5 percent. Capital markets activity heating up Suburban transaction volume skyrocketed in Q3 after a slow start to 2016. Zeller Realty led the way with their $117M purchase of Commerce Plaza from Blackstone, which boasted the highest suburban sticker price of the year. They coupled it with an approximately $73M acquisition of Woodfield Preserve from KBS Realty Advisors to further display investor confidence in the suburbs. Zeller was not the only active player as Northwestern Mutual completed a $60M sale of Three Overlook Point to Griffin Capital. Other, smaller deals contributed as well and concluded the roughly $402M worth of transactions in Q3. Suburban rental rates continue slow, steady climb 2,257 Office Insight Chicago suburbs | Q3 2016 101,224,916 Total inventory (s.f.) 144,653 Q3 2016 net absorption (s.f.) $24.06 Direct average asking rent 1,111,000 Total under construction (s.f.) 18.6% Total vacancy 513,103 YTD net absorption (s.f.) 2.1% 12-month rent growth 100% Total preleased -$150,000,000 $50,000,000 $250,000,000 $450,000,000 Q1 Q2 Q3 0.0% 2.0% 4.0% 6.0% 8.0% North (Lake County) Eastern East-West O'Hare Western East-West Northwest North (Cook County) 156,358 153,604 117,205 71,272 (113,269) (240,517) (250,000) (200,000) (150,000) (100,000) (50,000) - 50,000 100,000 150,000 200,000 NW EEW N(L) ORD WEW N(C)
- 2. Current conditions – submarket Historical leasing activity (s.f.) Source: JLL Research Source: JLL Research Total net absorption (s.f.) Source: JLL Research Total vacancy rate (%) Source: JLL Research Direct average asking rent ($ p.s.f.) Source: JLL Research -242,577 -1,018,749 -2,165,869 -283,123 394,775 -107,998 153,085 1,643,439 1,277,749 513,103 -3,000,000 -2,000,000 -1,000,000 0 1,000,000 2,000,000 2007 2008 2009 2010 2011 2012 2013 2014 2015 YTD 2016 $23.74 $24.10 $23.49 $23.08 $23.08 $23.12 $22.91 $23.60 $23.43 $24.06 $22.00 $22.50 $23.00 $23.50 $24.00 $24.50 2007 2008 2009 2010 2011 2012 2013 2014 2015 Q3 2016 20.7% 22.8% 24.8% 25.0% 24.5% 24.6% 24.3% 22.6% 18.5% 18.6% 5.0% 10.0% 15.0% 20.0% 25.0% 30.0% 2007 2008 2009 2010 2011 2012 2013 2014 2015 Q3 2016 6,708,869 4,507,842 5,703,551 5,744,248 3,768,650 0 2,000,000 4,000,000 6,000,000 8,000,000 2012 2013 2014 2015 YTD 2016 ©2016 Jones Lang LaSalle IP, Inc. All rights reserved.For more information, contact: Jack Trager | jack.trager@am.jll.com Landlordleverage Tenantleverage Peaking market Falling market Bottoming market Rising marketNorthwest, North Lake O’Hare Western East-West North Cook, Eastern East-West
- 3. Office Statistics Chicago | Q3 2016 Class Inventory (s.f.) Total net absorption (s.f.) YTD total net absorption (s.f.) YTD total net absorption (% of stock) Direct vacancy (%) Total vacancy (%) Average direct asking rent ($ p.s.f.) YTD completions (s.f.) Under construction (s.f.) West Loop Totals 46,310,916 -58,700 176,206 0.4% 10.0% 11.0% $39.65 0 3,559,664 Central Loop Totals 37,160,358 25,653 406,748 1.1% 9.3% 10.5% $36.46 0 0 East Loop Totals 24,346,395 65,682 684,387 2.8% 11.7% 12.1% $35.29 0 0 South Loop Totals 1,264,787 2,812 8,652 0.7% 12.9% 12.9% $25.29 0 2,450,000 North Michigan Avenue Totals 11,392,541 130,642 309,870 2.7% 11.2% 11.7% $36.87 0 0 River North Totals 16,243,258 165,385 525,953 3.2% 4.7% 5.1% $41.81 0 80,000 Kennedy West Totals 5,227,866 3,838 -10,521 -0.2% 9.4% 10.6% $32.15 0 1,176,000 Far West Loop Totals 1,709,818 -6,706 14,551 0.9% 11.4% 11.5% $29.95 0 0 Fulton Market Totals 2,871,567 5,985 -37,013 -1.3% 8.6% 10.6% $33.55 0 1,176,000 River West Totals 646,481 4,559 11,941 1.8% 7.7% 7.7% $31.75 0 0 CBD Totals 141,946,121 332,500 2,092,643 1.5% 9.6% 10.4% $37.55 0 7,265,664 Eastern East-West Totals 22,771,680 153,604 362,761 1.6% 14.6% 16.8% $24.58 0 0 Western East-West Totals 14,456,314 -113,269 -75,232 -0.5% 17.2% 19.4% $23.74 0 0 North (Cook County) Totals 9,716,234 -240,517 -175,582 -1.8% 16.2% 16.7% $27.88 0 0 North (Lake County) Totals 15,798,901 117,205 136,637 0.9% 20.7% 21.8% $24.51 0 0 O'Hare Totals 12,458,927 71,272 187,562 1.5% 16.5% 16.9% $24.64 0 0 Northwest Totals 26,022,860 156,358 76,957 0.3% 18.5% 19.6% $22.34 0 1,111,000 Suburbs Totals 101,224,916 144,653 513,103 0.6% 17.3% 18.6% $24.06 0 1,111,000 Chicago Totals 243,171,037 477,153 2,605,746 1.1% 12.8% 13.9% $29.96 0 8,376,664 West Loop A 29,661,434 346,198 553,378 1.9% 8.3% 9.4% $42.46 0 3,559,664 Central Loop A 10,191,682 -145,613 -49,309 -0.5% 9.1% 11.4% $40.71 0 0 East Loop A 5,511,381 14,782 305,957 5.6% 5.9% 6.0% $43.48 0 0 North Michigan Avenue A 2,871,938 4,276 84,120 2.9% 8.0% 8.0% $38.09 0 0 River North A 8,519,690 182,694 475,338 5.6% 2.8% 2.9% $48.64 0 50,000 Kennedy West A 1,072,473 -5,612 -1,802 -0.2% 2.8% 7.5% $32.03 0 0 Far West Loop A 35,462 0 21,959 61.9% 0.0% 0.0% $32.00 0 0 Fulton Market A 852,011 -5,000 -29,457 -3.5% 1.9% 7.8% $36.00 0 1,176,000 River West A 185,000 -612 5,696 3.1% 7.6% 7.6% $30.00 0 0 CBD A 57,828,598 396,725 1,367,682 2.4% 7.3% 8.3% $42.25 0 4,785,664 Eastern East-West A 9,728,397 55,283 2,920 0.0% 12.2% 15.1% $28.03 0 0 Western East-West A 5,534,716 1,012 24,036 0.4% 17.2% 20.4% $27.02 0 0 North (Cook County) A 5,446,551 -260,439 -211,346 -3.9% 20.1% 20.5% $29.39 0 0 North (Lake County) A 11,105,659 107,235 -107,640 -1.0% 21.2% 22.3% $25.14 0 0 O'Hare A 6,732,939 -13,242 11,403 0.2% 13.2% 14.0% $28.60 0 0 Northwest A 15,208,180 22,300 175,463 1.2% 9.1% 10.1% $24.47 0 1,111,000 Suburbs A 53,756,442 -87,851 -105,164 -0.2% 14.6% 16.1% $26.47 0 1,111,000 Chicago A 111,585,040 308,874 1,262,518 1.1% 10.8% 12.1% $31.98 0 5,896,664 West Loop B 14,142,482 -416,148 -432,531 -3.1% 14.5% 15.4% $34.80 0 0 Central Loop B 22,670,390 194,356 465,126 2.1% 9.3% 10.0% $34.94 0 0 East Loop B 12,342,590 27,178 261,151 2.1% 14.2% 14.8% $34.40 0 0 North Michigan Avenue B 5,946,800 106,056 171,463 2.9% 13.0% 14.0% $38.07 0 0 River North B 5,896,409 -6,650 66,792 1.1% 7.5% 8.1% $38.86 0 30,000 Kennedy West B 3,118,569 11,948 -14,627 -0.5% 10.8% 11.1% $32.43 0 0 Far West Loop B 1,230,612 -9,708 -13,616 -1.1% 9.2% 9.2% $29.78 0 0 Fulton Market B 1,517,292 16,485 -7,256 -0.5% 14.5% 15.0% $33.68 0 0 River West B 370,665 5,171 6,245 1.7% 1.1% 1.1% $20.00 0 0 CBD B 64,117,240 -83,260 517,374 0.8% 11.6% 12.4% $35.30 0 30,000 Eastern East-West B 10,550,151 85,537 315,297 3.0% 16.0% 17.9% $20.42 0 0 Western East-West B 7,835,479 -116,714 -108,245 -1.4% 17.6% 19.4% $20.57 0 0 North (Cook County) B 3,455,824 8,566 9,519 0.3% 12.1% 12.1% $23.76 0 0 North (Lake County) B 4,413,995 9,970 244,277 5.5% 20.6% 21.9% $22.86 0 0 O'Hare B 4,218,447 83,786 168,451 4.0% 22.6% 22.7% $21.45 0 0 Northwest B 9,099,934 135,178 -129,751 -1.4% 33.3% 34.4% $21.11 0 0 Suburbs B 39,573,830 206,323 499,548 1.3% 21.1% 22.4% $21.36 0 0 Chicago B 103,691,070 123,063 1,016,922 1.0% 15.3% 16.2% $27.94 0 30,000 200 E Randolph Street Chicago, IL 60601 tel +1 312 228 3189 hailey.harrington@am.jll.com 2016 Jones Lang LaSalle IP, Inc. All rights reserved. Hailey Harrington Research Manager
- 4. Chicago | Q3 2016 Class Inventory (s.f.) Total net absorption (s.f.) YTD total net absorption (s.f.) YTD total net absorption (% of stock) Direct vacancy (%) Total vacancy (%) Average direct asking rent ($ p.s.f.) YTD completions (s.f.) Under construction (s.f.) West Loop C 2,507,000 11,250 55,359 2.2% 5.1% 6.0% $32.25 0 0 Central Loop C 4,298,286 -23,090 -9,069 -0.2% 9.5% 10.9% $30.54 0 0 East Loop C 6,492,424 23,722 117,279 1.8% 12.0% 12.2% $30.71 0 0 South Loop C 1,264,787 2,812 8,652 0.7% 12.9% 12.9% $25.29 0 2,450,000 North Michigan Avenue C 2,573,803 20,310 54,287 2.1% 10.5% 10.5% $30.51 0 0 River North C 1,827,159 -10,659 -16,177 -0.9% 4.2% 5.9% $30.61 0 0 Kennedy West C 1,036,824 -2,498 5,908 0.6% 12.0% 12.2% $31.26 0 0 Far West Loop C 443,744 3,002 6,208 1.4% 18.2% 18.6% $28.83 0 0 Fulton Market C 502,264 -5,500 -300 -0.1% 2.3% 2.3% $32.10 0 0 River West C 90,816 0 0 0.0% 35.2% 35.2% $32.42 0 0 CBD C 20,000,283 19,035 207,587 1.0% 9.7% 10.4% $30.07 0 2,450,000 Eastern East-West C 2,493,132 12,784 44,544 1.8% 18.3% 19.0% $15.15 0 0 Western East-West C 1,086,119 2,433 8,977 0.8% 14.9% 14.9% $16.09 0 0 North (Cook County) C 813,859 11,356 26,245 3.2% 8.1% 10.3% $17.63 0 0 North (Lake County) C 279,247 0 0 0.0% 2.4% 2.4% N/A 0 0 O'Hare C 1,507,541 728 7,708 0.5% 13.7% 13.7% $14.61 0 0 Northwest C 1,714,746 -1,120 31,245 1.8% 23.4% 24.6% $17.90 0 0 Suburbs C 7,894,644 26,181 118,719 1.6% 16.4% 17.0% $16.70 0 0 Chicago C 27,894,927 45,216 326,306 1.2% 11.6% 12.3% $24.73 0 2,450,000 Hailey Harrington Research Manager 200 E Randolph Street Chicago, IL 60601 tel +1 312 228 3189 hailey.harrington@am.jll.com 2016 Jones Lang LaSalle IP, Inc. All rights reserved.