
Empfohlen
Empfohlen
Weitere ähnliche Inhalte
Ähnlich wie Explor-a-Bull Florida: A Guide to Automating and Mapping User Generated Metadata through Google Tools
Ähnlich wie Explor-a-Bull Florida: A Guide to Automating and Mapping User Generated Metadata through Google Tools (20)
Kürzlich hochgeladen
Kürzlich hochgeladen (20)
Explor-a-Bull Florida: A Guide to Automating and Mapping User Generated Metadata through Google Tools
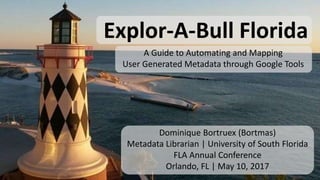
- 1. Explor-A-Bull Florida A Guide to Automating and Mapping User Generated Metadata through Google Tools Dominique Bortruex (Bortmas) Metadata Librarian | University of South Florida FLA Annual Conference Orlando, FL | May 10, 2017
- 2. About Dominique Metadata Librarian | University of South Florida MLIS Instructor | Dominican University MLIS Instructor| Kent State University http://personal.kent.edu/~dbortma1/index.html @DBortruex
- 3. • Explor-A-Bull is an interactive map that displays student submitted GoPro footage of Florida. Students who check out GoPros can record their activities throughout Florida, then submit these first-person videos to Explor-A-Bull. The map displays the videos and user-generated metadata, allowing other users to see Florida through students’ experiences. Explor-A-Bull Overview
- 4. • Promote the Digital Media Commons (DMC) and library’s “non- traditional” check out materials. • Involve students with the library, USF community, and Florida communities through sharing footage of their experiences throughout Florida, with a focus on the Tampa Bay area. • Promote technology and student involvement in the academic environment. • Allow Metadata Librarians to collect user generated metadata, like subjects. Explor-A-Bull Goals
- 6. It starts with DMC The USF Library Digital Media Commons (DMC) is a multimedia production area that provides equipment, instruction, creative space, and assistance to USF students, faculty and staff. Our innovative lab enables content creators to use studio equipment and software to work on class assignments or personal projects.
- 8. How it works: users
- 9. How it works: Librarian View
- 10. Set up
- 11. Required Google Tools Google Forms | Google Sheets | Google Fusion
- 12. Set to Public
- 13. Google Form
- 14. Form to Google Sheets
- 15. Form to Google Sheet
- 16. Google Sheet
- 17. Sheet to Fusion Table
- 19. Fusion Table
- 23. Metadata cards
- 25. Final Product
- 26. Fusion Map
- 28. Searchable Map
- 29. Database code
- 30. AutomationSyncing Sheet to Fusion
- 31. Locate table ID in fusion
- 32. Set up API credentials
- 33. API credentials
- 34. Enable API
- 36. API apply to fusion https://gist.github.com/chrislkeller/3013360#file- spreadsheet_to_fusion_tables-js
- 37. Associate Script with Fusion
- 38. Updated Fusion
- 39. Updated Fusion
- 42. Interactive CV
- 43. User generated metadata applications COMING SOON!
Hinweis der Redaktion
- Explor-A-Bull is an interactive map that displays student submitted GoPro footage of Florida. Students who check out GoPros can record their activities throughout Florida, then submit these first-person videos to Explor-A-Bull. The map displays the videos and user-generated metadata, allowing other users to see Florida through students’ experiences. The project has been partially implemented and tested, but it is not live to the public. The project was delayed due to other projects, mainly the ILS migration.
- These are some of Explor-a-bull’s initial goals, just to name a few. To Promote the Digital Media Commons (DMC) and library’s “non-traditional” check out materials, including Go Pros and digital cameras. Involve students with the library, USF community, and Florida communities through sharing footage of their experiences throughout Florida, with a focus on the Tampa Bay area. Promote technology and student involvement in the academic environment. Allow Metadata Librarians to collect user generated metadata, like subjects.
- Story about mom visiting Wanted to use library’s cameras Wanted to share the pictures with everyone back home Wanted to show on a map and show off the location
- To make this project a reality, I first rely on the DMC. The USF Library Digital Media Commons (DMC) is a multimedia production area that provides equipment, instruction, creative space, and assistance to USF students, faculty and staff. Our innovative lab enables content creators to use studio equipment and software to work on class assignments or personal projects. Not only does the DMC provide students with equipment and software, they also led interactive sessions on using these tools.
- Here, we have some of the equipment patrons can check out through the DMC.
- Once patrons check out DMC cameras and record videos or photos throughout Florida, they can upload the video and descriptive metadata through a Google form online. Instantly, a pin will appear at the location of the media’s creation. User generated metadata, like title, location, and subject, will display when the pin is selected, or when a search is done on the map.
- The process starts with setting up a Google Form that allows users to make submissions. The Form is connected to a Google Sheet which stores the metadata. The sheet is pulled into Google Fusion where it is mapped and displayed. You can fully recreate your own Explor-a-bull through these steps, but you can further personalize it through a little extra coding. However, the additional coding is not necessary. These additional tweaks do allow for customizations and auto syncing some steps.
- So now, I am going to walk you through Explor-a-bull’s set up. Most slides include screen shots and directions for recreating this project, or adapting it to your own project.
- To make Explor-a-bull, I used Google Forms, Google Sheets, and Google Fusion. All these tools are free and easy to use.
- First, the access settings for all the forms, sheets, and fusion tables must be set to Public. If you skip this step, none of your other steps will work, and no one will be able to see all your work! To change the access and privacy settings, you can go into the form and sheet’s settings.
- Building Explor-a-bull starts with a Google form where patrons submit their media and enter descriptive metadata, such as Title, creator, Location, and subjects, about their submitted media.
- After creating the Form, I tell the form to send the responses to a google sheet. These replies are sent from the form, to the sheet, to the fusion map. To do this, navigate to Responses, and select response destination.
- When selecting the response destination, you can send it to an existing Google Sheet or you can create a new one. I prefer to create a new one directly from the google form responses because it directly transfers the replies from the form into a google sheet. Without any additional work, the form submissions auto sync to the Google sheet, eliminating the need for manual input or work.
- Now, all the submissions and metadata will be automatically sent to a Google Sheet. The sheet is like a database for the submissions. It serves as the metadata for the points and descriptions on the map. Each column is a metadata element from the form. This metadata will be sent to a Google fusion table which will display the submissions on an interactive map.
- After creating the Google Form and sheet, it’s time to build our interactive map. Go to Google Fusion’s app in the browser to create a new Google fusion table. When creating a new Fusion table, import new table from Google Spreadsheets. This allows you to select the Sheet that contains all the user submitted metadata. Automatically, all the metadata from the sheet will be pulled into the Fusion table and will then be displayed on the map.
- Your Google Sheet metadata will then appear in a preview view. If it looks as expected, click next to finalize the set up.
- After importing the Google sheet, you will see all the submitted metadata in a new table. At this point, we can begin customizations.
- First, we need to pin the submissions to the map. There are a variety of easy ways to do this. The easiest is using the edit geo-code feature which maps specific locations that are named, or you can input the longitude and latitude from the location of the submissions. Both methods are accurate, but the geo-code option is the fastest method.
- Once the locations are configured, we must edit the metadata cards. These cards display when a map marker is clicked or tapped. A box will appear over the marker and display the metadata, a thumbnail of the video, and the original submitted metadata. There is an automatic card layout that lets you select which elements to display. This option is fast and easy; anyone can do it; but if you want more customization, you can use the custom option.
- The custom option allows you to write your own HTML to specify which elements to use. You can also combine elements, as I did with multiple subjects and creators.
- Your final result will look something like this.
- The most important steps are now complete, but we can still make additional customizations such as the map markers. There are a variety of colors and styles to choose, or you can input your own markers. You can also configure the map features to color code the map markers. For example, you can set cards with the subject “boating” to blue, cards with the subject “hiking” as green, and so on.
- After all the customizations and metadata input, you will have an interactive map as the final product!
- He final product maps out the submissions and allows users to interact with the cards and map markers. Users now have the chance to see Florida through students’ eyes.
- You’ve done all the work to create the Map, but now you need to publish and share it! You can share it as a link, embed it in an existing web page, or grab the generated code and adjust it for your own code. If you simply embed the map, it will be interactive, but it will not include a searchable, filtered database view.
- Along with some additional coding, you can build a database to query the map. Users can search by subject, location, or any of the other metadata elements on the cards. This takes more expertise, but the extra work results in a great, interactive interface for the users.
- I’m not going to go through how to build the database or the accompanying CSS for the display and design since this is such a unique step that requires customization and a vast set of web design and information retrieval skills. If you want to skip this step, you can just embed the map, or if you’re lucky enough to have team members who can perform these functions, you could team up with them to create a truly polished, finished product.
- So far, we have created a Google Form which sends user submissions to Google Sheets which then display on the interactive map. With additional customizations and coding, we can even create a searchable database to accompany our map. However, there are still some tweaks we can make to further streamline and automate this process. In order to avoid librarian and staff manual labor, including the constant manually updating of the Sheet to the Fusion table and map, we can write a short script to auto sync the sheet to the fusion table and map.
- First, you need to grab the Fusion table ID. Go to About this table, and you will see the table ID. I recommend copying this and keeping it in a text file for later use.
- Next, we need to set up API credentials. This will enable auto syncing and a variety of other tasks associated with the newly created API. Google walks you through step by step, so this step is actually very simple and fast.
- If you navigate to your user credentials, you will now see your client ID associated with your new project.
- Within the settings, make sure to turn on the Fusion Tables API. If you skip this step, your sheet will not automatically sync to Fusion, and librarians will have to manually update the Fusion table.
- The API is set up, but we need to implement the API and syncing to the sheet and fusion table. To do this, we need to go to the Script Editor in Google Sheets’ tools.
- Grab THIS CODE, which is available for free and open use on GitHub. Copy and paste the code in your Google Sheet’s Script Editor. The only thing you need to do here is paste your Fusion Table ID in line 9. Along with this table ID, the script will now sync the sheets to the fusion table map.
- After configuring the script to include your Fusion Table ID, you will see a confirmation of the script being associated with the Google Sheet and Fusion Table.
- Additionally, you will see confirmation of your associated script in Google Sheet’s Tool bar. Remember, Sync spread sheet to fusion table/ update Fusion Table is not a default option in Sheets. It will only appear after implementing the previously shown code.
- Now, you have the option to auto sync the Sheets to the Fusion table. You can set this to auto sycnon a timer, or you can go to Google Sheets, and choose to click and run the syncing script whenever you want.
- This project has a lot of potential. Anyone, regardless of skill set, can recreate the project or adapt it for their own use. I adapted this project