
Empfohlen
Empfohlen
Weitere ähnliche Inhalte
Was ist angesagt?
Was ist angesagt? (18)
Andere mochten auch
Andere mochten auch (11)
Ähnlich wie St Louis Office Employment Update
Ähnlich wie St Louis Office Employment Update (20)
Mehr von Blaise Tomazic
Mehr von Blaise Tomazic (20)
Kürzlich hochgeladen
Kürzlich hochgeladen (20)
St Louis Office Employment Update
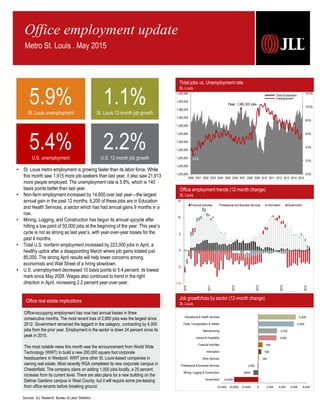
- 1. 0.0% 2.0% 4.0% 6.0% 8.0% 10.0% 12.0% 1,220,000 1,240,000 1,260,000 1,280,000 1,300,000 1,320,000 1,340,000 1,360,000 1,380,000 1,400,000 1,420,000 2000 2001 2002 2003 2004 2005 2006 2007 2008 2009 2010 2011 2012 2013 2014 2015 Total Employment Unemployment Office real estate implications Office employment trends (12-month change) St. Louis Job growth/loss by sector (12-month change) St. Louis Office-occupying employment has now had annual losses in three consecutive months. The most recent loss of 2,900 jobs was the largest since 2012. Government remained the laggard in the category, contracting by 4,000 jobs from the prior year. Employment in the sector is down 24 percent since its peak in 2010. The most notable news this month was the announcement from World Wide Technology (WWT) to build a new 200,000 square foot corporate headquarters in Westport. WWT joins other St. Louis-based companies in owning real estate. Most recently RGA completed its new corporate campus in Chesterfield. The company plans on adding 1,000 jobs locally, a 25 percent increase from its current level. There are also plans for a new building on the Delmar Gardens campus in West County; but it will require some pre-leasing from office tenants before breaking ground. Total jobs vs. Unemployment rate St. Louis Sources: JLL Research, Bureau of Labor Statistics Peak: 1,385,303 jobs 3.1% Office employment update Metro St. Louis . May 2015 5.9%St. Louis unemployment 1.1%St. Louis 12-month job growth 5.4%U.S. unemployment 2.2%U.S. 12-month job growth • St. Louis metro employment is growing faster than its labor force. While this month saw 1,915 more job-seekers than last year, it also saw 21,913 more people employed. The unemployment rate is 5.9%, which is 140 basis points better than last year. • Non-farm employment increased by 14,600 over last year—the largest annual gain in the past 12 months. 6,200 of these jobs are in Education and Health Services, a sector which has had annual gains 9 months in a row. • Mining, Logging, and Construction has begun its annual upcycle after hitting a low point of 50,000 jobs at the beginning of the year. This year’s cycle is not as strong as last year’s, with year-over-year losses for the past 4 months. • Total U.S. nonfarm employment increased by 223,000 jobs in April, a healthy uptick after a disappointing March where job gains totaled just 85,000. The strong April results will help lower concerns among economists and Wall Street of a hiring slowdown. • U.S. unemployment decreased 10 basis points to 5.4 percent, its lowest mark since May 2008. Wages also continued to trend in the right direction in April, increasing 2.2 percent year-over-year. (10) (5) 0 5 10 15 2010 2011 2012 2013 2014 2015 Financial Activities Professional and Business Services Information Government (4,000) (800) (100) 100 500 700 3,000 3,100 5,900 6,200 (6,000) (4,000) (2,000) 0 2,000 4,000 6,000 8,000 Government Mining, Logging & Construction Professional & Business Services Other Services Information Financial Activities Leisure & Hospitality Manufacturing Trade, Transportation & Utilities Educational & Health Services
- 2. McGladrey | Accounting: Expanding The 14th largest accounting firm in St. Louis, Chicago-based McGladrey LLP, acquired the 18th largest and locally-owned accounting firm Wolfe Nilges Nahorski (WNN). The acquisition adds 23 CPAs to McGladrey’s current 30 and doubles the firm’s office space for a total of 20,000 square feet divided between McGladrey’s downtown office in US Bank Plaza and WNN’s office at Corporate Hill. Schnucks Markets, Inc. | Supermarket: Contracting Schnucks Markets, Inc. laid off 52 employees and will not fill 8 open positions at the corporate level. Schnucks corporate headquarters occupy all 90,000 square feet in a class-B owner-user office building at 11420 Lackland Road. The downsize is small, affecting less than 0.5 percent of Schnucks employees. No positions were cut at store locations. Spectrum Brands | Consumer products: Expanding Spectrum Brands is investing $1 million to merge its Pet Division, formerly headquartered in Cincinnati, with its Home and Garden Division of St. Louis. The new Pet, Home and Garden division will add 45 new jobs to the current 132 and lease an additional 8,000 square feet of class-A office space at 1 Rider Trail Plaza Drive in Earth City, where Spectrum already occupies 3 floors. Visionary Wealth Advisors | Financial services: Expanding Wealth management firm, Visionary Wealth Advisors is developing a new 65,000 square-foot office building in O’Fallon, Illinois. The building will serve as the new headquarters' for the firm and have other office and retail tenants. The project is expected to cost $16 million with delivery of the building set for June 2016. Visionary Wealth was just founded in 2014 and has 27 financial advisers with more expected in the next 60 days. JLL Americas Research • St. Louis Office Employment Update 2 Employment statistics St. Louis Industry employment stratification St. Louis Blaise Tomazic Senior Research Analyst tel +1 314 261 7377 Blaise.Tomazic@am.jll.com 211 N. Broadway Suite 2075 St. Louis, MO 63102 www.jll.com/stlouis News on the street St. Louis businesses expanding, contracting, etc. © 2015 Jones Lang LaSalle IP, Inc. All rights reserved. All information contained herein is from sources deemed reliable; however, no representation or warranty is made to the accuracy thereof. March 2013 March 2014 March 2015 Total Non-farm Employment 1,289,800 1,298,400 1,313,000 0.1% 0.7% 1.1% Unemployment Rate 7.4% 7.3% 5.9% St. Louis Supersectors March 2013 March 2014 March 2015 Mining, Logging & Construction 53,600 0.2% 55,800 4.1% 55,000 -1.4% Manufacturing 110,100 -0.6% 110,900 0.7% 114,000 2.8% Trade, Transportation, & Utilities 240,600 0.0% 244,700 1.7% 250,600 2.4% Information 29,200 -3.9% 28,300 -3.1% 28,800 1.8% Financial Activities 84,300 0.8% 84,500 0.2% 85,200 0.8% Professional & Business Services 193,700 2.6% 200,500 3.5% 200,400 0.0% Educational & Health Services 234,100 -0.8% 227,500 -2.8% 233,700 2.7% Leisure & Hospitality 134,500 1.6% 136,300 1.3% 139,300 2.2% Other Services 45,600 0.2% 44,900 -1.5% 45,000 0.2% Government 164,100 -1.5% 165,000 0.5% 161,000 -2.4% Trade, transportation and Utilities, 250,600, 19% Educational and Health Services, 233,700, 18% Professional and Business Services, 200,400, 15% Government, 161,000, 12% Leisure and Hospitality, 139,300, 11% Manufacturing, 114,000, 9% Financial Activities, 85,200, 7% Mining, Logging and construction, 55,000, 4% Other Services, 45,000, 3% Information, 28,800, 2%