
Empfohlen
Empfohlen
Weitere ähnliche Inhalte
Was ist angesagt?
Was ist angesagt? (18)
Ähnlich wie St louis Industrial Employment Update
Ähnlich wie St louis Industrial Employment Update (20)
Mehr von Blaise Tomazic
Mehr von Blaise Tomazic (20)
Kürzlich hochgeladen
Kürzlich hochgeladen (20)
St louis Industrial Employment Update
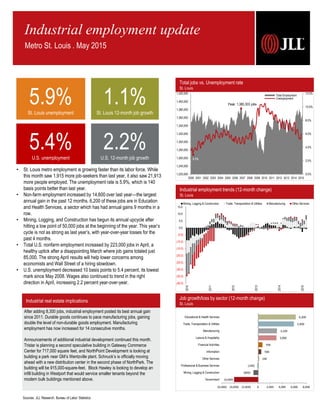
- 1. 0.0% 2.0% 4.0% 6.0% 8.0% 10.0% 12.0% 1,220,000 1,240,000 1,260,000 1,280,000 1,300,000 1,320,000 1,340,000 1,360,000 1,380,000 1,400,000 1,420,000 2000 2001 2002 2003 2004 2005 2006 2007 2008 2009 2010 2011 2012 2013 2014 2015 Total Employment Unemployment Industrial real estate implications Industrial employment trends (12-month change) St. Louis After adding 8,300 jobs, industrial employment posted its best annual gain since 2011. Durable goods continues to pace manufacturing jobs, gaining double the level of non-durable goods employment. Manufacturing employment has now increased for 14 consecutive months. Announcements of additional industrial development continued this month. Tristar is planning a second speculative building in Gateway Commerce Center for 717,000 square feet, and NorthPoint Development is looking at building a park near GM’s Wentzville plant. Schnuck’s is officially moving ahead with a new distribution center in the second phase of NorthPark. The building will be 915,000-square-feet. Block Hawley is looking to develop an infill building in Westport that would service smaller tenants beyond the modern bulk buildings mentioned above. Sources: JLL Research, Bureau of Labor Statistics Industrial employment update Metro St. Louis . May 2015 Total jobs vs. Unemployment rate St. Louis Peak: 1,385,303 jobs 3.1% Job growth/loss by sector (12-month change) St. Louis (4,000) (800) (100) 100 500 700 3,000 3,100 5,900 6,200 (6,000) (4,000) (2,000) 0 2,000 4,000 6,000 8,000 Government Mining, Logging & Construction Professional & Business Services Other Services Information Financial Activities Leisure & Hospitality Manufacturing Trade, Transportation & Utilities Educational & Health Services (40.0) (35.0) (30.0) (25.0) (20.0) (15.0) (10.0) (5.0) 0.0 5.0 10.0 15.0 2010 2011 2012 2013 2014 2015 Mining, Logging & Construction Trade, Transportation & Utilities Manufacturing Other Services 5.9%St. Louis unemployment 1.1%St. Louis 12-month job growth 5.4%U.S. unemployment 2.2%U.S. 12-month job growth • St. Louis metro employment is growing faster than its labor force. While this month saw 1,915 more job-seekers than last year, it also saw 21,913 more people employed. The unemployment rate is 5.9%, which is 140 basis points better than last year. • Non-farm employment increased by 14,600 over last year—the largest annual gain in the past 12 months. 6,200 of these jobs are in Education and Health Services, a sector which has had annual gains 9 months in a row. • Mining, Logging, and Construction has begun its annual upcycle after hitting a low point of 50,000 jobs at the beginning of the year. This year’s cycle is not as strong as last year’s, with year-over-year losses for the past 4 months. • Total U.S. nonfarm employment increased by 223,000 jobs in April, a healthy uptick after a disappointing March where job gains totaled just 85,000. The strong April results will help lower concerns among economists and Wall Street of a hiring slowdown. • U.S. unemployment decreased 10 basis points to 5.4 percent, its lowest mark since May 2008. Wages also continued to trend in the right direction in April, increasing 2.2 percent year-over-year.
- 2. JLL Americas Research • St. Louis Industrial Employment Update 2 Blaise Tomazic Senior Research Analyst tel +1 314 261 7377 Blaise.Tomazic@am.jll.com 211 N. Broadway, Suite 2075 St. Louis, MO 63102 www.jll.com/stlouis News on the street St. Louis businesses expanding, contracting, etc. © 2015 Jones Lang LaSalle IP, Inc. All rights reserved. All information contained herein is from sources deemed reliable; however, no representation or warranty is made to the accuracy thereof. Block Hawley | Commercial Real Estate: expanding Graybar, a St. Louis-based, employee-owned provider of industrial equipment, is merging with Advantage Industrial Automation, effective April 1. Advantage has 6 locations in the U.S. including headquarters in Duluth, Georgia. Fenton Logistics Park | Industrial Real Estate: expanding With recent approval by the Board of Aldermen, phase one of Fenton Logistics Park will break ground this summer on 49.3 acres of the former Chrysler plant site at 1050 Dodge Drive. In five phases, $500 million will develop all 280 acres for light manufacturing, distribution centers, and office space. NorthPoint Development | Manufacturing: expanding A new 1.3 million square-foot warehouse and subassembly facility for General Motors may add 800 jobs to its current 3,700 in Wentzville as early as December 2015. NorthPoint Development LLC and the city of Wentzville are negotiating incentives terms for the $50 million project, which may include annexing 130 acres of unincorporated land. Future plans include $120 to $250 million in new construction nearby. Schnuck Markets, Inc. | Supermarket: expanding Maryland-based supermarket chain Schnuck Markets is building a 915,000 square foot warehouse complex in NorthPark Technology Park, pending approval by St. Louis County Council for $99 million in redevelopment bonds. Should Schnucks commit to this site, the company will hire 400 new employees, contribute $20,000 annually to Ferguson Florissant School District Foundation, and offer tours and job fairs to the Metropolitan Employment Training Center. Silgan Plastics Corp. | Bottling and packaging: expanding Hazelwood City Council approved a $1.4 million loan for Silgan Plastics Corp. (NASDAQ: SLGN) to open a manufacturing facility occupying 335,000 of 535,000 square feet in the former Ford Motor Co. site. The facility will create 120 manufacturing jobs with a total payroll of $4.3 million. Silgan is considering moving headquarters to the site, too, which would create an additional 70 corporate jobs with a total payroll of $6.5 million. TriStar Properties | Industrial Real Estate: expanding TriStar Properties has plans for a $60 million speculative development at Gateway Commerce Center. Construction on the 700,000+ square foot facility starts is scheduled to start May 2015. The decision to build was partly motivated by Florida 3PL company Saddle Creek Corp.’s recent lease of 673,000 square feet at the 673 building, lowering Metro East’s class-A vacancy to only 5 percent. Employment statistics St. Louis Industry employment stratification St. Louis March 2013 March 2014 March 2015 Total Non-farm Employment 1,289,800 1,298,400 1,313,000 0.1% 0.7% 1.1% Unemployment Rate 7.4% 7.3% 5.9% St. Louis Supersectors March 2013 March 2014 March 2015 Mining, Logging & Construction 53,600 0.2% 55,800 4.1% 55,000 -1.4% Manufacturing 110,100 -0.6% 110,900 0.7% 114,000 2.8% Trade, Transportation, & Utilities 240,600 0.0% 244,700 1.7% 250,600 2.4% Information 29,200 -3.9% 28,300 -3.1% 28,800 1.8% Financial Activities 84,300 0.8% 84,500 0.2% 85,200 0.8% Professional & Business Services 193,700 2.6% 200,500 3.5% 200,400 0.0% Educational & Health Services 234,100 -0.8% 227,500 -2.8% 233,700 2.7% Leisure & Hospitality 134,500 1.6% 136,300 1.3% 139,300 2.2% Other Services 45,600 0.2% 44,900 -1.5% 45,000 0.2% Government 164,100 -1.5% 165,000 0.5% 161,000 -2.4% Trade, transportation and Utilities, 250,600, 19% Educational and Health Services, 233,700, 18% Professional and Business Services, 200,400, 15% Government, 161,000, 12% Leisure and Hospitality, 139,300, 11% Manufacturing, 114,000, 9% Financial Activities, 85,200, 7% Mining, Logging and construction, 55,000, 4% Other Services, 45,000, 3% Information, 28,800, 2%