SlideShare ist ein Scribd-Unternehmen logo
1 von 9
I. Objectives: At the end of the lesson, the students are expected to:
a. define the mean, median and mode;
b. find the mean, median and mode of the given set of the data;
c. describe the data in terms of the mean, median and mode.
II. Subject Matter: “Measures of Central Tendency of Ungrouped Data”
Reference: Mathematics 8, Learner’s Module, pp. 491-496
Skills: Computing and Analyzing
III. Materials: books, visual aids, cartolina strips
IV. Procedure: Developmental Method
Teacher’s Activity Student’s Activity
A. Preparation
a. Review
Class yesterday we discussed about
summation.
So, as you can see on the board there
are sets of data given.
So, who would like to come to the
board and solve the given data?
X1=85 X3=88 X5=87 X7=84 X9=94
X2=80 X4=83 X6=89 X8=80 X10=90
Find:
a. ∑ 𝑥10
𝑖=1
b. ∑ 𝑥5
𝑖=1
a. ∑ 𝑥10
𝑖=1 = x1 + x2 + x3 + . . . + x10
= 85 + 80 + 88 + 83 + 87 + 89 + 84 + 80
+ 94 + 90
∑ 𝑥10
𝑖=1 = 860
b. ∑ 𝑥5
𝑖=1 = xi + . . . + x5
= 85 + 80 + 88 + 83 + 87
∑ 𝑥5
𝑖=1 = 423
c. ∑ 𝑥10
𝑖=6
b. Motivation
Class the data from X1 to X10 are 85, 80,
88, 83, 87, 89, 84, 80, 94 and 90.
Arranging these in increasing order,
that is from least to greatest
80,80,83,84,85,87,88,89,90 and 94.
Class, what do you observe with the
data?
Yes,_____________
That’s right!
Class if I am going to use these data
80, 80, 83, 84, 85, 87, 88, 90 and 94 as the math
grades of 10 students. And aside from adding
these data with the use of summation method,
do you know that these data can also be
summarized into a single number or single
data?
B. Presentation
So be with me this morning class, as I
discuss to you about “Measures of central
Tendency (Ungrouped Data)”.
Everybody read!
a. Statement of the aim
Class listen carefully because after
my discussion you will be asked to define the
mean, median and mode, find the mean,
median and mode of the given set of data and
lastly, you will be asked to describe the data in
terms of the mean, median, and mode.
Am I understood class?
c. ∑ 𝑥10
𝑖=6 = x6 + x7 + . . . + x10
= 89 + 84 + 80 + 94 + 90
∑ 𝑥10
𝑖=6 = 437
The data given are all number.
No, ma’am
“Measures of Central Tendency of Ungrouped
Data”
Yes, ma’am
C. Developmental Proper
Okay class there are three measures of
central tendency, first one is the mean.
Mean – is the most commonly used measure of
central tendency. It is used to describe a set of
data where the measures cluster or concentrate
at a point. It is found by adding the values of
the data and dividing by the total number of
values.
It is given with the formula
𝑥̅ =
Ʃ𝑥
𝑁
Where:
Ʃx = the summation of x or (the sum of
the measure)
N = number of the values of x
First example:
80, 80, 83, 84, 85, 87, 88, 89, 90, 94
So from the formula given, let us now try to
analyze and then substitute the given values to
the given formula.
𝑥̅ =
Ʃ𝑥
𝑁
𝑥̅ =
80+80+83+84+85+87+88+89+90+94
10
Hence, the mean grade of the ten students is
86.
Second example:
The five players of basketball team have the
scores of 10, 15, 20, 10, and 25.
Find the mean:
𝑥̅ =
Ʃ𝑥
𝑁
𝑥̅ =
10+15+20+10+25
5
𝑥̅ =
80
5
𝑥̅ = 16
𝑥̅= 86
Therefore, the mean score of five players of
basketball is equal to 16.
Do you understand class on how to find the
mean of the given data?
Is there any question?
Okay let us proceed to the second measure of
central tendency.
Median – is the midpoint of the array. The
median will be either a specific value or will fall
between two values.
First example:
Using the same data above.
The math grades of ten students are 85, 80, 88,
83, 87, 89, 84, 80, 94, and 90.
Find the median.
Solution:
To find the median, we need to arrange first the
data in increasing order that is from least to
greatest or vice versa.
80, 80, 83, 84, 85, 87, 88, 89, 90, 94
Since the middle point falls halfway between 85
and 87, so in order to get the median, we need
get the mean 0f these two values.
Median =
85+87
2
Median =
172
2
Median = 86
Therefore, the median of the given data is 86.
Yes, ma’am
No, ma’am
Second example:
10, 15, 20, 10, 25
Solution:
Arrange the data in increasing order, from least
to greatest or from greatest to least.
10, 10, 15, 20, 25
Median= 15
Third example:
Using the same formula.
The weights of nine boxing players are recorded
as follows (in pounds).
206,215,305,206,265,265,297,282,301
Now try to solve it in your notebook and then I
will be calling somebody to answer it on the
board.
So do you understand class on how to find the
median of a set of data?
Is there any question?
Okay let us proceed to the next measure of
central tendency.
Mode- it is the value that occurs most often in
the data set. It is the value with the greatest
frequency. A data can have more than one or
none at all. To find the mode for a set of data
we are to consider the following:
Solution:
Arrange first the data in increasing order, from
least to greatest on vice versa.
206, 206, 215, 265, 282, 297, 301, 305
Median = 265
Yes, ma’am
No, ma’am
1.) Select the measure that appears most often
in the set.
2.) If two or more measures appear the same
number of times, then each of these values is a
mode.
3.) If every measure appears the same number
of times, then the set of data has no mode.
First example:
Using the same data above.
80,80,83,84,85,87,88,89,90,94
Since 80 is the value that most often occur in
the given data, therefore 80 is the mode.
Second example:
206,206,215,265,265,282,297,301,305
So now I want you to solve or to get the mode
of the given data.
Very good!
Class, is everything clear?
Do you have question?
D. Values Integration
Class a while ago, we discuss about on how to
measure central tendency of ungrouped data.
From the word central class, we can associate it
with the word center.
How will you define the word center?
Yes,___________
That’s right!
206, 206, 215, 265, 265, 282, 297, 301 305
The modes of the given data are 206 and 265,
since these are the values that most often occur
in the given data.
Yes, Ma’am
None, Ma’am
It is the middle part of everything around us.
Now, how about in your real life situation class,
who is the center of your life?
Yes,___________
Another idea?
Yes,___________
Very good!
How about God, did you also make Him as the
center of your life?
Why did you make God as the center of your
life?
Yes,___________
Exactly!
So class, whoever is the center of our life we
should not forget God because He is the source
of everything. Whatever decision or thing we
will make, we should not forget God because
without Him we are nothing.
E. Application
Activity 1
Directions: Find the mean, median, and mode
of the following set of data.
1.) The data below show the score of 20
students in a Biology quiz.
25 33 35 45 34
26 29 35 38 40
45 38 28 29 25
39 32 27 47 45
The center of my life is my family.
The center of my life is my mother.
Yes, ma’am
I always make God as the center of my life
because I know ma’am with god nothing is
impossible.
a.) Mean
x = ∑ 𝑥
N
= 25 + 26 + 45 + 39 + 33 + 29 + 38 + 32 + 35
+ 35 + 28 + 37 + 45 + 38 + 29 + 47 + 34 +
40 + 25 + 45
x = 705 = 35.25
20
V. Evaluation
Directions: The data below show the score of
40 students in the 2012 Division Achievement
Test (DAT). Analyze the given data and answer
the questions below.
35 16 28 43 21 17 15 16
20 18 25 22 33 18 32 38
23 32 18 25 35 18 20 22
36 22 17 22 16 23 24 15
15 23 22 20 14 39 22 38
a.) What score is typical to the group of
students?
b.) What score appears to be the median? How
many students fail below that score?
c.) Which score frequently appears?
d.) Find the mean, median and mode.
e.) Describe the data in terms of the mean,
median and mode.
b.) Median = 25, 25, 26, 28, 29, 29, 32, 33, 34, 35,
37, 38, 38, 39, 40, 45, 45, 45, 47
Md = 35 + 35 = 70 = 35
2 2
c. Mode = 45
a.) 14, 15, 15, 15, 16, 16, 16, 17, 17, 18, 18, 18, 18, 20,
20, 20, 21, 22, 22, 22, 22, 22, 22, 23, 23, 23, 24, 25,
25, 28, 32, 32, 33, 35, 35, 36, 38, 38, 39, 43
The score that is typical to the group of
students is 22.
b.) A score that appears to be the median is 22
and there are 15 students who got scores below
22.
c.) A score that frequently appears is 22.
d.) The means is 23.95, the median is 22, and
the mode is 22.
e.)
VI. Assignment
Directions: In your one-half crosswise, find the
mean, median and mode.
1.) Twelve computer students were given a
typing test and the times (in minutes) to
compute the test were as follow:
8, 12, 15, 14, 19, 21, 24, & 38
2.) A shampoo manufacturerproduces a bottle
with an advertised content of 310 ml. A sample
of 16 bottles yielded the following contents:
297 318 306 300 322 307 312 300
311 303 291 298 315 296 309 311

Weitere ähnliche Inhalte

Was ist angesagt?

Lesson plan-advanced algebra Grade 7
Lesson plan-advanced algebra Grade 7Lesson plan-advanced algebra Grade 7
Lesson plan-advanced algebra Grade 7
yhuds
 
Lesson plan in geometry (relationships of angles)
Lesson plan in geometry (relationships of angles)Lesson plan in geometry (relationships of angles)
Lesson plan in geometry (relationships of angles)
Merry Joy Ordinario
 
Lesson Plan in Math 6 for Demo-Teaching [Division of Integers]
Lesson Plan in Math 6 for Demo-Teaching [Division of Integers]Lesson Plan in Math 6 for Demo-Teaching [Division of Integers]
Lesson Plan in Math 6 for Demo-Teaching [Division of Integers]
Rigino Macunay Jr.
 

Was ist angesagt? (20)

Detailed lesson plan in mathematics 7 (circles)
Detailed lesson plan in mathematics 7 (circles)Detailed lesson plan in mathematics 7 (circles)
Detailed lesson plan in mathematics 7 (circles)
 
Lesson plan-advanced algebra Grade 7
Lesson plan-advanced algebra Grade 7Lesson plan-advanced algebra Grade 7
Lesson plan-advanced algebra Grade 7
 
A detailed lesson plan in permutation
A detailed lesson plan in permutationA detailed lesson plan in permutation
A detailed lesson plan in permutation
 
Detailed lesson plan sss congruence postulate
Detailed lesson plan sss congruence postulateDetailed lesson plan sss congruence postulate
Detailed lesson plan sss congruence postulate
 
Math 7 Curriculum Guide rev.2016
Math 7 Curriculum Guide rev.2016Math 7 Curriculum Guide rev.2016
Math 7 Curriculum Guide rev.2016
 
Detailed lesson plan of Similar Triangles in Inductive Method
Detailed lesson plan of Similar Triangles in Inductive MethodDetailed lesson plan of Similar Triangles in Inductive Method
Detailed lesson plan of Similar Triangles in Inductive Method
 
Lesson plan on Linear inequalities in two variables
Lesson plan on Linear inequalities in two variablesLesson plan on Linear inequalities in two variables
Lesson plan on Linear inequalities in two variables
 
Lesson plan (quadrilaterals)
Lesson plan (quadrilaterals)Lesson plan (quadrilaterals)
Lesson plan (quadrilaterals)
 
Lesson plan in geometry (relationships of angles)
Lesson plan in geometry (relationships of angles)Lesson plan in geometry (relationships of angles)
Lesson plan in geometry (relationships of angles)
 
Grade 7 Statistics
Grade 7 StatisticsGrade 7 Statistics
Grade 7 Statistics
 
Concept of angle of elevation and depression
Concept of angle of elevation and depressionConcept of angle of elevation and depression
Concept of angle of elevation and depression
 
Lesson plan on Mean for Ungrouped Data
Lesson plan on Mean for Ungrouped DataLesson plan on Mean for Ungrouped Data
Lesson plan on Mean for Ungrouped Data
 
Final lesson plan in Math (4A's Approach)
Final lesson plan in Math (4A's Approach)Final lesson plan in Math (4A's Approach)
Final lesson plan in Math (4A's Approach)
 
Theorems invloving inequalities in a triangle
Theorems invloving inequalities in a triangleTheorems invloving inequalities in a triangle
Theorems invloving inequalities in a triangle
 
Detailed Lesson Plan in Mathematics
Detailed Lesson Plan in MathematicsDetailed Lesson Plan in Mathematics
Detailed Lesson Plan in Mathematics
 
Lesson Plan in Math 6 for Demo-Teaching [Division of Integers]
Lesson Plan in Math 6 for Demo-Teaching [Division of Integers]Lesson Plan in Math 6 for Demo-Teaching [Division of Integers]
Lesson Plan in Math 6 for Demo-Teaching [Division of Integers]
 
Math 8 Curriculum Guide rev.2016
Math 8 Curriculum Guide rev.2016Math 8 Curriculum Guide rev.2016
Math 8 Curriculum Guide rev.2016
 
Lesson plan in mathematics 9 (illustrations of quadratic equations)
Lesson plan in mathematics 9 (illustrations of quadratic equations)Lesson plan in mathematics 9 (illustrations of quadratic equations)
Lesson plan in mathematics 9 (illustrations of quadratic equations)
 
lesson plan on Addition & subtraction of integers
lesson plan on Addition & subtraction of integerslesson plan on Addition & subtraction of integers
lesson plan on Addition & subtraction of integers
 
Lesson Plan in Algebra
Lesson Plan in AlgebraLesson Plan in Algebra
Lesson Plan in Algebra
 

Ähnlich wie Lesson Plan- Measures of Central tendency of Data

Measures of central tendency (ungrouped data)
Measures of central tendency (ungrouped data)Measures of central tendency (ungrouped data)
Measures of central tendency (ungrouped data)
LilianneSoriano
 
Newly-EDITED-DLP-FINAL-DEMO-Quarter-4-Module_1_Measures-of-Central-Tendency-o...
Newly-EDITED-DLP-FINAL-DEMO-Quarter-4-Module_1_Measures-of-Central-Tendency-o...Newly-EDITED-DLP-FINAL-DEMO-Quarter-4-Module_1_Measures-of-Central-Tendency-o...
Newly-EDITED-DLP-FINAL-DEMO-Quarter-4-Module_1_Measures-of-Central-Tendency-o...
JONASSIBAL
 
Topic 8a Basic Statistics
Topic 8a Basic StatisticsTopic 8a Basic Statistics
Topic 8a Basic Statistics
Yee Bee Choo
 
Addition of large decimals
Addition of large decimalsAddition of large decimals
Addition of large decimals
mark7johnson
 
Mean__Median__Mode__Range.ppt
Mean__Median__Mode__Range.pptMean__Median__Mode__Range.ppt
Mean__Median__Mode__Range.ppt
trader33
 

Ähnlich wie Lesson Plan- Measures of Central tendency of Data (20)

MATH DEMO.pptx
MATH DEMO.pptxMATH DEMO.pptx
MATH DEMO.pptx
 
Measures of central tendency (ungrouped data)
Measures of central tendency (ungrouped data)Measures of central tendency (ungrouped data)
Measures of central tendency (ungrouped data)
 
Digital textbook std ix
Digital textbook std ixDigital textbook std ix
Digital textbook std ix
 
Mean of grouped data.docx
Mean of grouped data.docxMean of grouped data.docx
Mean of grouped data.docx
 
DEMO LESSON PLAN.docx
DEMO LESSON PLAN.docxDEMO LESSON PLAN.docx
DEMO LESSON PLAN.docx
 
Newly-EDITED-DLP-FINAL-DEMO-Quarter-4-Module_1_Measures-of-Central-Tendency-o...
Newly-EDITED-DLP-FINAL-DEMO-Quarter-4-Module_1_Measures-of-Central-Tendency-o...Newly-EDITED-DLP-FINAL-DEMO-Quarter-4-Module_1_Measures-of-Central-Tendency-o...
Newly-EDITED-DLP-FINAL-DEMO-Quarter-4-Module_1_Measures-of-Central-Tendency-o...
 
Measures of Central Tendency.ppt
Measures of Central Tendency.pptMeasures of Central Tendency.ppt
Measures of Central Tendency.ppt
 
Topic 8a Basic Statistics
Topic 8a Basic StatisticsTopic 8a Basic Statistics
Topic 8a Basic Statistics
 
MEAN MEDIAN MODE.ppt
MEAN MEDIAN MODE.pptMEAN MEDIAN MODE.ppt
MEAN MEDIAN MODE.ppt
 
Measures of Central tendency
Measures of Central tendencyMeasures of Central tendency
Measures of Central tendency
 
Addition of large decimals
Addition of large decimalsAddition of large decimals
Addition of large decimals
 
Measures of Central Tendency Final.ppt
Measures of Central Tendency Final.pptMeasures of Central Tendency Final.ppt
Measures of Central Tendency Final.ppt
 
Measures of Central Tendency Final.ppt
Measures of Central Tendency Final.pptMeasures of Central Tendency Final.ppt
Measures of Central Tendency Final.ppt
 
Measures of central tendency by maria diza c. febrio
Measures of central tendency by maria diza c. febrioMeasures of central tendency by maria diza c. febrio
Measures of central tendency by maria diza c. febrio
 
Handling Data 2
Handling Data 2Handling Data 2
Handling Data 2
 
math grade 8Summative ppt
math grade 8Summative pptmath grade 8Summative ppt
math grade 8Summative ppt
 
3. Mean__Median__Mode__Range.ppt
3. Mean__Median__Mode__Range.ppt3. Mean__Median__Mode__Range.ppt
3. Mean__Median__Mode__Range.ppt
 
Mean__Median__Mode__Range.ppt
Mean__Median__Mode__Range.pptMean__Median__Mode__Range.ppt
Mean__Median__Mode__Range.ppt
 
stat.ppt
stat.pptstat.ppt
stat.ppt
 
Chapter 3.2
Chapter 3.2Chapter 3.2
Chapter 3.2
 

Mehr von Elton John Embodo

Mehr von Elton John Embodo (20)

EMBODO Lesson Plan Grade 9 Law of Sines.docx
EMBODO Lesson Plan Grade 9 Law of Sines.docxEMBODO Lesson Plan Grade 9 Law of Sines.docx
EMBODO Lesson Plan Grade 9 Law of Sines.docx
 
EMBODO LP Grade 12 Mean and Variance of the Sampling Distribution of the Samp...
EMBODO LP Grade 12 Mean and Variance of the Sampling Distribution of the Samp...EMBODO LP Grade 12 Mean and Variance of the Sampling Distribution of the Samp...
EMBODO LP Grade 12 Mean and Variance of the Sampling Distribution of the Samp...
 
EMBODO LP Grade 11 Anti-derivative of Polynomial Functions .docx
EMBODO LP Grade 11 Anti-derivative of Polynomial Functions .docxEMBODO LP Grade 11 Anti-derivative of Polynomial Functions .docx
EMBODO LP Grade 11 Anti-derivative of Polynomial Functions .docx
 
Grade 10 Detailed Lesson Plan on Combination.docx
Grade 10 Detailed Lesson Plan on Combination.docxGrade 10 Detailed Lesson Plan on Combination.docx
Grade 10 Detailed Lesson Plan on Combination.docx
 
Grade-7 5As Lesson Plan on Pairs of Angles formed by Parallel Lines Cut by a ...
Grade-7 5As Lesson Plan on Pairs of Angles formed by Parallel Lines Cut by a ...Grade-7 5As Lesson Plan on Pairs of Angles formed by Parallel Lines Cut by a ...
Grade-7 5As Lesson Plan on Pairs of Angles formed by Parallel Lines Cut by a ...
 
5As Lesson Plan on Pairs of Angles Formed by Parallel Lines Cut by a Transversal
5As Lesson Plan on Pairs of Angles Formed by Parallel Lines Cut by a Transversal5As Lesson Plan on Pairs of Angles Formed by Parallel Lines Cut by a Transversal
5As Lesson Plan on Pairs of Angles Formed by Parallel Lines Cut by a Transversal
 
Tips on Micro-Teaching Face-To-Face and virual
Tips on Micro-Teaching Face-To-Face and virualTips on Micro-Teaching Face-To-Face and virual
Tips on Micro-Teaching Face-To-Face and virual
 
Developmental Method of Lesson Plan on Solving systems of linear equations b...
Developmental Method of Lesson Plan on  Solving systems of linear equations b...Developmental Method of Lesson Plan on  Solving systems of linear equations b...
Developmental Method of Lesson Plan on Solving systems of linear equations b...
 
Outcomes based teaching learning plan (obtlp) trigonometry
Outcomes based teaching learning plan (obtlp) trigonometryOutcomes based teaching learning plan (obtlp) trigonometry
Outcomes based teaching learning plan (obtlp) trigonometry
 
Outcomes based teaching learning plan (obtlp) technology and instrumentation ...
Outcomes based teaching learning plan (obtlp) technology and instrumentation ...Outcomes based teaching learning plan (obtlp) technology and instrumentation ...
Outcomes based teaching learning plan (obtlp) technology and instrumentation ...
 
Outcomes based teaching learning plan (obtlp) number theory 2
Outcomes based teaching learning plan (obtlp) number theory 2Outcomes based teaching learning plan (obtlp) number theory 2
Outcomes based teaching learning plan (obtlp) number theory 2
 
Outcomes based teaching learning plan (obtlp)- modern geometry 1st rev
Outcomes based teaching learning plan (obtlp)- modern geometry 1st revOutcomes based teaching learning plan (obtlp)- modern geometry 1st rev
Outcomes based teaching learning plan (obtlp)- modern geometry 1st rev
 
Outcomes based teaching learning plan (obtlp) mathematics of investment 1st rev
Outcomes based teaching learning plan (obtlp) mathematics of investment 1st revOutcomes based teaching learning plan (obtlp) mathematics of investment 1st rev
Outcomes based teaching learning plan (obtlp) mathematics of investment 1st rev
 
Outcomes based teaching learning plan (obtlp) logic and set theory
Outcomes based teaching learning plan (obtlp) logic and set theoryOutcomes based teaching learning plan (obtlp) logic and set theory
Outcomes based teaching learning plan (obtlp) logic and set theory
 
Outcomes based teaching learning plan (obtlp) linear algebra 1st rev
Outcomes based teaching learning plan (obtlp) linear algebra 1st revOutcomes based teaching learning plan (obtlp) linear algebra 1st rev
Outcomes based teaching learning plan (obtlp) linear algebra 1st rev
 
Outcomes based teaching learning plan (obtlp) history of mathematics!
Outcomes based teaching learning plan (obtlp) history of mathematics!Outcomes based teaching learning plan (obtlp) history of mathematics!
Outcomes based teaching learning plan (obtlp) history of mathematics!
 
Outcomes based teaching learning plan (obtlp) graph theroy
Outcomes based teaching learning plan (obtlp) graph theroyOutcomes based teaching learning plan (obtlp) graph theroy
Outcomes based teaching learning plan (obtlp) graph theroy
 
Outcomes based teaching learning plan (obtlp) elementary statistics & pro...
Outcomes based teaching learning plan (obtlp) elementary statistics & pro...Outcomes based teaching learning plan (obtlp) elementary statistics & pro...
Outcomes based teaching learning plan (obtlp) elementary statistics & pro...
 
Outcomes based teaching learning plan (obtlp) ed 105 the community, the teac...
Outcomes based teaching learning plan (obtlp) ed 105  the community, the teac...Outcomes based teaching learning plan (obtlp) ed 105  the community, the teac...
Outcomes based teaching learning plan (obtlp) ed 105 the community, the teac...
 
Outcomes based teaching learning plan (obtlp) ed 104 foundation of special an...
Outcomes based teaching learning plan (obtlp) ed 104 foundation of special an...Outcomes based teaching learning plan (obtlp) ed 104 foundation of special an...
Outcomes based teaching learning plan (obtlp) ed 104 foundation of special an...
 

Kürzlich hochgeladen

Russian Escort Service in Delhi 11k Hotel Foreigner Russian Call Girls in Delhi
Russian Escort Service in Delhi 11k Hotel Foreigner Russian Call Girls in DelhiRussian Escort Service in Delhi 11k Hotel Foreigner Russian Call Girls in Delhi
Russian Escort Service in Delhi 11k Hotel Foreigner Russian Call Girls in Delhi
kauryashika82
 
Activity 01 - Artificial Culture (1).pdf
Activity 01 - Artificial Culture (1).pdfActivity 01 - Artificial Culture (1).pdf
Activity 01 - Artificial Culture (1).pdf
ciinovamais
 
Gardella_PRCampaignConclusion Pitch Letter
Gardella_PRCampaignConclusion Pitch LetterGardella_PRCampaignConclusion Pitch Letter
Gardella_PRCampaignConclusion Pitch Letter
MateoGardella
 
Making and Justifying Mathematical Decisions.pdf
Making and Justifying Mathematical Decisions.pdfMaking and Justifying Mathematical Decisions.pdf
Making and Justifying Mathematical Decisions.pdf
Chris Hunter
 
1029-Danh muc Sach Giao Khoa khoi 6.pdf
1029-Danh muc Sach Giao Khoa khoi  6.pdf1029-Danh muc Sach Giao Khoa khoi  6.pdf
1029-Danh muc Sach Giao Khoa khoi 6.pdf
QucHHunhnh
 
1029 - Danh muc Sach Giao Khoa 10 . pdf
1029 -  Danh muc Sach Giao Khoa 10 . pdf1029 -  Danh muc Sach Giao Khoa 10 . pdf
1029 - Danh muc Sach Giao Khoa 10 . pdf
QucHHunhnh
 
Gardella_Mateo_IntellectualProperty.pdf.
Gardella_Mateo_IntellectualProperty.pdf.Gardella_Mateo_IntellectualProperty.pdf.
Gardella_Mateo_IntellectualProperty.pdf.
MateoGardella
 
An Overview of Mutual Funds Bcom Project.pdf
An Overview of Mutual Funds Bcom Project.pdfAn Overview of Mutual Funds Bcom Project.pdf
An Overview of Mutual Funds Bcom Project.pdf
SanaAli374401
 

Kürzlich hochgeladen (20)

Grant Readiness 101 TechSoup and Remy Consulting
Grant Readiness 101 TechSoup and Remy ConsultingGrant Readiness 101 TechSoup and Remy Consulting
Grant Readiness 101 TechSoup and Remy Consulting
 
Sports & Fitness Value Added Course FY..
Sports & Fitness Value Added Course FY..Sports & Fitness Value Added Course FY..
Sports & Fitness Value Added Course FY..
 
Russian Escort Service in Delhi 11k Hotel Foreigner Russian Call Girls in Delhi
Russian Escort Service in Delhi 11k Hotel Foreigner Russian Call Girls in DelhiRussian Escort Service in Delhi 11k Hotel Foreigner Russian Call Girls in Delhi
Russian Escort Service in Delhi 11k Hotel Foreigner Russian Call Girls in Delhi
 
Mixin Classes in Odoo 17 How to Extend Models Using Mixin Classes
Mixin Classes in Odoo 17  How to Extend Models Using Mixin ClassesMixin Classes in Odoo 17  How to Extend Models Using Mixin Classes
Mixin Classes in Odoo 17 How to Extend Models Using Mixin Classes
 
Activity 01 - Artificial Culture (1).pdf
Activity 01 - Artificial Culture (1).pdfActivity 01 - Artificial Culture (1).pdf
Activity 01 - Artificial Culture (1).pdf
 
SOCIAL AND HISTORICAL CONTEXT - LFTVD.pptx
SOCIAL AND HISTORICAL CONTEXT - LFTVD.pptxSOCIAL AND HISTORICAL CONTEXT - LFTVD.pptx
SOCIAL AND HISTORICAL CONTEXT - LFTVD.pptx
 
ICT Role in 21st Century Education & its Challenges.pptx
ICT Role in 21st Century Education & its Challenges.pptxICT Role in 21st Century Education & its Challenges.pptx
ICT Role in 21st Century Education & its Challenges.pptx
 
Presentation by Andreas Schleicher Tackling the School Absenteeism Crisis 30 ...
Presentation by Andreas Schleicher Tackling the School Absenteeism Crisis 30 ...Presentation by Andreas Schleicher Tackling the School Absenteeism Crisis 30 ...
Presentation by Andreas Schleicher Tackling the School Absenteeism Crisis 30 ...
 
Mehran University Newsletter Vol-X, Issue-I, 2024
Mehran University Newsletter Vol-X, Issue-I, 2024Mehran University Newsletter Vol-X, Issue-I, 2024
Mehran University Newsletter Vol-X, Issue-I, 2024
 
APM Welcome, APM North West Network Conference, Synergies Across Sectors
APM Welcome, APM North West Network Conference, Synergies Across SectorsAPM Welcome, APM North West Network Conference, Synergies Across Sectors
APM Welcome, APM North West Network Conference, Synergies Across Sectors
 
This PowerPoint helps students to consider the concept of infinity.
This PowerPoint helps students to consider the concept of infinity.This PowerPoint helps students to consider the concept of infinity.
This PowerPoint helps students to consider the concept of infinity.
 
Gardella_PRCampaignConclusion Pitch Letter
Gardella_PRCampaignConclusion Pitch LetterGardella_PRCampaignConclusion Pitch Letter
Gardella_PRCampaignConclusion Pitch Letter
 
Ecological Succession. ( ECOSYSTEM, B. Pharmacy, 1st Year, Sem-II, Environmen...
Ecological Succession. ( ECOSYSTEM, B. Pharmacy, 1st Year, Sem-II, Environmen...Ecological Succession. ( ECOSYSTEM, B. Pharmacy, 1st Year, Sem-II, Environmen...
Ecological Succession. ( ECOSYSTEM, B. Pharmacy, 1st Year, Sem-II, Environmen...
 
Making and Justifying Mathematical Decisions.pdf
Making and Justifying Mathematical Decisions.pdfMaking and Justifying Mathematical Decisions.pdf
Making and Justifying Mathematical Decisions.pdf
 
PROCESS RECORDING FORMAT.docx
PROCESS      RECORDING        FORMAT.docxPROCESS      RECORDING        FORMAT.docx
PROCESS RECORDING FORMAT.docx
 
1029-Danh muc Sach Giao Khoa khoi 6.pdf
1029-Danh muc Sach Giao Khoa khoi  6.pdf1029-Danh muc Sach Giao Khoa khoi  6.pdf
1029-Danh muc Sach Giao Khoa khoi 6.pdf
 
1029 - Danh muc Sach Giao Khoa 10 . pdf
1029 -  Danh muc Sach Giao Khoa 10 . pdf1029 -  Danh muc Sach Giao Khoa 10 . pdf
1029 - Danh muc Sach Giao Khoa 10 . pdf
 
Código Creativo y Arte de Software | Unidad 1
Código Creativo y Arte de Software | Unidad 1Código Creativo y Arte de Software | Unidad 1
Código Creativo y Arte de Software | Unidad 1
 
Gardella_Mateo_IntellectualProperty.pdf.
Gardella_Mateo_IntellectualProperty.pdf.Gardella_Mateo_IntellectualProperty.pdf.
Gardella_Mateo_IntellectualProperty.pdf.
 
An Overview of Mutual Funds Bcom Project.pdf
An Overview of Mutual Funds Bcom Project.pdfAn Overview of Mutual Funds Bcom Project.pdf
An Overview of Mutual Funds Bcom Project.pdf
 

Lesson Plan- Measures of Central tendency of Data

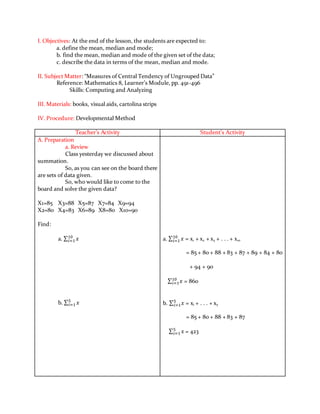
  • 1. I. Objectives: At the end of the lesson, the students are expected to: a. define the mean, median and mode; b. find the mean, median and mode of the given set of the data; c. describe the data in terms of the mean, median and mode. II. Subject Matter: “Measures of Central Tendency of Ungrouped Data” Reference: Mathematics 8, Learner’s Module, pp. 491-496 Skills: Computing and Analyzing III. Materials: books, visual aids, cartolina strips IV. Procedure: Developmental Method Teacher’s Activity Student’s Activity A. Preparation a. Review Class yesterday we discussed about summation. So, as you can see on the board there are sets of data given. So, who would like to come to the board and solve the given data? X1=85 X3=88 X5=87 X7=84 X9=94 X2=80 X4=83 X6=89 X8=80 X10=90 Find: a. ∑ 𝑥10 𝑖=1 b. ∑ 𝑥5 𝑖=1 a. ∑ 𝑥10 𝑖=1 = x1 + x2 + x3 + . . . + x10 = 85 + 80 + 88 + 83 + 87 + 89 + 84 + 80 + 94 + 90 ∑ 𝑥10 𝑖=1 = 860 b. ∑ 𝑥5 𝑖=1 = xi + . . . + x5 = 85 + 80 + 88 + 83 + 87 ∑ 𝑥5 𝑖=1 = 423
  • 2. c. ∑ 𝑥10 𝑖=6 b. Motivation Class the data from X1 to X10 are 85, 80, 88, 83, 87, 89, 84, 80, 94 and 90. Arranging these in increasing order, that is from least to greatest 80,80,83,84,85,87,88,89,90 and 94. Class, what do you observe with the data? Yes,_____________ That’s right! Class if I am going to use these data 80, 80, 83, 84, 85, 87, 88, 90 and 94 as the math grades of 10 students. And aside from adding these data with the use of summation method, do you know that these data can also be summarized into a single number or single data? B. Presentation So be with me this morning class, as I discuss to you about “Measures of central Tendency (Ungrouped Data)”. Everybody read! a. Statement of the aim Class listen carefully because after my discussion you will be asked to define the mean, median and mode, find the mean, median and mode of the given set of data and lastly, you will be asked to describe the data in terms of the mean, median, and mode. Am I understood class? c. ∑ 𝑥10 𝑖=6 = x6 + x7 + . . . + x10 = 89 + 84 + 80 + 94 + 90 ∑ 𝑥10 𝑖=6 = 437 The data given are all number. No, ma’am “Measures of Central Tendency of Ungrouped Data” Yes, ma’am
  • 3. C. Developmental Proper Okay class there are three measures of central tendency, first one is the mean. Mean – is the most commonly used measure of central tendency. It is used to describe a set of data where the measures cluster or concentrate at a point. It is found by adding the values of the data and dividing by the total number of values. It is given with the formula 𝑥̅ = Ʃ𝑥 𝑁 Where: Ʃx = the summation of x or (the sum of the measure) N = number of the values of x First example: 80, 80, 83, 84, 85, 87, 88, 89, 90, 94 So from the formula given, let us now try to analyze and then substitute the given values to the given formula. 𝑥̅ = Ʃ𝑥 𝑁 𝑥̅ = 80+80+83+84+85+87+88+89+90+94 10 Hence, the mean grade of the ten students is 86. Second example: The five players of basketball team have the scores of 10, 15, 20, 10, and 25. Find the mean: 𝑥̅ = Ʃ𝑥 𝑁 𝑥̅ = 10+15+20+10+25 5 𝑥̅ = 80 5 𝑥̅ = 16 𝑥̅= 86
  • 4. Therefore, the mean score of five players of basketball is equal to 16. Do you understand class on how to find the mean of the given data? Is there any question? Okay let us proceed to the second measure of central tendency. Median – is the midpoint of the array. The median will be either a specific value or will fall between two values. First example: Using the same data above. The math grades of ten students are 85, 80, 88, 83, 87, 89, 84, 80, 94, and 90. Find the median. Solution: To find the median, we need to arrange first the data in increasing order that is from least to greatest or vice versa. 80, 80, 83, 84, 85, 87, 88, 89, 90, 94 Since the middle point falls halfway between 85 and 87, so in order to get the median, we need get the mean 0f these two values. Median = 85+87 2 Median = 172 2 Median = 86 Therefore, the median of the given data is 86. Yes, ma’am No, ma’am
  • 5. Second example: 10, 15, 20, 10, 25 Solution: Arrange the data in increasing order, from least to greatest or from greatest to least. 10, 10, 15, 20, 25 Median= 15 Third example: Using the same formula. The weights of nine boxing players are recorded as follows (in pounds). 206,215,305,206,265,265,297,282,301 Now try to solve it in your notebook and then I will be calling somebody to answer it on the board. So do you understand class on how to find the median of a set of data? Is there any question? Okay let us proceed to the next measure of central tendency. Mode- it is the value that occurs most often in the data set. It is the value with the greatest frequency. A data can have more than one or none at all. To find the mode for a set of data we are to consider the following: Solution: Arrange first the data in increasing order, from least to greatest on vice versa. 206, 206, 215, 265, 282, 297, 301, 305 Median = 265 Yes, ma’am No, ma’am
  • 6. 1.) Select the measure that appears most often in the set. 2.) If two or more measures appear the same number of times, then each of these values is a mode. 3.) If every measure appears the same number of times, then the set of data has no mode. First example: Using the same data above. 80,80,83,84,85,87,88,89,90,94 Since 80 is the value that most often occur in the given data, therefore 80 is the mode. Second example: 206,206,215,265,265,282,297,301,305 So now I want you to solve or to get the mode of the given data. Very good! Class, is everything clear? Do you have question? D. Values Integration Class a while ago, we discuss about on how to measure central tendency of ungrouped data. From the word central class, we can associate it with the word center. How will you define the word center? Yes,___________ That’s right! 206, 206, 215, 265, 265, 282, 297, 301 305 The modes of the given data are 206 and 265, since these are the values that most often occur in the given data. Yes, Ma’am None, Ma’am It is the middle part of everything around us.
  • 7. Now, how about in your real life situation class, who is the center of your life? Yes,___________ Another idea? Yes,___________ Very good! How about God, did you also make Him as the center of your life? Why did you make God as the center of your life? Yes,___________ Exactly! So class, whoever is the center of our life we should not forget God because He is the source of everything. Whatever decision or thing we will make, we should not forget God because without Him we are nothing. E. Application Activity 1 Directions: Find the mean, median, and mode of the following set of data. 1.) The data below show the score of 20 students in a Biology quiz. 25 33 35 45 34 26 29 35 38 40 45 38 28 29 25 39 32 27 47 45 The center of my life is my family. The center of my life is my mother. Yes, ma’am I always make God as the center of my life because I know ma’am with god nothing is impossible. a.) Mean x = ∑ 𝑥 N = 25 + 26 + 45 + 39 + 33 + 29 + 38 + 32 + 35 + 35 + 28 + 37 + 45 + 38 + 29 + 47 + 34 + 40 + 25 + 45 x = 705 = 35.25 20
  • 8. V. Evaluation Directions: The data below show the score of 40 students in the 2012 Division Achievement Test (DAT). Analyze the given data and answer the questions below. 35 16 28 43 21 17 15 16 20 18 25 22 33 18 32 38 23 32 18 25 35 18 20 22 36 22 17 22 16 23 24 15 15 23 22 20 14 39 22 38 a.) What score is typical to the group of students? b.) What score appears to be the median? How many students fail below that score? c.) Which score frequently appears? d.) Find the mean, median and mode. e.) Describe the data in terms of the mean, median and mode. b.) Median = 25, 25, 26, 28, 29, 29, 32, 33, 34, 35, 37, 38, 38, 39, 40, 45, 45, 45, 47 Md = 35 + 35 = 70 = 35 2 2 c. Mode = 45 a.) 14, 15, 15, 15, 16, 16, 16, 17, 17, 18, 18, 18, 18, 20, 20, 20, 21, 22, 22, 22, 22, 22, 22, 23, 23, 23, 24, 25, 25, 28, 32, 32, 33, 35, 35, 36, 38, 38, 39, 43 The score that is typical to the group of students is 22. b.) A score that appears to be the median is 22 and there are 15 students who got scores below 22. c.) A score that frequently appears is 22. d.) The means is 23.95, the median is 22, and the mode is 22. e.)
  • 9. VI. Assignment Directions: In your one-half crosswise, find the mean, median and mode. 1.) Twelve computer students were given a typing test and the times (in minutes) to compute the test were as follow: 8, 12, 15, 14, 19, 21, 24, & 38 2.) A shampoo manufacturerproduces a bottle with an advertised content of 310 ml. A sample of 16 bottles yielded the following contents: 297 318 306 300 322 307 312 300 311 303 291 298 315 296 309 311